Parent: StrategyBase
UserStrategyBase represents a trading Strategy in WealthLab. When you work with C# Code-Based Strategies, you are actually coding a custom class that is derived from UserStrategyBase. The class provides properties and methods that let you control the logic of the trading system, including placing orders and examining the current state of the system.
You hook into the trading system logic by overriding several virtual methods in UserStrategyBase. These methods pass as a parameter the instance of the BarHistory object that contains the historical data to backtest. The following are the most important methods:
- Initialize - the backtester calls this once at the start of processing
- Execute - the backtester calls this once for each data point in the BarHistory being backtested, and you are supplied the index that is should be processed in each iteration
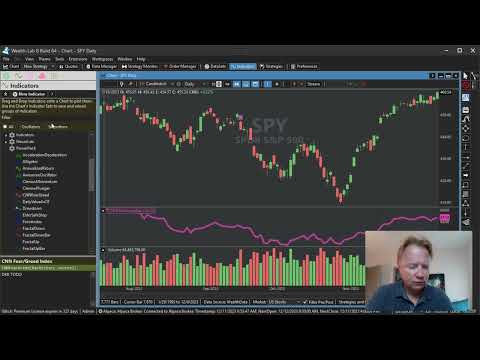
For a demonstration, see linked Youtube video:
Draws the specified text or TextShape above or below the specified bar on the chart, using the specified color and fontSize. The text is centered, unless you pass false to the optional center parameter. The final optional font parameter allows you to specify a different WealthLab.Core.Font to use. The behindBars parameter controls whether the drawing is made behind the rendered chart bars, or above them.
Remarks
- See TextShape in the Enums class reference.
- Examples:
TextShape.CircleCrosshair,TextShape.SquareHollow,TextShape.ArrowUp
using WealthLab.Backtest;
using System;
using WealthLab.Core;
using WealthLab.Indicators;
using WealthLab.ChartWPF;
using System.Drawing;
using System.Collections.Generic;

namespace WealthLab
{
    public class MyStrategy : UserStrategyBase
    {
	    //annotate bullish and bearish "outside bars"
        public override void Execute(BarHistory bars, int idx)
        {
	        if (idx == 0)
				return;
			if (bars.High[idx] > bars.High[idx - 1] && bars.Low[idx] < bars.Low[idx - 1])
			{
				bool isBullish = bars.Close[idx] > bars.Open[idx];
				string annotation = isBullish ? "Bullish" : "bearish";
				WLColor c = isBullish ? WLColor.Green : WLColor.Red;
				DrawBarAnnotation(annotation, idx, isBullish, c, 6);
			}
        }

    }
}
Draws the specified text at the top or bottom of the pane and at a specified offsetXPercent from the left edge of the chart, where 0 is the left edge and 100 is the right edge.
To draw along the top edge, pass true for the top parameter. Positive values for offsetY move text a number of pixels toward the middle of the chart.
The color parameter determines the text's color, and the fontSize parameter determines its size. A size of 12 is standard for chart text rendering.
The behindBars parameter controls whether the drawing is made behind the rendered chart bars, or above them.
DrawBorderText has several optional parameters that let you further customize the text:
- paneTag - lets you control which pane the text is rendered to. Possible values are "Price", "Volume", or an indicator pane tag such as "RSI" or "CMO".
- centerText - *true specifies that the text should be centered at the location identified by offsetXPercent. If false (the default value) it renders with the left edge beginning at that point.
- font - specifies the Font to use to render the text, as an instance of the WealthLab.Core.Font class.
using WealthLab.Backtest;
using System;
using WealthLab.Core;

namespace WealthScript2
{
    public class BorderTextDemo : UserStrategyBase
    {
        public override void Initialize(BarHistory bars)
        {
			//show the last price in a fuschia box in the middle/bottom of the Price pane
			bool centertext = false;

			SetTextDrawingOptions(WLColor.Transparent, WLColor.Fuchsia, 1);
			DrawBorderText(bars.Close.LastValue.ToString("N2"), false, 50, 10, WLColor.Fuchsia, 20, "Price", centertext, null, false);

			SetTextDrawingOptions(WLColor.Transparent, WLColor.Transparent, 1);
			DrawBorderText("Price:", false, 50, 40, WLColor.White, 12, "Price", centertext, null, false);
		}

        public override void Execute(BarHistory bars, int idx)
        { }
    }
}
Draws the specified text rotated -90 degrees at the bottom of the pane and at a specified bar number. Use it to identify dates or events on a specific bar without cluttering the area around prices.
Positive values for horizontalOffset move the text the same number of pixels to the right. By default, the bottom of the text will be to the left of the specified bar. To center the text on the bar, pass half the font size for horizontalOffset.
The color parameter determines the text's color, and the fontSize parameter determines its size. A size of 12 is standard for chart text rendering.
The behindBars parameter controls whether the drawing is made behind the rendered chart bars, or above them.
DrawBottomText has several optional parameters that let you further customize the text:
- paneTag - lets you control which pane the text is rendered to. Possible values are "Price", "Volume", or an indicator pane tag such as "RSI" or "CMO".
- font - specifies the Font to use to render the text, as an instance of the WealthLab.Core.Font class.
using System;
using WealthLab.Backtest;
using WealthLab.Core;
using WealthLab.Data;
using WealthLab.Indicators;

namespace WealthScript1
{
    public class DrawOptionDates : UserStrategyBase
    {
        public override void Initialize(BarHistory bars)
        {
			// Show regular option expiration dates
			int bar = 0;
			double max = Highest.Value(bars.Count - 1, bars.High, bars.Count - 1);
			while (bar >= 0 && bar < bars.Count - 1)
			{
				DateTime exdate = bars.NextOptionExpiryDate(bar);
				WriteToDebugLog(exdate);
				bar = bars.IndexOf(exdate, false);
				if (bar < 0)
					break;

				DrawLine(bar, max, bar, 0, WLColor.NeonOrange, 1, LineStyle.Dashed, behindBars: true);
				DrawBottomText(exdate.ToShortDateString(), bar, 0, WLColor.NeonOrange, 12);

				while (bar < bars.Count && bars.DateTimes[bar].Date <= exdate)
					bar++;
			}

			StartIndex = 1;
        }

        public override void Execute(BarHistory bars, int idx)
        {
        }
    }
}
Draw a dot on that chart at the specified bar number and price value. The color parameter determines the color of the dot, and the radius parameter determines its size. The behindBars parameter controls whether the drawing is made behind the rendered chart bars, or above them.
Remarks
- See PlotStopsAndLimits to automatically draw dots at stop and limit prices on bars where the Transactions (orders) are active.
using WealthLab.Backtest;
using System;
using WealthLab.Core;
using WealthLab.Indicators;
using System.Drawing;
using System.Collections.Generic;

namespace WealthLab
{
	public class MyStrategy14 : UserStrategyBase
	{
		private BBLower lowerBollingerBand;
		private BBUpper upperBollingerBand;
		private ATR atr;
		private double stopLevel;

		double atrStop;

		public override void Initialize(BarHistory bars)
		{
			lowerBollingerBand = new BBLower(bars.Close, 20, 2.0);
			upperBollingerBand = new BBUpper(bars.Close, 20, 2.0);
			PlotIndicator(lowerBollingerBand, WLColor.Navy, PlotStyle.Bands);
			atr = new ATR(bars, 14);
			PlotIndicator(atr);
		}

		public override void Execute(BarHistory bars, int idx)
		{
			if (idx < 20)
				return;

			if (HasOpenPosition(bars, PositionType.Long) == false)
			{
				if (bars.Low[idx] <= lowerBollingerBand[idx] && bars.Close[idx] > lowerBollingerBand[idx])
				{
					SetBackgroundColor(bars, idx, WLColor.LightGreen, "Price");
					PlaceTrade(bars, TransactionType.Buy, OrderType.Limit, bars.Close[idx]);
					atrStop = bars.Close[idx] - atr[idx] * 2;
					DrawDot(idx, atrStop, WLColor.Red, 2);
					PlaceTrade(bars, TransactionType.Sell, OrderType.Stop, atrStop);
				}
			}
			else
			{
				//uncomment this line to use a fixed stop level calculated at entry time
				//atrStop = bars.Close[idx] - atr[idx] * 2;
				DrawDot(idx, atrStop, WLColor.Red, 2);
				PlaceTrade(bars, TransactionType.Sell, OrderType.Stop, atrStop);
				SetBackgroundColor(bars, idx, WLColor.LightPink, "Price");
				PlaceTrade(bars, TransactionType.Sell, OrderType.Limit, upperBollingerBand[idx]);
			}
		}
	}
}
Draws an ellipse on the chart using the specified parameters, color, line width, and style. The behindBars parameter controls whether the drawing is made behind the rendered chart bars, or above them.
using WealthLab.Backtest;
using System;
using WealthLab.Core;
using WealthLab.Indicators;
using WealthLab.ChartWPF;
using System.Drawing;
using System.Collections.Generic;

namespace WealthLab
{
    public class MyStrategy : UserStrategyBase
    {
        //draw an ellipse arounf the last 100 bar range
        public override void Initialize(BarHistory bars)
        {
	        if (bars.Count < 100)
				return;
			double highest = bars.High.GetHighest(bars.Count - 1, 100);
			double lowest = bars.Low.GetLowest(bars.Count - 1, 100);
			DrawEllipse(bars.Count - 99, highest, bars.Count - 1, lowest, WLColor.Navy, 3);
        }

        //execute the strategy rules here, this is executed once for each bar in the backtest history
        public override void Execute(BarHistory bars, int idx)
        {
        }

        //declare private variables below

    }
}
Draws the specified text on the chart, under the upper left hand corner box that displays the symbol and price values. The first overload allows you to control the color and fontSize of the text. Both overloads have a final, optional, parameter paneTag that defaults to "Price". Specify a different paneTag to draw the text in a different pane. The behindBars parameter controls whether the drawing is made behind the rendered chart bars, or above them.
using WealthLab.Backtest;
using System;
using WealthLab.Core;
using WealthLab.Indicators;
using WealthLab.ChartWPF;
using System.Drawing;
using System.Collections.Generic;

namespace WealthLab
{
    public class MyStrategy : UserStrategyBase
    {
        //display some information on the chart
        public override void Initialize(BarHistory bars)
        {
			double smaVal = SMA.Value(bars.Count - 1, bars.Close, 20);
			double closingVal = bars.Close[bars.Count - 1];
			double diff = closingVal - smaVal;
			double pctDiff = (diff * 100.0) / smaVal;
	        if (diff < 0)
				DrawHeaderText("Price is " + (-pctDiff).ToString("N2") + "% below SMA(20)", WLColor.Red);
	        else
				DrawHeaderText("Price is " + pctDiff.ToString("N2") + "% above SMA(20)", WLColor.Green);
        }

        public override void Execute(BarHistory bars, int idx)
        {
        }

    }
}
Draws the text specified in hintText either above or below (aboveBar parameter) the bar of the chart specified in the idx parameter. When the user hovers the mouse over the hint text, a popup box appears on the chart containing the text from the bodyText parameter. The final three optional parameters allow you to control the color of the hint text, hint text background, and text, respectively.
using WealthLab.Core;
using WealthLab.Backtest;

namespace WealthScript1
{
    public class MyStrategy : UserStrategyBase
    {
        //create indicators and other objects here, this is executed prior to the main trading loop
        public override void Initialize(BarHistory bars)
        {
			DrawHint("✪", "This is a very special bar of data!\nIt so happens that this is the 10th bar\nfrom the last.", bars.Count - 10, true, WLColor.Blue, WLColor.LightBlue);
        }

        //execute the strategy rules here, this is executed once for each bar in the backtest history
        public override void Execute(BarHistory bars, int idx)
        {
        }
    }
}
Draws a horizontal line on the chart at the specified value, using the specified color, line width, and style. The behindBars parameter controls whether the drawing is made behind the rendered chart bars, or above them.
using WealthLab.Backtest;
using System;
using WealthLab.Core;
using WealthLab.Indicators;
using System.Drawing;
using System.Collections.Generic;

namespace WealthScript123
{
	public class DrawHorzLineExample : UserStrategyBase
	{
		IndicatorBase _rsi;

		public override void Initialize(BarHistory bars)
		{
			//put a line at the most recent closing price
			DrawHorzLine(bars.Close[bars.Count - 1], WLColor.Green);

			//put a line on the volume pane at 10,000,000
			DrawHorzLine(10e6, WLColor.Blue, 1, LineStyle.Dashed, "Volume");

			_rsi = RSI.Series(bars.Close, 14);
			PlotIndicatorLine(_rsi);

			//put a line at an oversold level, say 40
			DrawHorzLine(40, WLColor.Red, 1, LineStyle.Solid, _rsi.PaneTag);
		}

		public override void Execute(BarHistory bars, int idx)
		{
			if (!HasOpenPosition(bars, PositionType.Long))
			{
				//code your buy conditions here
			}
			else
			{
				//code your sell conditions here
			}
		}


	}
}
Draws the specified Image on the chart, at the specified location. The behindBars parameter controls whether the drawing is made behind the rendered chart bars, or above them.
Remarks
- To run the example, modify the Bitmap.FromFile() statement to point to an image file on your computer.
using WealthLab.Backtest;
using System;
using WealthLab.Core;
using WealthLab.Indicators;
using WealthLab.ChartWPF;
using System.Drawing;
using System.Collections.Generic;

namespace WealthLab
{
	public class MyStrategy : UserStrategyBase
	{
		//create indicators and other objects here, this is executed prior to the main trading loop
		public override void Initialize(BarHistory bars)
		{
			cmo = new CMO(bars.Close, 20);
			PlotIndicatorLine(cmo);
			img = (Bitmap)Bitmap.FromFile(@"C:\Images\BuyArrow.bmp");
			img.MakeTransparent(Color.White);
		}

		//draw arrows on the chart where CMO oscillator turns up from oversold area
		public override void Execute(BarHistory bars, int idx)
		{
			if (cmo[idx] < cmo.OversoldLevel)
				if (cmo.TurnsUp(idx))
				{
					DrawImage(img, idx, bars.Low[idx], "Price", 5);
					SetBackgroundColor(bars, idx, c);
				}
		}

		//declare private variables below
		private CMO cmo;
		private Bitmap img;
		WLColor c = WLColor.FromArgb(32, 255, 0, 0);
	}
}
Draws the specified Image on the chart, at the specified location. The behindBars parameter controls whether the drawing is made behind the rendered chart bars, or above them.
Remarks
- x and y are pixels, where [0, 0] is the top left of the pane.
- To locate the bottom of the image at the bottom of the pane, pass
Double.MaxValuefor the y parameter.
using WealthLab.Backtest;
using System;
using WealthLab.Core;
using System.Drawing;
using ScottPlot;

namespace WealthScript1
{
	public class ScottPlot_DrawImageAt : UserStrategyBase
	{
		//create a bitmap with an OHLC chart using ScottPlot
		Bitmap getBitmap(BarHistory bars)
		{
			//a ScottPlot object for charting
			Plot plt = new ScottPlot.Plot(300, 200);
			plt.Title(bars.Symbol);
			plt.YLabel("Price"); plt.XAxis.Ticks(false);

			double[] _bars = new double[bars.Count];
			OHLC[] _ohlc = new OHLC[bars.Count];

			for (int i = 0; i < bars.Count; i++)
				_bars[i] = bars.DateTimes[i].ToOADate();

			//fill OHLC values
			for (int i = 0; i < bars.Count; i++)
				_ohlc[i] = new OHLC(bars.Open[i], bars.High[i], bars.Low[i], bars.Close[i], bars.DateTimes[i], new TimeSpan(1, 0, 0, 0, 0));

			//make the bar plot
			plt.AddOHLCs(_ohlc);

			//render chart and draw image at the top left corner
			Bitmap bmp = plt.Render();
			bmp.MakeTransparent(Color.White);

			return bmp;
		}

		public override void Initialize(BarHistory bars)
		{
			//get 4 BarHistory objects
			BarHistory qqq = GetHistory(bars, "QQQ");
			BarHistory spy = GetHistory(bars, "SPY");
			BarHistory dia = GetHistory(bars, "DIA");
			BarHistory gld = GetHistory(bars, "GLD");

			//create 4 bitmaps
			var _qqq = getBitmap(qqq);
			var _spy = getBitmap(spy);
			var _dia = getBitmap(dia);
			var _gld = getBitmap(gld);

			//draw a panel of the 4 stacked charts
			DrawImageAt(_qqq, 10, 10);
			DrawImageAt(_dia, 10, 210);
			DrawImageAt(_spy, 310, 10);
			DrawImageAt(_gld, 310, 210);
		}

		public override void Execute(BarHistory bars, int idx)
		{
		}
	}
}
Draws a line on the chart using the specified parameters, line width, color, and style. The behindBars parameter controls whether the drawing is made behind the rendered chart bars, or above them.
using WealthLab.Backtest;
using System;
using WealthLab.Core;
using WealthLab.Indicators;
using WealthLab.ChartWPF;
using System.Drawing;
using System.Collections.Generic;

namespace WealthLab
{
    public class MyStrategy : UserStrategyBase
    {
        //draw extended trendlines between two most recent peaks/troughs
        public override void Initialize(BarHistory bars)
        {
			PeakTroughCalculator pt = new PeakTroughCalculator(bars, 5.0);
			if (pt.PeakTroughs.Count > 4)
			{
				int ptc = pt.PeakTroughs.Count - 1;

				//render peak trendline
				PeakTrough peak1 = pt.PeakTroughs[ptc].Type == PeakTroughType.Peak ? pt.PeakTroughs[ptc] : pt.PeakTroughs[ptc - 1];
				PeakTrough peak2 = pt.GetPeak(peak1.DetectedAtIndex - 1);
				if (peak1 != null && peak2 != null)
				{
					DrawLine(peak2.PeakTroughIndex, peak2.Value, peak1.PeakTroughIndex, peak1.Value, WLColor.Red, 2, LineStyle.Dotted, "Price", false, true);
				}

				//render trough trendline
				PeakTrough trough1 = pt.PeakTroughs[ptc].Type == PeakTroughType.Peak ? pt.PeakTroughs[ptc - 1] : pt.PeakTroughs[ptc];
				PeakTrough trough2 = pt.GetTrough(trough1.DetectedAtIndex - 1);
				if (trough1 != null && trough2 != null)
				{
					DrawLine(trough2.PeakTroughIndex, trough2.Value, trough1.PeakTroughIndex, trough1.Value, WLColor.Green, 2, LineStyle.Dotted, "Price", false, true);
				}
			}
        }

        public override void Execute(BarHistory bars, int idx)
        {
        }

		//declare private variables below
    }
}
Draws a polygon based on the list of points in the pts parameter, using the specific color, line width, and style. The ChartPoint class represents a point on the chart. It contains 2 properties; an int Index and a double Value. The behindBars parameter controls whether the drawing is made behind the rendered chart bars, or above them.
using WealthLab.Backtest;
using System;
using WealthLab.Core;
using WealthLab.Indicators;
using WealthLab.ChartWPF;
using System.Drawing;
using System.Collections.Generic;

namespace WealthLab
{
    public class MyStrategy : UserStrategyBase
    {
		//draw a triangle around most recent 3 peak/troughs
		public override void Initialize(BarHistory bars)
		{
			PeakTroughCalculator pt = new PeakTroughCalculator(bars, 7.0);
			if (pt.PeakTroughs.Count < 3)
				return;
			PeakTrough pt1 = pt.PeakTroughs[pt.PeakTroughs.Count - 1];
			PeakTrough pt2 = pt.PeakTroughs[pt.PeakTroughs.Count - 2];
			PeakTrough pt3 = pt.PeakTroughs[pt.PeakTroughs.Count - 3];
			List<IChartPoint> points = new List<IChartPoint>();
			points.Add(pt1);
			points.Add(pt2);
			points.Add(pt3);
			DrawPolygon(points, WLColor.DarkCyan, 3);
		}

        public override void Execute(BarHistory bars, int idx)
        {
        }

    }
}
Draws a rectangle on the chart using the specified parameters, color, line width, and style. The behindBars parameter controls whether the drawing is made behind the rendered chart bars, or above them.
using WealthLab.Backtest;
using System;
using WealthLab.Core;
using WealthLab.Indicators;
using WealthLab.ChartWPF;
using System.Drawing;
using System.Collections.Generic;

namespace WealthLab
{
	public class MyStrategy : UserStrategyBase
	{
		//draw rectangle around recent peak/troughs
		public override void Initialize(BarHistory bars)
		{
			PeakTroughCalculator pt = new PeakTroughCalculator(bars, 10.0);
			if (pt.PeakTroughs.Count == 0)
				return;
			PeakTrough pt1 = pt.PeakTroughs[pt.PeakTroughs.Count - 1];
			if (pt1 != null)
			{
				PeakTrough pt2 = pt.GetPeakTrough(pt1.DetectedAtIndex - 1);
				if (pt2 != null)
				{
					DrawRectangle(pt2.PeakTroughIndex, pt2.Value, pt1.PeakTroughIndex, pt1.Value, WLColor.Blue, 3);
				}
			}
		}

		public override void Execute(BarHistory bars, int idx)
		{
		}
	}
}
Draws the specified text on the chart, at the location specified by the idx (x-axis) and value (y-axis) parameters. The idx parameter corresponds to an index in the BarHistory being charted. The value parameter corresponds to a numeric value along the y-axis.
The color parameter determines the text's color, and the fontSize parameter determines its size. A size of 12 is standard for chart text rendering.
The behindBars parameter controls whether the drawing is made behind the rendered chart bars, or above them.
DrawText has several optional parameters that let you further customize the text:
- paneTag - lets you control which pane the text is rendered to. Possible values are "Price", "Volume", or an indicator pane tag such as "RSI" or "CMO".
- centerText - if true, specified that the text should be centered along the idx parameter. If false (the default value) it renders with the left edge beginning at that point.
- font - specifies the Font to use to render the text, as an instance of the WealthLab.Core.Font class.
using WealthLab.Backtest;
using System;
using WealthLab.Core;
using WealthLab.Indicators;
using WealthLab.ChartWPF;
using System.Drawing;
using System.Collections.Generic;

namespace WealthScript1
{
	public class MyStrategy : UserStrategyBase
	{
		//create moving averages
		public override void Initialize(BarHistory bars)
		{
			sma50 = new SMA(bars.Close, 50);
			sma200 = new SMA(bars.Close, 200);
			PlotIndicatorLine(sma50);
			PlotIndicatorLine(sma200, WLColor.Red);
		}

		//label where moving average crossover occur
		public override void Execute(BarHistory bars, int idx)
		{
			if (sma50.CrossesOver(sma200, idx))
				DrawText("Cross Over", idx, sma200[idx], WLColor.Black, 8);
			if (sma50.CrossesUnder(sma200, idx))
				DrawText("Cross Under", idx, sma200[idx], WLColor.Black, 8);
		}

		//declare private variables below
		SMA sma50;
		SMA sma200;
	}
}
You can use DrawTextVAlign to vertically align the text to a pane's y-value. Accordingly, the alignment is controlled by the valign VerticalAlignment enum parameter: Top, Bottom, or Center
Like DrawText, DrawTextVAlign draws the specified text in a pane at the location specified by the idx (x-axis) and value (y-axis) parameters. The idx parameter corresponds to an index in the BarHistory being charted. The value parameter corresponds to a numeric value along the y-axis.
The color parameter determines the text's color, and the fontSize parameter determines its size. A size of 12 is standard for chart text rendering.
The behindBars parameter controls whether the drawing is made behind the rendered chart bars, or above them.
The optional parameters that let you further customize the text:
- marginVert - the vertical margin property lets you add an offset in pixels to create "margin" from the plot value.
- marginHorz - since all text may not align perfectly when drawn centered, the horizontal margin property lets you add or subtract an offset in pixels.
- paneTag - lets you control which pane the text is rendered to. Possible values are "Price", "Volume", or an indicator pane tag such as "RSI" or "CMO".
- centerText - if true, specified that the text should be centered along the idx parameter. If false (the default value) it renders with the left edge beginning at that point.
- font - specifies the Font to use to render the text, as an instance of the WealthLab.Core.Font class.
using WealthLab.Backtest;
using System;
using WealthLab.Core;
using WealthLab.Indicators;
using System.Collections.Generic;

namespace WealthScript123
{
	public class MyStrategy : UserStrategyBase
	{
		public override void Initialize(BarHistory bars)
		{
			r = ROC.Series(bars.Close, 50);
			PlotIndicator(r);
			DrawHorzLine(0, WLColor.Gray, 1, default, r.PaneTag);
		}

		//when ROC crosses through 0 draw arrows aligned at 0 but with 8 pixels of vertical margin
		public override void Execute(BarHistory bars, int idx)
		{
			double vmargin = 8;
			double hmargin = -5;
			if (r.CrossesOver(0, idx))
			{
				DrawTextVAlign("↑", idx, 0, VerticalAlignment.Top, WLColor.Aqua, 20, vmargin, hmargin, "ROC");
			}
			else if (r.CrossesUnder(0, idx))
			{
				DrawTextVAlign("↓", idx, 0, VerticalAlignment.Bottom, WLColor.Aqua, 20, vmargin, hmargin, "ROC");
			}
		}

		//declare private variables below
		private ROC r;
	}
}
Does not actually plot, but rather calculates the extension of a line specified by two points (x1,x2 and y1,y2), and returns the value of y extended to the point along the line where the x parameter occurs. Pass true for isLog for a straight line on a semi-log chart.
using WealthLab.Backtest;
using System;
using WealthLab.Core;
using WealthLab.Indicators;
using WealthLab.ChartWPF;
using System.Drawing;
using System.Collections.Generic;

namespace WealthLab
{
	public class MyStrategy : UserStrategyBase
	{
		//create an indicator that projects price 5 bars into the future based on the line
		//that connects the close 5 bars ago with the current close
		public override void Initialize(BarHistory bars)
		{
			TimeSeries projected = new TimeSeries(bars.DateTimes);
			for (int n = 5; n < bars.Count; n++)
			{
				double projectedValue = ExtendLine(n - 5, bars.Close[n - 5], n, bars.Close[n], n + 5);
				projected[n] = projectedValue;
			}
			PlotTimeSeries(projected, "Projected Price", "Price");
		}

		public override void Execute(BarHistory bars, int idx)
		{
		}
	}
}
Fills an ellipse on the chart using the specified parameters, color, and style. The behindBars parameter controls whether the drawing is made behind the rendered chart bars, or above them.
using WealthLab.Backtest;
using System;
using WealthLab.Core;
using WealthLab.Indicators;
using WealthLab.ChartWPF;
using System.Drawing;
using System.Collections.Generic;

namespace WealthLab
{
    public class MyStrategy : UserStrategyBase
    {
        //fill 3 ellipses around descending high/low ranges
        public override void Initialize(BarHistory bars)
        {
	        if (bars.Count < 100)
				return;
			DrawMyEllipse(bars, 100);
	        DrawMyEllipse(bars, 70);
	        DrawMyEllipse(bars, 40);
        }
		private void DrawMyEllipse(BarHistory bars, int barRange)
		{
			WLColor c = WLColor.FromArgb(32, 0, 0, 128);
			double highest = bars.High.GetHighest(bars.Count - 1, barRange);
			double lowest = bars.Low.GetLowest(bars.Count - 1, barRange);
			FillEllipse(bars.Count - barRange + 1, highest, bars.Count - 1, lowest, c);
		}

        //execute the strategy rules here, this is executed once for each bar in the backtest history
        public override void Execute(BarHistory bars, int idx)
        {
        }

        //declare private variables below

    }
}
Fills a polygon based on the list of points in the pts parameter, using the specific color. The ChartPoint class represents a point on the chart. It contains 2 properties; an int Index and a double Value. The behindBars parameter controls whether the drawing is made behind the rendered chart bars, or above them.
using WealthLab.Backtest;
using System;
using WealthLab.Core;
using WealthLab.Indicators;
using WealthLab.ChartWPF;
using System.Drawing;
using System.Collections.Generic;

namespace WealthLab
{
	public class MyStrategy : UserStrategyBase
	{
		//draw a triangle around most recent 3 peak/troughs
		public override void Initialize(BarHistory bars)
		{
			PeakTroughCalculator pt = new PeakTroughCalculator(bars, 7.0);
			if (pt.PeakTroughs.Count < 3)
				return;
			PeakTrough pt1 = pt.PeakTroughs[pt.PeakTroughs.Count - 1];
			PeakTrough pt2 = pt.PeakTroughs[pt.PeakTroughs.Count - 2];
			PeakTrough pt3 = pt.PeakTroughs[pt.PeakTroughs.Count - 3];
			List<IChartPoint> points = new List<IChartPoint>();
			points.Add(pt1);
			points.Add(pt2);
			points.Add(pt3);
			FillPolygon(points, WLColor.DarkCyan);
		}

		public override void Execute(BarHistory bars, int idx)
		{
		}

	}
}
Fills a rectangle on the chart using the specified parameters, color, and style. The behindBars parameter controls whether the drawing is made behind the rendered chart bars, or above them.
using WealthLab.Backtest;
using System;
using WealthLab.Core;
using WealthLab.Indicators;
using WealthLab.ChartWPF;
using System.Drawing;
using System.Collections.Generic;

namespace WealthLab
{
    public class MyStrategy : UserStrategyBase
    {
		//for intraday charts - draw a rectangle around the zone of yesterday's high/low range
		public override void Initialize(BarHistory bars)
		{
			BarHistory daily = BarHistoryCompressor.ToDaily(bars);
			if (daily == null || daily.Count < 2)
				return;
			for (int n = bars.Count - 1; n > 0; n--)
			{
				if (bars.DateTimes[n].Day != bars.DateTimes[n - 1].Day)
				{
					int dailyIdx = daily.Count - 1;
					double dailyLow = daily.Low[dailyIdx];
					double dailyHigh = daily.High[dailyIdx];
					WLColor c = WLColor.FromArgb(32, 0, 255, 255);
					FillRectangle(n, dailyHigh, bars.Count - 1, dailyLow, c);
					return;
				}
			}
		}

        public override void Execute(BarHistory bars, int idx)
        {
        }

    }
}
Returns a System.Drawing.Bitmap instance of the visual depiction of the chart, including any plotted indicators and other cosmetic drawings. You can specify the size of the Bitmap using the width and height parameters. Chart properties such as Bar Width, Show Volume Pane, Show Event icons, etc. come from your settings in Preferences (F12) > Chart.
using WealthLab.Backtest;
using System;
using WealthLab.Core;
using WealthLab.Indicators;
using System.Collections.Generic;
using System.Drawing;

namespace WealthScript2
{
    public class MyStrategy : UserStrategyBase
    {
        //create indicators and other objects here, this is executed prior to the main trading loop
        public override void Initialize(BarHistory bars)
        {
			rsi14 = RSI.Series(bars.Close, 14);
			rsi14.MassageColors = true;
			PlotIndicator(rsi14, WLColor.Aqua);
        }

        //execute the strategy rules here, this is executed once for each bar in the backtest history
        public override void Execute(BarHistory bars, int idx)
        {
			WLColor c = ColorUtils.InterpolateColors(WLColor.Lime, WLColor.Red, 0, 100, rsi14[idx]);
			c = c.SetAlpha((byte)(Math.Abs(rsi14[idx] - 50) * 5));
			SetBackgroundColor(bars, idx, c);
        }


		//get a chart image after execution, and render a smaller copy of it onto the primary chart
		public override void BacktestComplete()
		{
			Bitmap img = GetChartImage() as Bitmap;
			Bitmap smaller = new Bitmap(600, 400);
			using (Graphics g = Graphics.FromImage(smaller))
			{
				g.DrawImage(img, 0, 0, 600, 400);
			}
			DrawImageAt(smaller, 10, 10);
		}

		//private members
		private RSI rsi14;
    }
}
Plots a BarHistory instance on the chart. BarHistory instances are typically obtained as a result of the GetHistory method. Provide the BarHistory to be plotted in the bh parameter.
The paneTag parameter should specify what pane to plot the data. You can specify Price for the price pane, Volume for the volume pane, or some other unique string for a custom pane.
The color parameter is optional. If not specified, WealthLab will plot the data in black.
The fitInAxis parameter is also optional, with a default of false. If set to true, it will cause the BarHistory data to fit within the existing scale of the pane, so as not to distort it. If false, the pane's scale will adjust to accommodate the BarHistory data.
using WealthLab.Backtest;
using WealthLab.Core;
using System.Drawing;

namespace WealthLab
{
    public class MyStrategy : UserStrategyBase
    {
        //create indicators and other objects here, this is executed prior to the main trading loop
        public override void Initialize(BarHistory bars)
        {
			//Plot QQQ in its own pane below price
			BarHistory qqq = GetHistory(bars, "QQQ");
			PlotBarHistory(qqq, "QQQ");

			//Plot SPY in the same pane, using the dual scale
			BarHistory spy = GetHistory(bars, "SPY");
			PlotBarHistory(spy, "QQQ", WLColor.Red, true);
        }

        //execute the strategy rules here, this is executed once for each bar in the backtest history
        public override void Execute(BarHistory bars, int idx)
        {
        }
    }
}
Plots the specified BarHistory instance in bh in a chart pane with the specified paneTag, using the specified color. The fitInAxis parameter is optional, with a default of false. If set to true, it will cause the BarHistory data to fit within the existing scale of the pane, so as not to distort it. If false, the pane's scale will adjust to accommodate the BarHistory data.
The styleName parameter must be the exact string of a Chart Style name: "Bar", "Candlestick", or "Line". The method does not support variable-width styles like "Equivolume", and if one is specified it defaults to "Bar".
using WealthLab.Backtest;
using System;
using WealthLab.Core;
using WealthLab.Indicators;
using System.Drawing;
using System.Collections.Generic;

namespace WealthScript1
{
	public class MyStrategy : UserStrategyBase
	{
		//Initialize
		public override void Initialize(BarHistory bars)
		{
			PlotBarHistoryStyle(bars, "HAPane", "Heikin Ashi", WLColor.Navy);
		}

		//Execute
		public override void Execute(BarHistory bars, int idx)
		{
			if (OpenPositions.Count == 0)
			{

			}
			else
			{

			}
		}

		//private members

	}
}
Plots an indicator on the chart. The ib parameter is an indicator is an instance of the IndicatorBase class, the class which all indicators in WealthLab are derived from. Any time you create an indicator in code, you're returned an instance of the indicator's specialized class, which is a descendant of IndicatorBase.
Parameter remarks
- color is optional. If not specified WealthLab will use the indicator's default color.
- plotStyle is optional, and is a member of the PlotStyle enum. If not specified, Wealth-Lab uses the indicator's default plot style.
- suppressLabels lets you disable to indicator pane labels and the value markers along the chart's right margin for this plot.
- paneTag is optional for indicators. Pass your own paneTag to plot multiple indicators of different types in the same pane, for example.
using WealthLab.Backtest;
using WealthLab.Core;
using WealthLab.Indicators;
using System.Drawing;

namespace WealthLab
{
    public class MyStrategy : UserStrategyBase
    {
        //create indicators and other objects here, this is executed prior to the main trading loop
        public override void Initialize(BarHistory bars)
        {
	        //plot a MACD and signal line
			IndicatorBase macd = new MACD(bars.Close);
			PlotIndicator(macd, WLColor.Firebrick, PlotStyle.ThickHistogram);
			IndicatorBase signalLine = new SMA(macd, 9);
			PlotIndicator(signalLine);

			//plot an SMA, semi-transparent
			IndicatorBase sma = new SMA(bars.AveragePriceOHLC, 9);
			PlotIndicator(sma, WLColor.FromArgb(64, WLColor.CadetBlue), PlotStyle.ThickLine);
        }

        //execute the strategy rules here, this is executed once for each bar in the backtest history
        public override void Execute(BarHistory bars, int idx)
        {
        }
    }
}
Plots the two IndicatorBase series ib1 and ib2 as a companion bands with solid lines using the color, if specified, filling the area between the lines with same color with the specified opacity, a number from 0 (transparent) to 100 (opaque).
Remarks
- Except for the IndicatorBase parameters, all others are optional.
- The two indicator need not be typical "companions", but they should be indicators that plot in the same pane by default.
using WealthLab.Backtest;
using System;
using WealthLab.Core;
using WealthLab.Indicators;
using System.Collections.Generic;

namespace WealthScript123
{
    public class PlotIndicatorBandsDemo : UserStrategyBase
    {
        //create indicators and other objects here, this is executed prior to the main trading loop
        public override void Initialize(BarHistory bars)
        {
			StartIndex = 20;
			_h = Highest.Series(bars.High, 20);
			_l = Lowest.Series(bars.Low, 20);
			PlotIndicatorBands(_h, _l, WLColor.Fuchsia, 1, 20);
        }

        //execute the strategy rules here, this is executed once for each bar in the backtest history
        public override void Execute(BarHistory bars, int idx)
        {
        }

		Highest _h;
		Lowest _l;
    }
}
This method is designated to plot the VChart indicator (or any other indicator that returns values for the GetBarChartCompanion method) ib in a custom plot style, with the specified color and width parameters. Pass on a supported ChartStyle name i.e. Bar, Candlestick, Line, Heikin Ashi.
using WealthLab.Backtest;
using System;
using WealthLab.Core;
using WealthLab.Indicators;
using System.Collections.Generic;

namespace WealthScript2
{
    public class MyStrategy : UserStrategyBase
    {
        //create indicators and other objects here, this is executed prior to the main trading loop
        public override void Initialize(BarHistory bars)
        {
			//this example plots the VChart as candlesticks
			VChart vc = VChart.Series(bars, 10,PriceComponent.Close);
			PlotIndicatorChartStyle(vc,WLColor.Red,3,false,"Candlestick");
		}

        //execute the strategy rules here, this is executed once for each bar in the backtest history
        public override void Execute(BarHistory bars, int idx)
        {
        }
    }
}
Plots and fills bands composed of two indicators, ib1 and ib2, that periodically cross over each other on the specified pane. Each indicator is plotted as a line using colorUp for ib1 and colorDown for ib2, style, and width. The band between the indicators is filled with alternating colors. When ib1 is above ib2 colorUp is used and colorDown when ib2 is above ib1.
Note!
SetSeriesBarColor may be used to change the color of the lines on specified bars. To make this work independently for both lines, it's required to plot ib2 using a PlotIndicator/TimeSeries function as shown in the example.
Parameter remarks
- ib1 and ib2 parameters are indicators, instances of the IndicatorBase class. Any time you create an indicator in code, you're returned an instance of the indicator's specialized class, which is a descendant of IndicatorBase. See also: PlotTimeSeriesCloud
- colorUp/Down are optional. If not specified WealthLab will use the indicators' default colors.
- width is the line width (default is 2) for both indicator plots. Pass 0 for no line.
- lineStyle is optional, and is a member of the LineStyle enum. Default is a solid line.
- opacity is a number between 0 and 100, default 25, that determines the transparency of the cloud, where 0 is fully transparent (no fill) and 100 is opaque.
- suppressLabels lets you disable to indicator pane labels and the value markers along the chart's right margin for this plot.
- paneTag is optional for indicators. Pass your own paneTag to plot multiple indicators of different types in the same pane, for example.
using WealthLab.Backtest;
using System;
using WealthLab.Core;
using WealthLab.Indicators;
using System.Collections.Generic;

namespace WealthScript123
{
    public class MyStrategy : UserStrategyBase
    {
		public override void Initialize(BarHistory bars)
		{
			_ema = EMA.Series(bars.Close, 50);
			_sma = SMA.Series(bars.Close, 50);
			PlotIndicatorCloud(_ema, _sma, WLColor.Green, WLColor.Red, 2, LineStyle.Solid, 50);

			// To set bar colors (and line width) of the lines independently, plot _sma again
			PlotIndicatorLine(_sma, WLColor.Red, 3);
			for (int bar = 1; bar < bars.Count; bar++)
			{
				SetSeriesBarColor(_ema, bar, _ema[bar - 1] < _ema[bar] ? WLColor.Blue : WLColor.Gray);
				SetSeriesBarColor(_sma, bar, _sma[bar - 1] < _sma[bar] ? WLColor.Green : WLColor.Fuchsia);
			}
		}
        //execute the strategy rules here, this is executed once for each bar in the backtest history
        public override void Execute(BarHistory bars, int idx)
        {
            if (!HasOpenPosition(bars, PositionType.Long))
            {
                //code your buy conditions here
            }
            else
            {
                //code your sell conditions here
            }
        }

		//declare private variables below
		EMA _ema;
		SMA _sma;
    }
}
Plots the indicator ib using a histogram plot style with two colors. The colorUp is used to plot histogram bars greater than zero, and colorDown bars less than zero. The width of the histogram bars is specified in width.
using WealthLab.Backtest;
using System;
using WealthLab.Core;
using WealthLab.Indicators;
using System.Collections.Generic;

namespace WealthScript1
{
    public class MyStrategy : UserStrategyBase
    {
        //create indicators and other objects here, this is executed prior to the main trading loop
        public override void Initialize(BarHistory bars)
        {
			//Plot a TrendMeter in green and red
			TrendMeter tm1 = TrendMeter.Series(bars.Close, 20);
			PlotIndicatorHistogramTwoColor(tm1, WLColor.Red, WLColor.Green);
        }

        //execute the strategy rules here, this is executed once for each bar in the backtest history
        public override void Execute(BarHistory bars, int idx)
        {
        }

        //declare private variables below

    }
}
Similar to PlotIndicator, but instead of specifying a plot style, this version always plots a line. You can control the thickness and style of the line using the lineThickness and lineStyle parameters.
Parameter remarks
- color is optional. If not specified WealthLab will use the indicator's default color.
- *lineStyle * is optional.
- suppressLabels lets you disable to indicator pane labels and the value markers along the chart's right margin for this plot.
- paneTag is optional for indicators. Pass your own paneTag to plot multiple indicators of different types in the same pane, for example.
Plots the indicator ib in a mountain (shaded area) plot style, with the specified color. The lineWidth parameter controls the width of the mountain plot outline. The filled area will have a gradient controlled by the opacityStart and opacityEnd (0-100).
using WealthLab.Backtest;
using System;
using WealthLab.Core;
using WealthLab.Indicators;
using System.Collections.Generic;

namespace WealthScript2
{
    public class MyStrategy : UserStrategyBase
    {
        //create indicators and other objects here, this is executed prior to the main trading loop
        public override void Initialize(BarHistory bars)
        {
			r = ROC.Series(bars.Close, 10);
			PlotIndicatorMountain(r, WLColor.Black, 0, 100, 80);
        }

        //execute the strategy rules here, this is executed once for each bar in the backtest history
        public override void Execute(BarHistory bars, int idx)
        {
          	if (idx > 0)
				if (bars.DateTimes[idx].Month != bars.DateTimes[idx - 1].Month)
					c = rc.NextColor;
			SetSeriesBarColor(r, idx, c);
        }

		//declare private variables below
		private WLColor c = WLColor.Blue;
		private ROC r;
		private RandomColorGenerator rc = new RandomColorGenerator();
    }
}
Plots the specified IndicatorBase series ib as a solid line using the color, if specified. When ib moves below its oversold area, this area of the chart is filled using colorOversold. Conversely, when ib moves above the overbought area, that area of the chart is filled with colorOverbought. Overbought/Oversold colors are subject to the opacity percentage setting, a number from 0 (transparent) to 100 (opaque).
Remarks
- Except for the IndicatorBase parameter, all others are optional.
- Standard overbought and and oversold levels are pre-assigned to oscillator-type indicators. To override these levels, use PlotTimeSeriesOscillator() instead.
using WealthLab.Backtest;
using System;
using WealthLab.Core;
using WealthLab.Indicators;
using System.Drawing;
using System.Collections.Generic;

namespace WealthScript1
{
	public class MyStrategy : UserStrategyBase
	{
		RSI _myRSI;
		TimeSeries _ts;

		public override void Initialize(BarHistory bars)
		{
			_myRSI = RSI.Series(bars.Close, 4);
			PlotIndicatorOscillator(_myRSI);

			_ts = SMA.Series(_myRSI, 3);
			PlotTimeSeriesOscillator(_ts, "Smoothed", _myRSI.PaneTag, 40, 60, WLColor.Black, WLColor.Navy, WLColor.Maroon, 10);
		}

		public override void Execute(BarHistory bars, int idx)
		{
			if (!HasOpenPosition(bars, PositionType.Long))
			{
				//code your buy conditions here
			}
			else
			{
				//code your sell conditions here
			}
		}

	}
}
Call PlotStopsAndLimits once in Initialize() to cause stop and/or limit orders to be plotted on the chart. Stop and limit orders are drawn as colored dots on the chart at the bar and price levels at which they are active. All parameters are optional but can be specified for customization.
Remarks
Default color codes by order type as follows:
- %Buy = blue%
- %Sell = red%
- %Short = fuchsia%
- %Cover = green%
using WealthLab.Backtest;
using System;
using WealthLab.Core;
using WealthLab.Indicators;
using System.Drawing;
using System.Collections.Generic;

namespace WealthScript1
{
	public class PlotStopsAndLimitsSampler : UserStrategyBase
	{
		IndicatorBase _bbU;
		IndicatorBase _bbL;
		IndicatorBase _sma;

		public override void Initialize(BarHistory bars)
		{
			PlotStopsAndLimits();

			_bbU = BBUpper.Series(bars.Close, 10, 2.5);
			_bbL = BBLower.Series(bars.Close, 10, 2.0);
			_sma = SMA.Series(bars.Close, 10);

			//advance the series plot 1 bar to coincide with where the stop/limits are active
			PlotTimeSeriesLine(_bbU >> 1, "bbu", "Price", WLColor.Blue, 1);
			PlotTimeSeriesLine(_bbL >> 1, "bbu", "Price", WLColor.Blue, 1);
			PlotTimeSeriesLine(_sma >> 1, "sma", "Price", WLColor.Black, 1);
		}

		public override void Execute(BarHistory bars, int idx)
		{

			if (HasOpenPosition(bars, PositionType.Long))
			{
				PlaceTrade(bars, TransactionType.Sell, OrderType.Limit, _bbU[idx]);
				PlaceTrade(bars, TransactionType.Sell, OrderType.Stop, _bbL[idx]);
			}
			else
			{
				if (bars.Close.CrossesOver(_sma, idx))
					PlaceTrade(bars, TransactionType.Buy, OrderType.Market);
			}
		}
	}
}
Plots a TimeSeries on the chart. The ts parameter is a TimeSeries instance. PlotTimeSeries is useful when plotting the results of mathematical operations on indicators and other TimeSeries. These operations always return instances of the TimeSeries class.
The name parameter should be a descriptive name of the data being plotted. This appears in the pane label.
The paneTag specifies which chart pane to plot the data in. You can specify Price for the price pane, Volume for the volume pane, or some other string value for a custom pane.
The color parameter is optional. If not provided, WealthLab will use a default color.
The plotStyle parameter is also optional, and is a member of the PlotStyle enum. If not specified, WealthLab will use PlotStyle.Line.
The suppressLabels parameter lets you disable to indicator pane labels and the value markers along the chart's right margin for this plot.
using WealthLab.Backtest;
using WealthLab.Core;
using WealthLab.Indicators;
using System.Drawing;
using System;

namespace WealthLab
{
	public class MyStrategy218 : UserStrategyBase
	{
		TimeSeries _ratio;

		//create indicators and other objects here, this is executed prior to the main trading loop
		public override void Initialize(BarHistory bars)
		{
			//plot a ratio of QLD and QID momentum
			BarHistory qld = GetHistory(bars, "QLD");
			BarHistory qid = GetHistory(bars, "QID");
			_ratio = Momentum.Series(qld.Close, 20) / Momentum.Series(qid.Close, 20);

			for (int bar = 20; bar < bars.Count; bar++)
			{
				if (Math.Abs(_ratio[bar]) > 20)
					_ratio[bar] = _ratio[bar - 1];
			}

			PlotTimeSeries(_ratio, "QLD/QID Momentum Ratio", "Ratio", WLColor.Maroon, PlotStyle.ThickHistogram);
		}

		//execute the strategy rules here, this is executed once for each bar in the backtest history
		public override void Execute(BarHistory bars, int idx)
		{
			//use _ratio here in the trading rules
		}
	}
}
Plots the two TimeSeries instances specified in ts1 and ts2 as a filled band. The opacity parameter can range from 0 (transparent) to 100 (fully opaque).
Remarks
- Color, line width, and opacity parameters are optional.
- The specified name label is displayed in the pane specified by paneTag. Pass true to suppressLabels to hide the label.
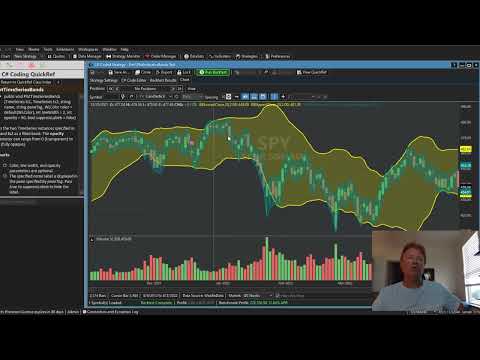
For a demonstration, see this Youtube video:
Plots and fills bands composed of two TimeSeries, ts1 and ts2, that periodically cross over each other on the specified pane. Each TimeSeries is plotted as a line using colorUp for ts1 and colorDown for ts2, style, and width. The band between series is filled with alternating colors. When ts1 is above ts2 colorUp is used and colorDown when ts2 is above ts1.
Note!
SetSeriesBarColor may be used to change the color of the lines on specified bars. To make this work independently for both lines, it's required to plot ts2 again using a PlotTimeSeries function.
Parameter remarks
- ts1 and ts2 parameters are TimeSeries instances. TimeSeries are the result of mathematical operations on indicators and other TimeSeries always return instances of the TimeSeries class.
- name is a description of the plotted series/clouds
- paneTag specifies which chart pane to plot the data in. You can specify Price for the price pane, Volume for the volume pane, or some other string value for a custom pane.
- colorUp and colorDown are specified for the ts1 and ts2 line plots, respectively, as well as for the clouds as described above.
- width is the line width (default is 2) for both indicator plots. Pass 0 for no line.
- lineStyle is optional, and is a member of the LineStyle enum. Default is a solid line.
- opacity is a number between 0 and 100, default 25, that determines the transparency of the cloud, where 0 is fully transparent (no fill) and 100 is opaque.
- suppressLabels lets you disable to indicator pane labels and the value markers along the chart's right margin for this plot.
using WealthLab.Backtest;
using System;
using WealthLab.Core;
using WealthLab.Indicators;
using System.Collections.Generic;

namespace WealthScript123
{
    public class MyStrategy : UserStrategyBase
    {
        //create indicators and other objects here, this is executed prior to the main trading loop
        public override void Initialize(BarHistory bars)
        {
			TimeSeries ts1 = ATRP.Series(bars, 5) * 2;
			TimeSeries ts2 = SMA.Series(ts1, 9);
			PlotTimeSeriesCloud(ts1, ts2, "ATRPx2", "ATRP", WLColor.Green, WLColor.Red, 2, LineStyle.Solid, 25);
        }

        //execute the strategy rules here, this is executed once for each bar in the backtest history
        public override void Execute(BarHistory bars, int idx)
        {
            if (!HasOpenPosition(bars, PositionType.Long))
            {
                //code your buy conditions here
            }
            else
            {
                //code your sell conditions here
            }
        }
    }
}
Plots the TimeSeries ts using a histogram plot style with two colors. The colorUp is used to plot histogram bars greater than zero, and colorDown bars less than zero. The width of the histogram bars is specified in width.
using WealthLab.Backtest;
using System;
using WealthLab.Core;
using WealthLab.Indicators;
using System.Collections.Generic;

namespace WealthScript1
{
    public class MyStrategy : UserStrategyBase
    {
        //create indicators and other objects here, this is executed prior to the main trading loop
        public override void Initialize(BarHistory bars)
        {
			//Plot a TimeSeries in green and red
			CMF cmf = CMF.Series(bars, 14);
			PlotTimeSeriesHistogramTwoColor(cmf, "cmf", "cmfPane", WLColor.Red, WLColor.Green);
        }

        //execute the strategy rules here, this is executed once for each bar in the backtest history
        public override void Execute(BarHistory bars, int idx)
        {
        }

        //declare private variables below

    }
}
Similar to PlotTimeSeries, but instead of specifying a plot style, this version always plots a line. You can control the thickness and style of the line using the lineThickness and lineStyle parameters.
using WealthLab.Backtest;
using WealthLab.Core;
using WealthLab.Indicators;
using System.Drawing;
using System;

namespace WealthLab
{
	public class MyStrategy218 : UserStrategyBase
	{
		TimeSeries _ratio;

		//create indicators and other objects here, this is executed prior to the main trading loop
		public override void Initialize(BarHistory bars)
		{
			//plot a ratio of QLD and QID momentum
			BarHistory qld = GetHistory(bars, "QLD");
			BarHistory qid = GetHistory(bars, "QID");
			_ratio = Momentum.Series(qld.Close, 20) / Momentum.Series(qid.Close, 20);

			for (int bar = 20; bar < bars.Count; bar++)
			{
				if (Math.Abs(_ratio[bar]) > 20)
					_ratio[bar] = _ratio[bar - 1];
			}

			PlotTimeSeriesLine(_ratio, "QLD/QID Momentum Ratio", "Ratio", WLColor.Blue, 3, LineStyle.Dotted);
		}

		//execute the strategy rules here, this is executed once for each bar in the backtest history
		public override void Execute(BarHistory bars, int idx)
		{
			//use _ratio here in the trading rules
		}
	}
}
Plots the specified TimeSeries ts as a solid line in the specified paneTag using the color, if specified. When ts moves below the oversold value, this area of the chart is filled using colorOversold. Conversely, when ts moves above the overbought value, that area of the chart is filled with colorOverbought. Overbought/Oversold colors are subject to the opacity percentage setting, a number from 0 (transparent) to 100 (opaque).
Remarks
- Colors and opacity parameters are optional.
- The specified name label is displayed in the pane specified by paneTag. Pass true to suppressLabels to hide the label.
- Also see PlotIndicatorOscillator()
using WealthLab.Backtest;
using System;
using WealthLab.Core;
using WealthLab.Indicators;
using System.Drawing;
using System.Collections.Generic;

namespace WealthScript1
{
	public class MyStrategy : UserStrategyBase
	{
		RSI _myRSI;
		TimeSeries _ts;

		public override void Initialize(BarHistory bars)
		{
			_myRSI = RSI.Series(bars.Close, 4);
			PlotIndicatorOscillator(_myRSI);

			_ts = SMA.Series(_myRSI, 3);
			PlotTimeSeriesOscillator(_ts, "Smoothed", _myRSI.PaneTag, 40, 60, WLColor.Black, WLColor.Navy, WLColor.Maroon, 10);
		}

		public override void Execute(BarHistory bars, int idx)
		{
			if (!HasOpenPosition(bars, PositionType.Long))
			{
				//code your buy conditions here
			}
			else
			{
				//code your sell conditions here
			}
		}

	}
}
Sets the background of the specified chart pane, at the specified bar index, to the color you specify.
using WealthLab.Backtest;
using System;
using WealthLab.Core;
using WealthLab.Indicators;
using WealthLab.ChartWPF;
using System.Drawing;
using System.Collections.Generic;

namespace WealthLab
{
	public class MyStrategy : UserStrategyBase
	{
		//create indicators
		public override void Initialize(BarHistory bars)
		{
			roc = new ROC(bars.Close, 10);
			PlotIndicator(roc, WLColor.Black, PlotStyle.ThickHistogram);
		}

		//set color of ROC indicator based on its value
		public override void Execute(BarHistory bars, int idx)
		{
			//transform RSI value into 0-100 range after correcting tails
			double value = roc[idx];
			if (value < -20)
				value = -20;
			if (value > 20)
				value = 20;
			value += 20;
			value *= 2.5;
			WLColor c = ColorUtils.InterpolateColors(WLColor.Red, WLColor.LimeGreen, (int)value);
			SetBackgroundColor(bars, idx, c, "ROC");
		}

		//declare private variables below
		ROC roc;
	}
}
Sets the background to the color specified from the top to bottom of the chart at the specified bar index.
using WealthLab.Backtest;
using System;
using WealthLab.Core;
using WealthLab.Indicators;
using System.Drawing;
using System.Collections.Generic;

namespace WealthScript2
{
	public class MyStrategy : UserStrategyBase
	{
		//create indicators and other objects here, this is executed prior to the main trading loop
		public override void Initialize(BarHistory bars)
		{
			_ma1 = SMA.Series(bars.Close, 20);
			_ma2 = SMA.Series(bars.Close, 50);
			StartIndex = 50;
		}

		//execute the strategy rules here, this is executed once for each bar in the backtest history
		public override void Execute(BarHistory bars, int idx)
		{
			if (!HasOpenPosition(bars, PositionType.Long))
			{
				//code your buy conditions here
				if (_ma1.CrossesOver(_ma2, idx))
				{
					PlaceTrade(bars, TransactionType.Buy, OrderType.Market);

					//paint a light blue background on the signal bar
					SetBackgroundColorAllPanes(bars, idx, WLColor.FromArgb(40, WLColor.Blue));
				}
			}
			else
			{
				//code your sell conditions here
				Position p = LastPosition;
				if (idx + 1 - p.EntryBar == 2)
					ClosePosition(p, OrderType.Market);
			}
		}

		//declare private variables below
		SMA _ma1;
		SMA _ma2;

	}
}
Sets the chart bar color at the specified index to the color you specify.
using WealthLab.Backtest;
using System;
using WealthLab.Core;
using WealthLab.Indicators;
using WealthLab.ChartWPF;
using System.Drawing;
using System.Collections.Generic;

namespace WealthLab
{
	public class MyStrategy : UserStrategyBase
	{
		//create indicators
		public override void Initialize(BarHistory bars)
		{
			rsi = new RSI(bars.Close, 20);
			PlotIndicator(rsi);
		}

		//set bar color depending on position of RSI
		public override void Execute(BarHistory bars, int idx)
		{
			//transform RSI value into 0-100 range after correcting tails
			double value = (int)rsi[idx];
			if (value < 30)
				value = 30;
			if (value > 70)
				value = 70;
			value -= 30;
			value *= 2.5;
			WLColor c = ColorUtils.InterpolateColors(WLColor.Red, WLColor.LimeGreen, (int)value);
			SetBarColor(bars, idx, c);
		}

		//declare private variables below
		RSI rsi;
	}
}
Lets you control various chart rendering settings via code. The cds parameter should be an instance of the ChartDisplaySettings class, with properties assigned for the various chart settings you want to change. Properties that you do not assign a value to will default to the current chart preferences.
The ChartDisplaySettings class has the following properties:
- public Color? ColorBackground - the chart background color
- public Color? ColorAxisBackground - the chart axis background color
- public Color? ColorUpBar - the color of the chart's "up" bars
- public Color? ColorDownBar - the color of the chart's "down" bars
- public Color? ColorPaneSeparator - the color of the chart's pane separator lines
- public Color? ColorGridLines - the color of the chart's grid lines
- public Color? ColorAxisLabels - the color of the chart's axis labels
- public Color? ColorCursors - the color of the vertical and crosshair cursors
- public Color? ColorWatermark - the color of the chart watermark that displays the symbol and security name
- public bool? ShowVolumePane - whether or not the volume pane should be displayed
- public bool? ShowEventIcons - whether or not icons for Events (fundamental, etc.) should be displayed
- public bool? DrawTradeArrows - controls whether the entry/exit arrows are displayed for trades
- public bool? LogScale - whether or not the chart price pane should be log scale
- public bool? ShowStatusBar - whether or not the chart status bar should appear
- public bool? AlwaysShowToolbar - whether the chart toolbar should always appear, or appear only when the mouse is near the top area of the chart
- public double? BarSpacing - the number of pixels between chart bars
- public int? Margin - how much space should appear above and below chartable data
- public int? PaneSeparatorWidth - the size of the pane separator lines, setting this to zero hides the separator lines
- public int? CursorThickness - how thick the vertical and crosshair cursor lines should be
using WealthLab.Backtest;
using WealthLab.Core;
using WealthLab.Indicators;
using System.Drawing;

namespace WealthScript1
{
	public class MyStrategy : UserStrategyBase
	{
		//Initialize
		public override void Initialize(BarHistory bars)
		{
			//plot an RSI and a CMO
			RSI rsi = RSI.Series(bars.Close, 20);
			PlotIndicator(rsi);
			CMO cmo = CMO.Series(bars.Close, 20);
			PlotIndicator(cmo);

			//Create a ChartDisplaySettings for customized chart display
			ChartDisplaySettings cds = new ChartDisplaySettings();

			//hide the volume pane and separator lines
			cds.ShowVolumePane = false;
			cds.PaneSeparatorWidth = 0;

			//set the default bar colors
			cds.ColorUpBar = WLColor.Gray;
			cds.ColorDownBar = WLColor.Silver;

			//put these settings into effect
			SetChartDrawingOptions(cds);
		}

		//Execute
		public override void Execute(BarHistory bars, int idx)
		{
		}
	}
}
Controls the height and sort order of the chart pane with the specified paneTag (case sensitive). The price pane has a paneTag of "Price", and the volume pane "Volume". Indicator panes typically have a paneTag equal to the plotted indicator's abbreviation. But, to be sure, you can access the PaneTag property of a plotted indicator to obtain its paneTag.
The height parameter determines the relative vertical size of the chart pane. For example, given two panes, one with a height of 100 and one with a height of 50, the first pane will take up twice as much vertical space on the chart. By default, the price pane has a height of 100 and volume and indicator panes 33.
The optional sortValue parameter controls the order that the panes appear in the chart. The price pane has a default sortValue of 0, the volume pane 100, and indicator panes 50. This causes the price pane to sort to the top, the volume pane to the bottom, and indicator panes in between.
using WealthLab.Backtest;
using WealthLab.Core;
using WealthLab.Indicators;

namespace WealthScript1
{
	public class MyStrategy : UserStrategyBase
	{
		//Initialize - plot an RSI above the price pane, and make it an equal height
		public override void Initialize(BarHistory bars)
		{
			RSI rsi = RSI.Series(bars.Close, 20);
			PlotIndicator(rsi);
			SetPaneDrawingOptions("Price", 100, 2);
			string rsiPaneTag = rsi.PaneTag;
			SetPaneDrawingOptions(rsiPaneTag, 100, 1);
			SetPaneDrawingOptions("Volume", 30, 3);
		}

		//Execute
		public override void Execute(BarHistory bars, int idx)
		{
		}
	}
}
Allows you to manually set the scale of the pane identified by paneTag. The min and max values will be used to define the visible range of the pane. When required to keep price and indicators visible, the actual visible scale of the pane will still be dynamically extended beyond the range that you specify.
using WealthLab.Backtest;
using System;
using WealthLab.Core;
using WealthLab.Data;
using WealthLab.Indicators;
using System.Collections.Generic;

namespace WealthScript3
{
    public class MyStrategy : UserStrategyBase
    {
        public override void Initialize(BarHistory bars)
        {
			_rsi = RSI.Series(bars.Close, 5);
			PlotIndicatorOscillator(_rsi);
			SetPaneDrawingOptions(_rsi.PaneTag, 50);

			// maintain constant range for the RSI pane
			SetPaneMinMax(_rsi.PaneTag, 0, 100);

			StartIndex = 10;
        }

        public override void Execute(BarHistory bars, int idx)
        {
        }

		//declare private variables below
		RSI _rsi;
    }
}
Sets the series bar color at the specified index to the color you specify.
using WealthLab.Backtest;
using System;
using WealthLab.Core;
using WealthLab.Indicators;
using WealthLab.ChartWPF;
using System.Drawing;
using System.Collections.Generic;

namespace WealthLab
{
	public class MyStrategy : UserStrategyBase
	{
		//create indicators and other objects here, this is executed prior to the main trading loop
		public override void Initialize(BarHistory bars)
		{
			rsi = RSI.Series(bars.Close, 14);
			PlotIndicator(rsi);
			for (int i = 0; i < bars.Count; i++)
			{
				SetSeriesBarColor(rsi, i, rsi[i] > 70 ? WLColor.Green : rsi[i] < 30 ? WLColor.Red : WLColor.Black);
			}
		}

		//annotate bars when prices cross lower bollinger band
		public override void Execute(BarHistory bars, int idx)
		{
		}

		//declare private variables below
		RSI rsi;
	}
}
Changes the font that will be used in subsequent text rendering calls in your Strategy code.
using WealthLab.Backtest;
using WealthLab.Core;
using WealthLab.Indicators;
using System.Drawing;

namespace WealthScript1
{
	public class MyStrategy : UserStrategyBase
	{
		//create indicators and other objects here, this is executed prior to the main trading loop
		public override void Initialize(BarHistory bars)
		{
			bbLower = new BBLower(bars.Close, 20, 2.00);
			bbUpper = new BBUpper(bars.Close, 20, 2.00);
			PlotIndicator(bbLower);
			PlotIndicator(bbUpper);
			SetTextDrawingOptions(WLColor.FromArgb(255, 255, 220, 220), WLColor.DarkRed, 2);
			WLFont f = new WLFont("Impact", 12);
			SetTextDrawingFont(f);
		}

		//annotate bars when prices cross lower bollinger band
		public override void Execute(BarHistory bars, int idx)
		{
			if (bars.Close.CrossesUnder(bbLower, idx))
				DrawBarAnnotation("Look out!", idx, false, WLColor.Red, 12, true);
		}

		//declare private variables below
		BBLower bbLower;
		BBUpper bbUpper;
	}
}
Lets you control how text is rendered to the chart by any of the text drawing methods. You can specify a background color (backgroundColor parameter), and/or a border color (borderColor parameter) and width (borderWidth parameter) to use when text is rendered. If you don't want a background color and/or border, specify Color.Transparent in these parameters. The settings affect all subsequent calls to text drawing methods.
using WealthLab.Backtest;
using System;
using WealthLab.Core;
using WealthLab.Indicators;
using WealthLab.ChartWPF;
using System.Drawing;
using System.Collections.Generic;

namespace WealthLab
{
	public class MyStrategy : UserStrategyBase
	{
		//create indicators and other objects here, this is executed prior to the main trading loop
		public override void Initialize(BarHistory bars)
		{
			bbLower = new BBLower(bars.Close, 20, 2.00);
			bbUpper = new BBUpper(bars.Close, 20, 2.00);
			PlotIndicator(bbLower);
			PlotIndicator(bbUpper);
			SetTextDrawingOptions(WLColor.FromArgb(32, 255, 0, 0), WLColor.DarkRed, 2);
		}

		//annotate bars when prices cross lower bollinger band
		public override void Execute(BarHistory bars, int idx)
		{
			if (bars.Close.CrossesUnder(bbLower, idx))
				DrawBarAnnotation("Look out!", idx, false, WLColor.Red, 8, true);
		}

		//declare private variables below
		BBLower bbLower;
		BBUpper bbUpper;
	}
}
Returns a List of BarHistory objects that contain the historical data being backtested.
using WealthLab.Backtest;
using System;
using WealthLab.Core;
using WealthLab.Indicators;
using System.Drawing;
using System.Collections.Generic;

namespace WealthLab
{
	public class ExampleModel11 : UserStrategyBase
	{
		//create indicators and other objects here, this is executed prior to the main trading loop
		public override void Initialize(BarHistory bars)
		{
			//how correlated is this symbol to all of the symbols in the universe?
			TimeSeries tsSumCorr = new TimeSeries(bars.DateTimes, 0.0);
			int n = 0;
			foreach (BarHistory bh in BacktestData)
			{
				Corr c = new Corr(bars, bh, PriceComponent.Close, 20);
				if (c != null && c.Count > 0)
				{
					tsSumCorr += c;
					n++;
				}
			}
			if (n > 0)
				tsSumCorr /= n;
			PlotTimeSeries(tsSumCorr, "Avg Corr", "Corr", WLColor.DarkOrange);
		}

		//execute the strategy rules here, this is executed once for each bar in the backtest history
		public override void Execute(BarHistory bars, int idx)
		{
			if (!HasOpenPosition(bars, PositionType.Long))
			{
				//code your buy conditions here
			}
			else
			{
				//code your sell conditions here
			}
		}

		//declare private variables below

	}
}
Exposes the instance of the BacktestSettings class that contains the backtest settings used by the Backtester. You can override one or more of the backtest settings by changing the properties of the BacktestSettings instance. These changes affect your Strategy run only, and not the overall backtest settings established in Preferences.
Remarks
- You should make assignments to BacktestSettings properties in the Initialize() method.
Returns the current cash level available in the simulation. The cash level decreases as your Strategy opens new positions, and increases as it exits positions.
using WealthLab.Backtest;
using System;
using WealthLab.Core;
using WealthLab.Indicators;
using WealthLab.ChartWPF;
using System.Drawing;
using System.Collections.Generic;

namespace WealthLab
{
	public class MyStrategy : UserStrategyBase
	{
		//create indicators and other objects here, this is executed prior to the main trading loop
		public override void Initialize(BarHistory bars)
		{
			SetTextDrawingOptions(WLColor.Wheat, WLColor.Black, 2);
			sma200 = new SMA(bars.Close, 200);
			PlotIndicator(sma200);
		}

		//execute the strategy rules here, this is executed once for each bar in the backtest history
		public override void Execute(BarHistory bars, int idx)
		{
			if (!HasOpenPosition(bars, PositionType.Long))
			{
				if (bars.Close.CrossesOver(sma200, idx))
				{
					PlaceTrade(bars, TransactionType.Buy, OrderType.Market);
					string s = "Portfolio cash at entry bar = $" + CurrentCash.ToString("N2");
					DrawText(s, idx, bars.Low[idx], WLColor.Navy, 8, "Price", true);
				}
			}
			else
			{
				if (bars.Close.CrossesUnder(sma200, idx))
					PlaceTrade(bars, TransactionType.Sell, OrderType.Market);
			}
		}

		//declare private variables below
		SMA sma200;
	}
}
Returns the current equity level in the simulation. This is initially determined by the Starting Equity that you established in Strategy Settings. As your Strategy executes bar by bar, and enters and exits positions, the equity level will rise and fall.
using WealthLab.Backtest;
using System;
using WealthLab.Core;
using WealthLab.Indicators;
using WealthLab.ChartWPF;
using System.Drawing;
using System.Collections.Generic;

namespace WealthLab
{
	public class MyStrategy : UserStrategyBase
	{
		//create indicators and other objects here, this is executed prior to the main trading loop
		public override void Initialize(BarHistory bars)
		{
			sma200 = new SMA(bars.Close, 200);
			equity = new TimeSeries(bars.DateTimes);
			PlotIndicator(sma200);
			PlotTimeSeries(equity, "Equity", "Equity", WLColor.DarkGreen, PlotStyle.ThickHistogram);
		}

		//populate equity as Strategy executes bar by bar
		public override void Execute(BarHistory bars, int idx)
		{
			equity[idx] = CurrentEquity;
			if (HasOpenPosition(bars, PositionType.Long) && bars.Close.CrossesUnder(sma200, idx))
				PlaceTrade(bars, TransactionType.Sell, OrderType.Market);
			else if (bars.Close.CrossesOver(sma200, idx))
				PlaceTrade(bars, TransactionType.Buy, OrderType.Market);
		}

		//declare private variables below
		SMA sma200;
		TimeSeries equity;
	}
}
Returns a List of ManuallyDrawnObject instances that represent the chart drawing objects that exist for the specified BarHistory (bars parameter.) Drawing objects are segregated by symbol and HistoryScale (Daily, Weekly, etc.) The objectType and name parameters allow you to optionally filter the results by the type of object ("Line", "Horizontal Line", etc.) and/or the name you provided for the drawing object when you created or edited it. Pass null to either of these parameters to ignore it.
using WealthLab.Backtest;
using System;
using WealthLab.Core;
using WealthLab.Data;
using WealthLab.Indicators;
using System.Collections.Generic;

namespace WealthScript1
{
    public class MyStrategy : UserStrategyBase
    {
        //write out chart drawing objectw to debug log
        public override void Initialize(BarHistory bars)
        {
			List<ManuallyDrawnObject> mdos = GetChartDrawings(bars, null, null);
			WriteToDebugLog("Number of Drawing Objects found: " + mdos.Count);
			foreach (ManuallyDrawnObject mdo in mdos)
			{
				WriteToDebugLog("---------");
				WriteToDebugLog("Type=" + mdo.DrawingObjectType);
				WriteToDebugLog("Name=" + mdo.NameFromUser);
				for (int p = 0; p < mdo.Points.Count; p++)
					WriteToDebugLog("Point" + p + ": Index=" + mdo.Points[p].Index + ",Value=" + mdo.Points[p].Value);

				//it it's a line, write its end point to the debug log
				if (mdo.DrawingObjectType == "Line")
				{
					double lastVal = mdo.ExtendLine(0, 1, bars.Count - 1);
					WriteToDebugLog("Line ends at: " + lastVal);
				}
			}
        }

        //execute the strategy rules here, this is executed once for each bar in the backtest history
        public override void Execute(BarHistory bars, int idx)
        {
        }
    }
}
This method is intended to be called in either the PreExecute or PostExecute methods. These two methods provide you a list of BarHistory objects that are being processed during the current Execute cycle. GetCurrentIndex takes a BarHistory parameter, which should be one of the instances in the list mentioned above. It returns the int index into that BarHistory that represents the bar currently being processed by Execute.
Gets a value out of the global Dictionary that is available throughout the current WL8 session. Specify a key and a value. If the keyed item is not present, returns null.
using WealthLab.Backtest;
using WealthLab.Core;

namespace WealthScript1
{
	public class MyStrategy : UserStrategyBase
	{
		//create indicators and other objects here, this is executed prior to the main trading loop
		public override void Initialize(BarHistory bars)
		{
			int runs = HasGlobal("runs") ? (int)GetGlobal("runs") : 0;
			runs++;
			SetGlobal("runs", runs);
			DrawHeaderText(runs + " Runs so far!");
		}

		//execute the strategy rules here, this is executed once for each bar in the backtest history
		public override void Execute(BarHistory bars, int idx)
		{
		}

		//declare private variables below

	}
}
Lets you access data for another symbol from within your Strategy. Returns a BarHistory object for the specified symbol. The synchWith parameter specifies a BarHistory object to synch the historical data with. Generally, this will be the bars parameter from the Initialize or Execute method. You can optionally pass a DataSet name in the dataSetName parameter to retrieve the data from that DataSet, if it's found there.
Remarks
- GetHistory does not use statically cached data collected by the Data Manager. It's primary intent is to allow a Strategy to make decisions using data that does not reside in the DataSet being tested. For example, buy a stock if the corresponding index is oversold.
- For statically cached data, use the BacktestData property, which returns a List containing the BarHistory instances being backtested.
using WealthLab.Backtest;
using System;
using WealthLab.Core;
using WealthLab.Indicators;
using WealthLab.ChartWPF;
using System.Drawing;
using System.Collections.Generic;

namespace WealthScript123
{
	public class MyStrategy : UserStrategyBase
	{
		//plot a market benchmark in its own pane and don't trade unless the benchmark is above its 50-day SMA
		public override void Initialize(BarHistory bars)
		{
			_spy = GetHistory(bars, "SPY");
			PlotBarHistory(_spy, "SPYPane", WLColor.Silver);
			_smaSpy = SMA.Series(_spy.Close, 50);
			PlotIndicator(_smaSpy, default, default, default, "SPYPane");

		}

		public override void Execute(BarHistory bars, int idx)
		{
			if (!HasOpenPosition(bars, PositionType.Long))
			{
				if (_spy.Close[idx] > _smaSpy[idx])
				{
					//code your buy conditions here
				}
			}
			else
			{
				//code your sell conditions here
			}
		}

		BarHistory _spy;
		SMA _smaSpy;
	}
}
Returns an instance of the BarHistory class the represents historical data for the symbol and scale you specify. If WealthLab could not locate historical data for the symbol/scale, the method returns null. You can optionally pass a DataSet name in the dataSetName parameter to retrieve the data from that DataSet, if it's found there. The resulting data is not synched to the BarHistory currently being processed on the chart. Therefore, you should not plot indicators or TimeSeries derived from this data, unless you first synchronize these series using the TimeSeriesSynchronizer helper class.
Remarks
- GetHistoryUnsynched does not use statically cached data collected by the Data Manager. It's primary intent is to allow a Strategy to make decisions using data that does not reside in the DataSet being tested. For example, buy a stock if the corresponding index is oversold.
- For statically cached data, use the BacktestData property, which returns a List containing the BarHistory instances being backtested.
using WealthLab.Backtest;
using WealthLab.Core;
using WealthLab.Indicators;
using System.Drawing;

namespace WealthLab
{
	public class MyStrategy : UserStrategyBase
	{
		//create indictors based on an external data series
		//synchronize them AFTER they are created to preserve consistency despite possible irregularities
		//between the primary and external symbol histories
		public override void Initialize(BarHistory bars)
		{
			//create the unsynchronized indicator (RSI of SPY)
			BarHistory spy = GetHistoryUnsynched("SPY", HistoryScale.Daily);
			TimeSeries spyRSI = new RSI(spy.Close, 14);

			//sychrnize it with the data being processed
			spyRSI = TimeSeriesSynchronizer.Synchronize(spyRSI, bars);

			//Plot it
			PlotTimeSeries(spyRSI, "RSI(SPY,14)", "RSI", WLColor.Red);

			//Plot RSI of symbol being processed
			RSI rsi = new RSI(bars.Close, 14);
			PlotIndicator(rsi);
		}

		public override void Execute(BarHistory bars, int idx)
		{
		}
	}
}
Returns a synchronized BarHistory for a paired symbol.
Especially during intraday operation, GetHistory can often return a BarHistory for a secondary symbol without the latest up-to-date bar if the request occurs before the Historical Provider has built the bar on its server.
Instead, GetPairHistory will wait and try to acquire an updated BarHistory for a specified number of seconds. The call returns immediately when the result is up-to-date with the syncWith BarHistory or after the timeout period.
Remarks
- GetPairHistory will make a new request every 1 second until the data is up-to-date. Extra requests can impact providers that throttle or otherwise limit the number of request allowed.
using WealthLab.Backtest;
using System;
using WealthLab.Core;
using WealthLab.Indicators;
using WealthLab.ChartWPF;
using System.Collections.Generic;

namespace WealthScript123
{
    public class BuyAMarketETFWhenSymbolIsBelowItsSMA : UserStrategyBase
    {
		private string _stock2 = "QQQ";
		private BarHistory _bars2;
		private SMA _sma;

		public override void Initialize(BarHistory bars)
        {
			_sma = SMA.Series(bars.Close, 20);
			PlotIndicator(_sma);

			// obtain the sync'd bar history
			_bars2 = GetPairHistory(bars, _stock2);
			PlotBarHistory(_bars2, "QQQ");

			StartIndex = 20;
		}

		public override void Execute(BarHistory bars, int idx)
		{
			Position pos = FindOpenPosition(0);				// PositionTag 0 for the bars symbol
			Position pos2 = FindOpenPositionAllSymbols(1);  // PositionTag 1 for _stock2

			if (pos == null && pos2 == null)
			{
				if (bars.Close.CrossesOver(_sma, idx))
					PlaceTrade(bars, TransactionType.Buy, OrderType.Market, 0, 0, "Start");
			}
			else if (pos != null)
			{
				if (bars.Close.CrossesUnder(_sma, idx))
				{
					ClosePosition(pos, OrderType.Market);
					PlaceTrade(_bars2, TransactionType.Buy, OrderType.Market, 0, 1, "Buy QQQ");
				}
			}
	        else if (pos2 != null)
			{
				if (bars.Close.CrossesOver(_sma, idx))
				{
					ClosePosition(pos2, OrderType.Market);
					PlaceTrade(bars, TransactionType.Buy, OrderType.Market, 0, 0, "");
				}
			}
        }
    }
}
Returns true if the specified key item is in the global Dictionary.
using WealthLab.Backtest;
using WealthLab.Core;

namespace WealthScript1
{
	public class MyStrategy : UserStrategyBase
	{
		//create indicators and other objects here, this is executed prior to the main trading loop
		public override void Initialize(BarHistory bars)
		{
			int runs = HasGlobal("runs") ? (int)GetGlobal("runs") : 0;
			runs++;
			SetGlobal("runs", runs);
			DrawHeaderText(runs + " Runs so far!");
		}

		//execute the strategy rules here, this is executed once for each bar in the backtest history
		public override void Execute(BarHistory bars, int idx)
		{
		}

		//declare private variables below

	}
}
Call this method to send e-mail from your Strategy code. If messageText contains HTML tags, SendEmail will set the email format to HTML, allowing rich formatting (bold, links, tables, etc.) to be rendered in the recipient's email client.
Email providers like Gmail and Hotmail have restrictions for sending email from less secure apps. However, you Use this method with Gmail (and other email clients) by creating an App Password: a 16-digit passcode that gives a less secure app permission to access your Google Account. App passwords can only be used with gmail accounts that have 2-Step Verification turned on.
Here's how to set it up:
- Go to your Google Account - myaccount.google.com
- Navigate to Security > 2-Step Verification and enable it.
- In the same Security section, use Search Google Account at the top to find "App passwords" and click on it in the results.
- Type a name, e.g., WealthLabStrategy, and click Create.
- Copy the 16-digit App Password and remove spaces (e.g., abcdefghijklmnop) to use for the password in
SendEmail().
The example has a reusable routine that emails all signals from a Strategy. Simply copy the BacktestComplete() method and modify the email variables where indicated.
using System;
using WealthLab.Backtest;
using WealthLab.Core;
using WealthLab.Data;
using WealthLab.Indicators;

namespace WealthScript123
{
    public class MyStrategy : UserStrategyBase
    {
        public override void Initialize(BarHistory bars)
        { }

        public override void Execute(BarHistory bars, int idx)
        {
			// signal limit buy only
			if (idx < bars.Count - 1)
				return;

			PlaceTrade(bars, TransactionType.Buy, OrderType.Limit, bars.Close[idx] * 0.98);
        }

		public override void BacktestComplete()
		{
			string body = $"{DateTime.Now:yyyy-MM-dd HH:mm:ss}\n";
			foreach (var t in Backtester.Orders)
			{
				string orderPrice = "-";
				if (!t.OrderType.ToString().Contains("Market"))
					orderPrice = $"{t.OrderPrice:N2}";

				string signal = $"{t.TransactionType,-5}{t.Quantity,5}{t.Symbol,8}{t.OrderType,10}{orderPrice,8}\n";
				body += signal;
			}

			// modify these variables
			string fromEmail = "from@domain.com";    // your Gmail address
			string appPassword = "abcdefghijklmnop"; // your 16-digit App Password (no spaces)
			string toEmail = "send-to@domain.com";   // destination email
			int port = 587;	// for Gmail, port can be 587 (TLS) or 465 (SSL)
			string subject = $"{Backtester.Strategy.Name} Signals";

			WriteToDebugLog(body);
			SendEmail(fromEmail, "smtp.gmail.com", fromEmail, appPassword, port, toEmail, subject, body);
		}
	}
}
Sets a value in the global Dictionary that is available throughout the current WL8 session. Specify a key and a value.
Tip: To make a variable available for all symbols during script execution, declare a static class variable instead of using global variables.
using WealthLab.Backtest;
using WealthLab.Core;

namespace WealthScript1
{
	public class MyStrategy : UserStrategyBase
	{
		//create indicators and other objects here, this is executed prior to the main trading loop
		public override void Initialize(BarHistory bars)
		{
			int runs = HasGlobal("runs") ? (int)GetGlobal("runs") : 0;
			runs++;
			SetGlobal("runs", runs);
			DrawHeaderText(runs + " Runs so far!");
		}

		//execute the strategy rules here, this is executed once for each bar in the backtest history
		public override void Execute(BarHistory bars, int idx)
		{
		}

		//declare private variables below

	}
}
Returns the class name of the executing strategy that derives from UserStrategyBase.
Writes a line of output to the Debug Log tab.
Remarks
- The Debug Log is refreshed for each Backtest run unless you uncheck Automatically Clear Before Each Run in the Debug Log toolbar.
- The Log is explicitly segregrated by writes for the symbol under test. You don't need to add bars.Symbol to know for which symbol the write occurred. You can override this behavior to create a sequential output by passing false as the groupBySymbol parameter.
- If you WriteToDebugLog in BacktestBegin, BacktestComplete, PreExecute, or PreExecute virtual methods, Wealth-Lab will generally write to the same random symbol, but you can't count on it especially when using Wealth-Data dynamic DataSets. In this case, the order of writes may not appear intuitive. One way around this is to save writes to a private static List
and WriteToDebugLog while iterating through the list in BacktestComplete() as shown in the example. Another way is to simply pass false as the groupBySymbol parameter.
using WealthLab.Backtest;
using System;
using WealthLab.Core;
using WealthLab.Indicators;
using System.Drawing;
using System.Collections.Generic;

namespace WealthScript123
{
	public class MyStrategy : UserStrategyBase
	{
		//private variables
		IndicatorBase _sma1;
		IndicatorBase _sma2;
		static List<string> _output = new List<string>();

		public override void Initialize(BarHistory bars)
		{
			//begin the backtest at bar 13
			StartIndex = 13;

			_sma1 = SMA.Series(bars.Close, 8);
			_sma2 = SMA.Series(bars.Close, 13);

			PlotIndicatorLine(_sma1, WLColor.Blue);
			PlotIndicatorLine(_sma2, WLColor.Red);
		}

		//execute the strategy rules here, this is executed once for each bar in the backtest history
		public override void Execute(BarHistory bars, int idx)
		{
			//write the last date for exach symbol
			if (idx == bars.Count - 1)
				WriteToDebugLog(bars.DateTimes[idx].ToShortDateString());


			if (!HasOpenPosition(bars, PositionType.Long))
			{
				if (_sma1.CrossesOver(_sma2, idx))
				{
					PlaceTrade(bars, TransactionType.Buy, OrderType.Market);

					//save the date of the Alert
					_output.Add(bars.Symbol + "\t" + bars.DateTimes[idx].ToString("yyyyMMdd"));
				}
			}
			else
			{
				if (_sma1.CrossesUnder(_sma2, idx))
					PlaceTrade(bars, TransactionType.Sell, OrderType.Market);
			}
		}

		public override void BacktestBegin()
		{
			base.BacktestBegin();
			WriteToDebugLog("BEGIN");
		}

		public override void BacktestComplete()
		{
			base.BacktestComplete();
			WriteToDebugLog("COMPLETE");

			foreach (string str in _output)
			{
				WriteToDebugLog(str);
			}
		}
	}
}
Writes the specified text (txt) to the Strategy Window status bar, using the provided color if specified. If color is not specified, the theme appropriate foreground color is used.
using WealthLab.Backtest;
using System;
using WealthLab.Core;
using WealthLab.Data;
using WealthLab.Indicators;
using System.Collections.Generic;
using System.Threading;

namespace WealthScript1
{
    public class MyStrategy : UserStrategyBase
    {
        //create indicators and other objects here, this is executed prior to the main trading loop
        public override void Initialize(BarHistory bars)
        {
        }

        //execute the strategy rules here, this is executed once for each bar in the backtest history
        public override void Execute(BarHistory bars, int idx)
        {
			WriteToStatusBar("Bar " + idx.ToString());
			Thread.Sleep(2);
        }
    }
}
Call this from within the Strategy's constructor to add a parameter to the Strategy. The method returns an instance of the Parameter class that represents the parameter you added.
Remarks
- Do not use commas in the parameter's label.
using WealthLab.Backtest;
using System;
using WealthLab.Core;
using WealthLab.Indicators;
using WealthLab.ChartWPF;
using System.Drawing;
using System.Collections.Generic;

namespace WealthLab
{
	public class MyStrategy : UserStrategyBase
	{
		//constructor
		public MyStrategy() : base()
		{
			AddParameter("Short Period", ParameterType.Int32, 50, 30, 70, 10);
			AddParameter("Long Period", ParameterType.Int32, 200, 150, 300, 50);
		}

		//create indicators, note obtaining period from parameters
		public override void Initialize(BarHistory bars)
		{
			smaShort = new SMA(bars.Close, Parameters[0].AsInt);
			smaLong = new SMA(bars.Close, Parameters[1].AsInt);
			PlotIndicator(smaShort);
			PlotIndicator(smaLong, WLColor.Red);
		}

		//a parameter-driven SMA crossover Strategy
		public override void Execute(BarHistory bars, int idx)
		{
			if (!HasOpenPosition(bars, PositionType.Long))
			{
				if (smaShort.CrossesOver(smaLong, idx))
					PlaceTrade(bars, TransactionType.Buy, OrderType.Market);
			}
			else
			{
				if (smaShort.CrossesUnder(smaLong, idx))
					PlaceTrade(bars, TransactionType.Sell, OrderType.Market);
			}
		}

		//declare private variables below
		SMA smaShort;
		SMA smaLong;
	}
}
Returns a List<Parameter> containing the Strategy's parameters, all instances of the Parameter class. Strategy parameters should be added in the constructor, by calling the AddParameter method.
using WealthLab.Backtest;
using System;
using WealthLab.Core;
using WealthLab.Indicators;
using WealthLab.ChartWPF;
using System.Drawing;
using System.Collections.Generic;

namespace WealthLab
{
	public class MyStrategy : UserStrategyBase
	{
		//constructor
		public MyStrategy() : base()
		{
			AddParameter("Short Period", ParameterType.Int32, 50, 30, 70, 10);
			AddParameter("Long Period", ParameterType.Int32, 200, 150, 300, 50);
		}

		//create indicators, note obtaining period from parameters
		public override void Initialize(BarHistory bars)
		{
			smaShort = new SMA(bars.Close, Parameters[0].AsInt);
			smaLong = new SMA(bars.Close, Parameters[1].AsInt);
			PlotIndicator(smaShort);
			PlotIndicator(smaLong, WLColor.Red);
		}

		//a parameter-driven SMA crossover Strategy
		public override void Execute(BarHistory bars, int idx)
		{
			if (!HasOpenPosition(bars, PositionType.Long))
			{
				if (smaShort.CrossesOver(smaLong, idx))
					PlaceTrade(bars, TransactionType.Buy, OrderType.Market);
			}
			else
			{
				if (smaShort.CrossesUnder(smaLong, idx))
					PlaceTrade(bars, TransactionType.Sell, OrderType.Market);
			}
		}

		//declare private variables below
		SMA smaShort;
		SMA smaLong;
	}
}
Returns the average entry price of open positions at the moment.
using WealthLab.Backtest;
using System;
using WealthLab.Core;
using WealthLab.Indicators;
using System.Drawing;
using System.Collections.Generic;

namespace WealthScript1
{
	public class MyStrategy : UserStrategyBase
	{
		public override void Initialize(BarHistory bars)
		{
			rsi = new RSI(bars.Close, 14);
			PlotIndicator(rsi);
		}

		public override void Execute(BarHistory bars, int idx)
		{
			if(OpenPositions.Count < 6)
			{
				if (rsi[idx] < 30)
					PlaceTrade(bars, TransactionType.Buy, OrderType.Market);
			}
			else
			{
				//Exit all positions if the Close price is below the average entry price for all open positions in the symbol minus X points...
				double stopValue = AverageEntryPrice() - pointStopLoss;
				bool stopped = bars.Close[idx] < stopValue;

				//...or if RSI is overbought
				bool rsiHigh = rsi[idx] > 70;

				if (stopped || rsiHigh)
				{
					for (int i = 0; i < OpenPositions.Count; i++)
						ClosePosition(OpenPositions[i], OrderType.Market, 0, stopped ? "AvgPrice Stop" : "RSI > 70");
				}
			}
		}

		RSI rsi;
		double pointStopLoss = 5.0;
	}
}
Returns the number of bars ago of the most recent exit for all symbols in the Backtest by finding the most recent exit bar from all exited positions that have the exitSignal, if specified. To speed up large simulations, the limitSearch parameter limits the number of position exits to search starting from the most recent Position. Pass 0 for no limit.
Remarks
- NSF Positions are not included.
The sample code show how to trigger on the last exit for the current symbol, and also how to filter trades based on the last exit of all symbols in the backtest using BarsSinceLastExit(). Run it with one symbol and then a Portfolio backtest on the Dow 30, for example.
using WealthLab.Backtest;
using System;
using WealthLab.Core;
using WealthLab.Indicators;
using System.Drawing;

namespace WealthScript124
{
	public class BarsSinceExitDemo : UserStrategyBase
	{
		public override void Initialize(BarHistory bars)
		{
			_rsi = RSI.Series(bars.Close, 2);
			PlotIndicator(_rsi);
		}

		public override void Execute(BarHistory bars, int idx)
		{
			if (!HasOpenPosition(bars, PositionType.Long))
			{
				//wait at least 3 bars since the last exit of if any position (all symbols)
				if (BarsSinceLastExit(idx, 0) > 15)
					if (_rsi[idx] < 15)
						PlaceTrade(bars, TransactionType.Buy, OrderType.Market, 0, "Waited 15");

				//but enter again if we've waited at least 100 bars since the last exit for this symbol
				if (LastPosition != null && idx - LastPosition.ExitBar >= 100)
					if (_rsi[idx] < 15)
						PlaceTrade(bars, TransactionType.Buy, OrderType.Market, 0, "Waited long enough");
			}
			else
			{
				//sell when rsi crosses 80
				if (_rsi.CrossesOver(80, idx))
					PlaceTrade(bars, TransactionType.Sell, OrderType.Market);
			}
		}

		RSI _rsi;
	}
}
Looks for an open Position that has specified numeric positionTag for the BarHistory being processed. Positions that were created as a result of passing a value in the PlaceTrade method's positionTag parameter can be found in this way.
The second version of FindOpenPosition allows you to look for primary symbol positions by type, where the pt parameter can contain PositionType.Long or PositionType.Short.
Remarks
- To find open Positions for other symbols/BarHistories use FindOpenPositionAllSymbols.
using WealthLab.Backtest;
using System;
using WealthLab.Core;
using WealthLab.Indicators;
using WealthLab.ChartWPF;
using System.Drawing;
using System.Collections.Generic;

namespace WealthLab
{
    public class MyStrategy : UserStrategyBase
    {
        //create indicators
        public override void Initialize(BarHistory bars)
        {
			rsi = new RSI(bars.Close, 20);
        }

        //example of seasonal entries/exits
        public override void Execute(BarHistory bars, int idx)
        {
			//open positions in February and March
			Position febPosition = FindOpenPosition(2);
			Position marchPosition = FindOpenPosition(3);
			if (rsi[idx] < 30)
			{
				if (bars.DateTimes[idx].Month == 2)
				{
					if (febPosition == null)
						PlaceTrade(bars, TransactionType.Buy, OrderType.Market, 0, 2);
				}
				else if (bars.DateTimes[idx].Month == 3)
				{
					if (marchPosition == null)
						PlaceTrade(bars, TransactionType.Buy, OrderType.Market, 0, 3);
				}
			}

			//sell February position in December, sell March position in November
			if (febPosition != null)
				if (bars.DateTimes[idx].Month == 12)
					ClosePosition(febPosition, OrderType.Market);
			if (marchPosition != null)
				if (bars.DateTimes[idx].Month == 11)
					ClosePosition(marchPosition, OrderType.Market);
        }

		//declare private variables below
		RSI rsi;
    }
}
Returns the open position with the specified positionTag among the entire set of currently open postions, regardless of symbol. This method was created to support a Strategy that stops normal trading during a specific technical event, and instead swaps the entire portfolio into a bond ETF. When the technical condition is over, and normal trading can begin again, the Strategy calls FindOpenPositionAllSymbols to locate the position in this bond ETF that it had opened previously, and closes it.
Remarks
- If the strategy trades multiple secondary symbols, the positionTag must be unique for each one.
Returns the total number of shares/contracts in all open Positions of the type specified in pt (Long or Short), for the specified symbol.
Returns the list of positions (instances of the Position class) for the current symbol being processed. Use the includeNSF parameter to determine if NSF Positions should be included.
using WealthLab.Backtest;
using System;
using WealthLab.Core;
using WealthLab.Indicators;
using WealthLab.ChartWPF;
using System.Drawing;
using System.Collections.Generic;

namespace WealthLab
{
    public class MyStrategy : UserStrategyBase
    {
		//create indicators
		public override void Initialize(BarHistory bars)
        {
			downDays = new ConsecDown(bars.Close, 4);
			upDays = new ConsecUp(bars.Close, 4);
        }

        //buy when 9 consecutive days where close is < close of 4 days ago, sell reverse
        public override void Execute(BarHistory bars, int idx)
        {
            if (!HasOpenPosition(bars, PositionType.Long))
            {
                if (downDays[idx] == 9)
					PlaceTrade(bars, TransactionType.Buy, OrderType.Market);
            }
            else
            {
                if (upDays[idx] == 9)
					PlaceTrade(bars, TransactionType.Sell, OrderType.Market);
            }
        }

		//report how many trades were filled and not filled
		public override void Cleanup(BarHistory bars)
		{
			int filled = GetPositions().Count;
			int all = GetPositions(true).Count;
			int notFilled = all - filled;
			DrawHeaderText("Filled Positions in " + bars.Symbol + " = " + filled);
			DrawHeaderText("Unfilled Positions in " + bars.Symbol + "= " + notFilled);
		}

		//declare private variables below
		private ConsecDown downDays;
		private ConsecUp upDays;
    }
}
Returns the list of positions (instances of the Position class) for all symbols in the backtest. Use the includeNSF parameter to determine if NSF Positions should be included.
using WealthLab.Backtest;
using System;
using WealthLab.Core;
using WealthLab.Indicators;
using WealthLab.ChartWPF;
using System.Drawing;
using System.Collections.Generic;

namespace WealthLab
{
    public class MyStrategy : UserStrategyBase
    {
		//create indicators
		public override void Initialize(BarHistory bars)
        {
			downDays = new ConsecDown(bars.Close, 4);
			upDays = new ConsecUp(bars.Close, 4);
        }

        //buy when 9 consecutive days where close is < close of 4 days ago, sell reverse
        public override void Execute(BarHistory bars, int idx)
        {
            if (!HasOpenPosition(bars, PositionType.Long))
            {
                if (downDays[idx] == 9)
					PlaceTrade(bars, TransactionType.Buy, OrderType.Market);
            }
            else
            {
                if (upDays[idx] == 9)
					PlaceTrade(bars, TransactionType.Sell, OrderType.Market);
            }
        }

		//report how many trades were filled and not filled
		public override void Cleanup(BarHistory bars)
		{
			int filled = GetPositionsAllSymbols().Count;
			int all = GetPositionsAllSymbols(true).Count;
			int notFilled = all - filled;
			DrawHeaderText("Filled Positions = " + filled);
			DrawHeaderText("Unfilled Positions in = " + notFilled);
		}

		//declare private variables below
		private ConsecDown downDays;
		private ConsecUp upDays;
    }
}
Lets you determine if there is currently an open Position of the current type (PositionType.Long or PositionType.Short). For the bars parameter, pass the value of the bars parameter that you received in the Execute method.
Only for the BarHistory being processed, LastOpenPosition returns the most-recently created open Position object. Returns null if there are no open Positions currently.
using WealthLab.Backtest;
using System;
using WealthLab.Core;
using WealthLab.Indicators;
using WealthLab.ChartWPF;
using System.Drawing;
using System.Collections.Generic;

namespace WealthLab
{
	public class MyStrategy : UserStrategyBase
	{
		//create indicators and other objects here, this is executed prior to the main trading loop
		public override void Initialize(BarHistory bars)
		{
			cmo = new CMO(bars.Close, 14);
			PlotIndicator(cmo);
		}

		//execute the strategy rules here, this is executed once for each bar in the backtest history
		public override void Execute(BarHistory bars, int idx)
		{
			if (LastOpenPosition == null)
			{
				if (cmo.CrossesOver(cmo.OversoldLevel, idx))
					PlaceTrade(bars, TransactionType.Buy, OrderType.Market);
			}
			else
			{
				if (cmo.CrossesUnder(cmo.OverboughtLevel, idx))
					ClosePosition(LastOpenPosition, OrderType.Market);
			}
		}

		//declare private variables below
		private CMO cmo;
	}
}
Only for the BarHistory being processed, LastPosition returns the most-recently created Position object or null if no Positions have been created.
Remarks
- If the Strategy creates trades for secondary symbols see GetPositionAllSymbols().
using WealthLab.Backtest;
using System;
using WealthLab.Core;
using WealthLab.Indicators;
using WealthLab.ChartWPF;
using System.Drawing;
using System.Collections.Generic;

namespace WealthLab
{
	public class MyStrategy : UserStrategyBase
	{
		//create indicators and other objects here, this is executed prior to the main trading loop
		public override void Initialize(BarHistory bars)
		{
			cmo = new CMO(bars.Close, 14);
			PlotIndicator(cmo);
		}

		//execute the strategy rules here, this is executed once for each bar in the backtest history
		public override void Execute(BarHistory bars, int idx)
		{
			if (LastPosition == null)
			{
				if (cmo.CrossesOver(cmo.OversoldLevel, idx))
					PlaceTrade(bars, TransactionType.Buy, OrderType.Market);
			}
			else
			{
				Position p = LastPosition;

				//exit after 3 days
				if (idx + 1 - p.EntryBar >= 3)
					ClosePosition(p, OrderType.Market);
			}
		}

		//declare private variables below
		private CMO cmo;
	}
}
Returns a list of the open positions (instances of the Position class) for the BarHistory currently being processed. This includes positions that are marked NSF.
using WealthLab.Backtest;
using System;
using WealthLab.Core;
using WealthLab.Indicators;
using WealthLab.ChartWPF;
using System.Drawing;
using System.Collections.Generic;

namespace WealthLab
{
    public class MyStrategy : UserStrategyBase
    {
		//create indicators
		public override void Initialize(BarHistory bars)
        {
			rsi = new RSI(bars.Close, 20);
			PlotIndicator(rsi);
        }

        //keep buying positions when the RSI is oversold
        public override void Execute(BarHistory bars, int idx)
        {
			//see if we need to sell positions
			if (rsi.CrossesOver(50.0, idx))
			{
				foreach(Position pos in OpenPositions)
					ClosePosition(pos, OrderType.Market);
			}

	        //time to buy?
	        if (rsi[idx] < 30)
				PlaceTrade(bars, TransactionType.Buy, OrderType.Market);
        }

		//declare private variables below
		private RSI rsi;
    }
}
Returns a list of open positions (instances of the Position class) for all symbols being backtested. You generally won't need to access other symbol positions during normal Strategy processing, but this can be handy for certain summary processing you might perform during the BacktestComplete method.
using WealthLab.Backtest;
using System;
using WealthLab.Core;
using WealthLab.Indicators;
using WealthLab.ChartWPF;
using System.Drawing;
using System.Collections.Generic;

namespace WealthLab
{
    public class MyStrategy : UserStrategyBase
    {
        //create indicators
        public override void Initialize(BarHistory bars)
        {
			roc = new ROC(bars.Close, 20);
        }

        //fade the momentum
        public override void Execute(BarHistory bars, int idx)
        {
	        //close all positions when momentum reaches zero
			if (roc[idx] >= 2)
	        	foreach(Position pos in OpenPositions)
					ClosePosition(pos, OrderType.Market);

			//scale in when momentum descreases
			if (roc[idx] < -2)
			{
				//no more than 20 total open positions in portfolio
				if (OpenPositionsAllSymbols.Count < 20)
					PlaceTrade(bars, TransactionType.Buy, OrderType.Market);
			}
        }

		//declare private variables below
		ROC roc;
    }
}
Returns the net total number of shares/contracts held by open positions for the current symbols being processed. Long positions return positive quantities and short positions negative.
Returns the net total number of shares/contracts held by open positions for all symbols in a portfolio backtest. Long positions return positive quantities and short positions negative.
Contains the current value of the trailing stop for the position. Trailing stops are managed by the UserStrategyBase CloseAtTrailingStop method.
using WealthLab.Backtest;
using System;
using WealthLab.Core;
using WealthLab.Indicators;
using WealthLab.ChartWPF;
using System.Drawing;
using System.Collections.Generic;

namespace WealthLab
{
	public class MyStrategy : UserStrategyBase
	{
		//create indicators and other objects here, this is executed prior to the main trading loop
		public override void Initialize(BarHistory bars)
		{
			//create a TimeSeries to plot trailing stop
			stops = new TimeSeries(bars.DateTimes);
			PlotTimeSeries(stops, "Trailing Stop", "Price", WLColor.Navy, PlotStyle.Dots);
		}

		//execute the strategy rules here, this is executed once for each bar in the backtest history
		public override void Execute(BarHistory bars, int idx)
		{
			if (HasOpenPosition(bars, PositionType.Long))
			{
				CloseAtTrailingStop(LastPosition, TrailingStopType.PercentHL, 10);
				stops[idx] = LastPosition.TrailingStopPrice;
			}
			else if (idx == bars.Count - 50)
			{
				PlaceTrade(bars, TransactionType.Buy, OrderType.Market);
			}
		}

		//declare private variables below
		private TimeSeries stops;
	}
}
You can override this method to assign values to the AutoProfitTargetPrice and AutoStopLossPrice properties of the Transaction instance passed in the t parameter. See the corresponding entries for these properties in the Transaction class for more details on same-bar exits. The advantage of assigning these properties within this method is that it provides you the actual executionPrice, upon which you can base the desired profit target and stop loss prices.
using WealthLab.Backtest;
using System;
using WealthLab.Core;
using WealthLab.Indicators;
using System.Drawing;
using System.Collections.Generic;

namespace WealthScript5
{
	public class SameBarAuto : UserStrategyBase
	{
		TimeSeries _band;

		public override void Initialize(BarHistory bars)
		{
			double pct = 0.95;
			_band = SMA.Series(bars.Close, 10) * pct;
			PlotTimeSeriesLine(_band, "band", "Price");
		}

		public override void Execute(BarHistory bars, int idx)
		{
			if (HasOpenPosition(bars, PositionType.Long))
			{
				//sell at open next bar
				PlaceTrade(bars, TransactionType.Sell, OrderType.Market);
			}
			else
			{
				//buy at market if the low goes below the band, but closes above it
				if (bars.Low.CrossesUnder(_band[idx], idx) && bars.Close[idx] > _band[idx])
					PlaceTrade(bars, TransactionType.Buy, OrderType.Market);
			}
		}

		//same bar exits: 3% profit or loss from execution price
		public override void AssignAutoStopTargetPrices(Transaction t, double basisPrice, double executionPrice)
		{
			t.AutoProfitTargetPrice = executionPrice * 1.03;
			t.AutoStopLossPrice = executionPrice * 0.97;
		}
	}
}
The backtester calls this method for the first symbol (sorted alphabetically) in the universe prior to the backtest beginning its processing.
using WealthLab.Backtest;
using WealthLab.Core;

namespace WealthLab
{
    public class MyStrategy : UserStrategyBase
    {
		//intialize the sum variable to zero, this only gets called once per backtest
		public override void BacktestBegin()
		{
			sumClose = 0;
			sumObs = 0;
		}

        //we add the closing price to the sum and increment the number of observations
        public override void Execute(BarHistory bars, int idx)
        {
			sumObs++;
			sumClose += bars.Close[idx];
        }

	    //display average close of entire universe on chart
		public override void Cleanup(BarHistory bars)
		{
			double avg = sumClose / sumObs;
			DrawHeaderText(avg.ToString("N2"));
		}

		//declare private variables below
		private static double sumClose;
		private static int sumObs;
    }
}
The backtester calls this method for the last symbol (sorted alphabetically) in the universe after the backtest processing is completed for all symbols.
using WealthLab.Backtest;
using WealthLab.Core;
using System.IO;

namespace WealthLab
{
    public class MyStrategy : UserStrategyBase
    {
		//intialize the sum variable to zero, this only gets called once per backtest
		public override void BacktestBegin()
		{
			sumClose = 0;
			sumObs = 0;
		}

        //we add the closing price to the sum and increment the number of observations
        public override void Execute(BarHistory bars, int idx)
        {
			sumObs++;
			sumClose += bars.Close[idx];
        }

		//save the information that we gathered to a file
		public override void BacktestComplete()
		{
			double avg = sumClose / sumObs;
			string output = "Average Closing Price of DataSet: " + avg.ToString("N2");
			File.WriteAllText(@"C:\My Folder\My File.txt", output);
		}

		//declare private variables below
		private static double sumClose;
		private static int sumObs;
    }
}
The backtester calls the Strategy's Cleanup method after all processing is complete for a symbol. Override the Cleanup method to dispose of any necessary objects or data that are not handled by normal .NET garbage collection.
using WealthLab.Backtest;
using WealthLab.Core;

namespace WealthLab
{
    public class MyStrategy : UserStrategyBase
    {
        //this example illustrates the Execute method by adding the closing price to a
	    //summation variable each time it is called, then displaying the average close
        public override void Execute(BarHistory bars, int idx)
        {
			sumClose += bars.Close[idx];
        }

	    //display average close on chart
		public override void Cleanup(BarHistory bars)
		{
			double avg = sumClose / bars.Count;
			DrawHeaderText(avg.ToString("N2"));
		}

		//declare private variables below
		private double sumClose = 0;
    }
}
The backtester calls the Strategy's Execute method for each bar of data being processed. The BarHistory being processed is passed in the bars parameter. The numeric index being processed is passed in the idx parameter. Override the Execute method to implement the Strategy's primary logic.
using WealthLab.Backtest;
using WealthLab.Core;

namespace WealthLab
{
    public class MyStrategy : UserStrategyBase
    {
        //this example illustrates the Execute method by adding the closing price to a
	    //summation variable each time it is called, then displaying the average close
        public override void Execute(BarHistory bars, int idx)
        {
			sumClose += bars.Close[idx];
        }

	    //display average close on chart
		public override void Cleanup(BarHistory bars)
		{
			double avg = sumClose / bars.Count;
			DrawHeaderText(avg.ToString("N2"));
		}

		//declare private variables below
		private double sumClose = 0;
    }
}
Note!
The indicator NextSessionOpen is a better overall option for strategies that use the session's opening price. This ExecuteSessionOpen() method can be considered obsolete, but remains functional for legacy code.
Override and use this method to perform any processing that requires the session open price of the current trading day. The price is passed via the sessionOpenPrice parameter.
During backtesting, WealthLab looks at the next daily bar of data to determine the session open price. With respect to Daily bars, sessionOpenPrice is the opening price of the next bar. For an intraday chart, sessionOpenPrice returns the open of the current session but looks to the next session when processing the last bar of the day.
For live trading, WealthLab will attempt to load the price from active quote streams or by Historical Data Providers that are enabled in the Data Manager and will keep trying to get the session open price during market hours for up to 20 seconds, so overriding this method could impact live trading Strategy performance. For a more than 4 to 6 symbols, drag the DataSet into a Quotes tool, check the market at the bottom and start Streaming
Remarks
- ExecuteSessionOpen() is called after Execute().
- The Execute() method needs to be included but need not be used.
- On the final bar (bars.Count - 1), ExecuteSessionOpen() will be called only during market hours on a trading day.
- The Wealth-Data Provider generally returns the primary market opening price. If the primary market has not yet traded (could be several minutes after the opening bell for NYSE stocks), the first-traded price may be returned.
For a demonstration, see this Youtube video (created before Streaming was available to this method):

Run the example on Daily bars and take note (see Debug Window) that ExecuteSessionOpen() is not called outside of market hours since the next session opening price is unknown.
The example uses sessionOpenPrice to determine if a -2% gap down occurred, and if the RSI value is over 40, the strategy shorts at a limit price 1% above the sessionOpenPrice and covers at the close.
using WealthLab.Backtest;
using System;
using WealthLab.Core;
using WealthLab.Indicators;
using System.Collections.Generic;

namespace WealthScript123
{
    public class ShortTheGap : UserStrategyBase
    {
        public override void Initialize(BarHistory bars)
        {
			StartIndex = 20;
			_rsi = RSI.Series(bars.Close, 10);
			PlotIndicatorLine(_rsi);
			PlotStopsAndLimits(3);
        }

        public override void Execute(BarHistory bars, int idx)
        {
			WriteToDebugLog("Execute " + idx + "\t" + bars.DateTimes[idx].ToShortDateString() + "\tClose: " + bars.Close[idx].ToString("N2"));
		}

		public override void ExecuteSessionOpen(BarHistory bars, int idx, double sessionOpenPrice)
		{
			double gap = sessionOpenPrice / bars.Close[idx];
			if (gap < 0.98 && _rsi[idx] > 40)
			{
				PlaceTrade(bars, TransactionType.Short, OrderType.Limit, sessionOpenPrice * 1.01, gap.ToString("N4"));
				PlaceTrade(bars, TransactionType.Cover, OrderType.MarketClose);
			}

			WriteToDebugLog("ExSnOp " + idx + "\t" + bars.DateTimes[idx].ToShortDateString() + "\tClose: " + bars.Close[idx].ToString("N2")
				+ ", Next Open: " + sessionOpenPrice.ToString("N2"));
		}

		//private variables
		RSI _rsi;
	}
}
Returns the name of the DataSet that is currently being processed. If the Strategy was not executed on a DataSet (single symbol mode), returns null.
using WealthLab.Backtest;
using WealthLab.Core;
using System.Drawing;

namespace WealthScript1
{
	public class MyStrategy : UserStrategyBase
	{
		//Initialize
		public override void Initialize(BarHistory bars)
		{
			string dsn = ExecutionDataSetName;
			if (dsn == null)
				DrawHeaderText("Symbol: " + bars.Symbol, WLColor.Black, 20);
			else
				DrawHeaderText(ExecutionDataSetName, WLColor.Black, 20);
		}

		//Execute
		public override void Execute(BarHistory bars, int idx)
		{
		}
	}
}
Returns the execution mode of the backtester.
For details and an example, see Enums > StrategyExecutionModes
If your Strategy uses the Max Risk Percent position sizing method, WL8 calls this method to determine the stop loss level for a trade at the time it is placed. The default implementation uses the Max Risk Indicator that is defined in Trading Preferences. Override this method to customize the stop loss level.
For a demonstration, see this Youtube video:
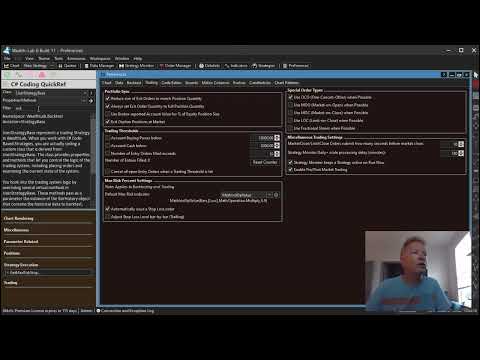
using WealthLab.Backtest;
using System;
using WealthLab.Core;
using WealthLab.Indicators;
using System.Collections.Generic;

namespace WealthScript1
{
    public class MyStrategy : UserStrategyBase
    {
        public override void Initialize(BarHistory bars)
        {
        }

        public override double GetMaxRiskStopLevel(BarHistory bars, PositionType pt, int idx)
        {
			double atr = ATR.Series(bars, 14)[idx] * 1.5;
			double stop = (pt == PositionType.Long) ? bars.Low[idx] - atr : bars.High[idx] + atr;
            return stop;
        }

        public override void Execute(BarHistory bars, int idx)
        {
            if (!HasOpenPosition(bars, PositionType.Long))
            {
                if(bars.Close.CrossesOver(SMA.Series(bars.Close,20),idx))
					PlaceTrade(bars, TransactionType.Buy, OrderType.Market);
            }
            else
            {
				if(bars.Close.CrossesUnder(SMA.Series(bars.Close, 20), idx))
					PlaceTrade(bars, TransactionType.Sell, OrderType.Market);
            }
        }
    }
}
The backtester calls the Strategy's Initialize method prior to beginning the main trading logic loop. Initialize is called once for each symbol being backtested, and the symbol's BarHistory is passed in the bars parameter. Override this method to create any instances of indicators and other objects your Strategy will need.
using WealthLab.Backtest;
using WealthLab.Core;
using WealthLab.Indicators;

namespace WealthLab
{
    public class MyStrategy : UserStrategyBase
    {
        //create indicators and other objects here, this is executed prior to the main trading loop
        public override void Initialize(BarHistory bars)
        {
            myRSI = new RSI(bars.Close, 14);
            PlotIndicator(myRSI);
        }

        //execute the strategy rules here, this is executed once for each bar in the backtest history
        public override void Execute(BarHistory bars, int idx)
        {
        }

        //declare private variables below
        RSI myRSI;
    }
}
Returns true if the Strategy is running as a Component within a MetaStrategy.
Use this method to regenerate indicators on each new WFO interval for the WFO out-of-sample backtest. Since indicators are usually created in Initialize, to make a WFO recalculate indicators that use Parameters you must override NewWFOInterval.
using WealthLab.Backtest;
using System;
using WealthLab.Core;
using WealthLab.Indicators;
using System.Collections.Generic;
using WealthLab.AdvancedSmoothers;

namespace WealthScript123
{
    public class SARVWMA : UserStrategyBase
    {
		public SARVWMA()
		{
			AddParameter("VWMA Period", ParameterType.Int32, 90, 50, 150, 10);
		}

		public override void Initialize(BarHistory bars)
		{
			StartIndex = Parameters[0].AsInt;
			_vwma = VWMA.Series(bars.Close, Parameters[0].AsInt, bars);
			PlotIndicatorLine(_vwma);
		}

		// pick up the parameter changes for a WFO out-of-sample test
        public override void NewWFOInterval(BarHistory bars)
        {
            _vwma = VWMA.Series(bars.Close, Parameters[0].AsInt, bars);
        }

        public override void Execute(BarHistory bars, int idx)
		{
			if (LastPosition?.PositionType == PositionType.Short)
			{
				if (bars.Close.CrossesUnder(_vwma, idx))
				{
					PlaceTrade(bars, TransactionType.Buy, OrderType.Market);
					PlaceTrade(bars, TransactionType.Cover, OrderType.Market);
				}
			}
			else
			{
				if (bars.Close.CrossesOver(_vwma, idx))
				{
					PlaceTrade(bars, TransactionType.Sell, OrderType.Market);
					PlaceTrade(bars, TransactionType.Short, OrderType.Market);
				}
			}
		}

		VWMA _vwma;
    }
}
Executes immediately after the main backtesting loop that processed each symbol via the Execute method. PostExecute gives you a chance to operate on the list of symbols that have been processed during this backtesting loop iteration. You are provided the date/time being processed via the dt parameter, and a list of BarHistory instances containing the data being processed this iteration in the participants parameter. Use the GetCurrentIndex method to determine the index to use for a particular BarHistory instance.
using WealthLab.Backtest;
using System;
using WealthLab.Core;
using WealthLab.Indicators;
using WealthLab.ChartWPF;
using System.Drawing;
using System.Collections.Generic;

namespace WealthLab
{
	public class MyStrategy : UserStrategyBase
	{
		//create indicators and other objects here, this is executed prior to the main trading loop
		public override void Initialize(BarHistory bars)
		{
		}

		//execute the strategy rules here, this is executed once for each bar in the backtest history
		public override void Execute(BarHistory bars, int idx)
		{
		}

		//report on symbols that were processed
		public override void PostExecute(DateTime dt, List<BarHistory> participants)
		{
			string s = dt.ToShortDateString() + ": Symbols=" + participants.Count + " ";
			foreach (BarHistory bh in participants)
				s += bh.Symbol + ",";
			WriteToDebugLog(s);
		}
	}
}
Executes immediately prior to the main backtesting loop that processed each symbol via the Execute method. PreExecute gives you a chance to operate on the list of symbols that are being processed during this backtesting loop iteration. You are provided the date/time being processed via the dt parameter, and a list of BarHistory instances containing the data being processed this iteration in the participants parameter. Use the GetCurrentIndex method to determine the index to use for a particular BarHistory instance.
using WealthLab.Backtest;
using System;
using WealthLab.Core;
using WealthLab.Indicators;
using WealthLab.ChartWPF;
using System.Drawing;
using System.Collections.Generic;

namespace WealthLab
{
	public class MyStrategy : UserStrategyBase
	{
		//the list of symbols that we should buy each bar
		private static List<BarHistory> buys = new List<BarHistory>();

		//create the weight indicator and stash it into the BarHistory object for reference in PreExecute
		public override void Initialize(BarHistory bars)
		{
			rsi = new RSI(bars.Close, 14);
			bars.Cache["RSI"] = rsi;
		}

		//this is called prior to the Execute loop, determine which symbols have the lowest RSI
		public override void PreExecute(DateTime dt, List<BarHistory> participants)
		{
			//store the symbols' RSI value in their BarHistory instances
			foreach (BarHistory bh in participants)
			{
				RSI rsi = (RSI)bh.Cache["RSI"];
				int idx = GetCurrentIndex(bh);  //this returns the index of the BarHistory for the bar currently being processed
				double rsiVal = rsi[idx];
				bh.UserData = rsiVal; //save the current RSI value along with the BarHistory instance
			}

			//sort the participants by RSI value (lowest to highest)
			participants.Sort((a, b) => a.UserDataAsDouble.CompareTo(b.UserDataAsDouble));

			//keep the top 3 symbols
			buys.Clear();
			for (int n = 0; n < 3; n++)
			{
				if (n >= participants.Count)
					break;
				buys.Add(participants[n]);
			}
		}

		//execute the strategy rules here, this is executed once for each bar in the backtest history
		public override void Execute(BarHistory bars, int idx)
		{
			bool inBuyList = buys.Contains(bars);
			if (!HasOpenPosition(bars, PositionType.Long))
			{
				//buy logic - buy if it's in the buys list
				if (inBuyList)
					PlaceTrade(bars, TransactionType.Buy, OrderType.Market);
			}
			else
			{
				//sell logic, sell if it's not in the buys list
				if (!inBuyList)
					PlaceTrade(bars, TransactionType.Sell, OrderType.Market);
			}
		}

		//declare private variables below
		private RSI rsi;
	}
}
This property controls the starting point of your backtest, specified as a bar number index. By default, StartIndex return 0, which means that your Strategy's Execute method will first get called with a bar index of zero. If you assign a higher value to StartIndex, the Execute method will first get called at the index you specified.
This can be useful to avoid unnecessary calls to Execute. For example, if your Strategy uses a 200 bar moving average, you can set StartIndex to 199 to prevent the Execute method from being called 199 times before the moving average is available.
The backtester also uses StartIndex to determine the entry bar for the benchmark buy & hold comparison. In the example above, the buy & hold comparison would have also entered its position at bar 199, making the benchmark a more fair comparison.
using WealthLab.Backtest;
using System;
using WealthLab.Core;
using WealthLab.Indicators;
using WealthLab.ChartWPF;
using System.Drawing;
using System.Collections.Generic;

namespace WealthLab
{
    public class MyStrategy : UserStrategyBase
    {
		//first 200 bars not needed
		public override void Initialize(BarHistory bars)
        {
			sma200 = new SMA(bars.Close, 200);
			StartIndex = 199;
        }

        //a price/SMA crossover
        public override void Execute(BarHistory bars, int idx)
        {
            if (!HasOpenPosition(bars, PositionType.Long))
            {
                if (bars.Close.CrossesOver(sma200, idx))
					PlaceTrade(bars, TransactionType.Buy, OrderType.Market);
            }
            else
            {
                if (bars.Close.CrossesUnder(sma200, idx))
					PlaceTrade(bars, TransactionType.Sell, OrderType.Market);
            }
        }

		//declare private variables below
		private SMA sma200;
    }
}
Use this method to close the specified Position object (pos) at a trailing stop. Specify the type of trailing stop in the tst parameter. You can specify percentage, point or ATR based (Chandelier) trailing stops, and specify whether the trailing stop is based off closing prices or off high/lows. The amount parameter specifies the size of the stop, either in percentage, point or ATR multiplier according to the tst parameter. The atrPeriod parameter indicates the ATR lookback period and only applies when parameter tst is TrailingStopType.ATR.
using WealthLab.Backtest;
using System;
using WealthLab.Core;
using WealthLab.Data;
using WealthLab.Indicators;
using System.Collections.Generic;

namespace WealthScript124
{
    public class MyStrategy : UserStrategyBase
    {

        public override void Initialize(BarHistory bars)
        {
			StartIndex = 50;
			_highest = Highest.Series(bars.High, 50);
			PlotIndicator(_highest);
			PlotStopsAndLimits(3);
        }


        public override void Execute(BarHistory bars, int idx)
        {
            if (!HasOpenPosition(bars, PositionType.Long))
            {
				PlaceTrade(bars, TransactionType.Buy, OrderType.Stop, _highest[idx]);
            }
            else
            {
				Position p = LastPosition;

				// Sell at a 8% stop loss
				ClosePosition(p, OrderType.Stop, p.EntryPrice * 0.92, "S/L");

				// Install a 2.5% Trailing Stop once the position has gained more than 5 percent
	            if (p.MFEPctAsOf(idx) > 5)
					CloseAtTrailingStop(p, TrailingStopType.PercentHL, 2.5, "T-Stop");

            }
        }

		Highest _highest;
    }
}
Use this method to explicitly close a Position object (pos). Specify the orderType to use to close the position. If you use a limit or stop order, specify the order price in the price parameter.
OrderType is one of the following enumerations (see Enums for more info):
- OrderType.Market
- OrderType.Limit
- OrderType.Stop
- OrderType.LimitMove
- OrderType.MarketClose
- OrderType.FixedPrice
You can pass an optional exitSignalName parameter, which will be assigned to the Transaction object's SignalName property, and will ultimately be assigned to the resulting Position's ExitSignalName property.
using WealthLab.Backtest;
using System;
using WealthLab.Core;
using WealthLab.Indicators;
using WealthLab.ChartWPF;
using System.Drawing;
using System.Collections.Generic;

namespace WealthLab
{
    public class MyStrategy : UserStrategyBase
    {
        //create indicators and other objects here, this is executed prior to the main trading loop
        public override void Initialize(BarHistory bars)
        {
			rsi = new RSI(bars.Close, 14);
			PlotIndicator(rsi);
        }

        //buy multiple positions when RSI oversold
        public override void Execute(BarHistory bars, int idx)
        {
			if (rsi[idx] < 30)
				PlaceTrade(bars, TransactionType.Buy, OrderType.Market);

			if (rsi[idx] > 60)
			{
				//sell open positions one by one, sell the least profitable position first
				Position pos = null;
				double lowestProfit = Double.MaxValue;
				foreach (Position openPos in OpenPositions)
					if (openPos.ProfitAsOf(idx) < lowestProfit)
					{
						lowestProfit = openPos.ProfitAsOf(idx);
						pos = openPos;
					}
				if (pos != null)
					ClosePosition(pos, OrderType.Market);
			}
        }

		//declare private variables below
		private RSI rsi;
    }
}
Places a simulated order, and returns an instance of the Transaction class the represents it. The WealthLab backtester will determine the number of shares based on the position size settings you established in the Strategy Settings. The backtester will attempt to fill the trade at the start of the following bar, and the simulation must have sufficient simulated capital to do so.
For the bars parameter, pass the same bars parameter value that you received in the call to the Execute method.
For the transType parameter, specify TransactionType.Buy, TransactionType.Sell, TransactionType.Short, or TransactionType.Cover.
For the orderType parameter, specify OrderType.Market, OrderType.Limit or OrderType.Stop.
For limit and stop orders, supply an order price in the price parameter.
The positionTag parameter allows you to optionally maintain groups of positions, using integer codes that you specify. You can locate an open position with a matching positionTag by calling the FindOpenPosition method. This method is used internally by Building Block strategies.
The second constructor allows you to pass a signalName parameter. This string will be assigned to the Transaction's SignalName property, and will ultimately end up assigned to the resulting Position's EntrySignalName or ExitSignalName properties.
The method returns an instance of the Transaction class that represents the transaction. You can assign a value to the Transaction.Quantity to override the Strategy position sizing, and employ Strategy-specific position sizing. If you assign a Quantity to an exit Transaction (Sell, Cover) then one of the following can occur:
- If the Quantity is less than the Quantity of the matched open Position, WL8 will split the Position into two, and close out Position with the specified Quantity.
- If the Quantity is greater than the matched open Position, and there are multiple open Positions in the backtest, WL8 will split the Transaction into multiple instance, and close out as many open Positions as possible with the specified Quantity. You can effectively close out all open Positions by assigning Double.MaxValue to an exit Transaction's Quantity.
using WealthLab.Backtest;
using System;
using WealthLab.Core;
using WealthLab.Indicators;
using WealthLab.ChartWPF;
using System.Drawing;
using System.Collections.Generic;

namespace WealthLab
{
	public class MyStrategy : UserStrategyBase
	{
		//create indicators and other objects here, this is executed prior to the main trading loop
		public override void Initialize(BarHistory bars)
		{
			hh = new Highest(bars.High, 33);
			ll = new Lowest(bars.Low, 33);
			PlotIndicator(hh, WLColor.Green);
			PlotIndicator(ll, WLColor.Red);
		}

		//a basic stop and reverse system
		public override void Execute(BarHistory bars, int idx)
		{
			PlaceTrade(bars, TransactionType.Cover, OrderType.Stop, hh[idx]);
			PlaceTrade(bars, TransactionType.Sell, OrderType.Stop, ll[idx]);
			if (!HasOpenPosition(bars, PositionType.Long))
				PlaceTrade(bars, TransactionType.Buy, OrderType.Stop, hh[idx]);
			if (!HasOpenPosition(bars, PositionType.Short))
				PlaceTrade(bars, TransactionType.Short, OrderType.Stop, ll[idx]);
		}

		//declare private variables below
		IndicatorBase hh;
		IndicatorBase ll;
	}
}
Issues a buy or sell, as appropriate, to cause the symbol specified in bars to allocate a percentage of the current backtest equity specified in percentOfEquity. If there is no open Position for bars, will issue a buy order for the full number of shares required to allocate the position. If there is already one or more open Positions, will issue a buy if more shares are required or a sell for fewer shares. This will typically cause other smaller Positions to be opened for the symbol, including the splitting of a larger open Position into two in order to sell a portion of it.
Remarks:
- The minimum Position size for rebalance is determined by the SymbolInfo.QuantityDecimals.
- See Preferences > Other Settings > Position Matching to control which Positions are exited first.
For a demonstration, see this Youtube video:
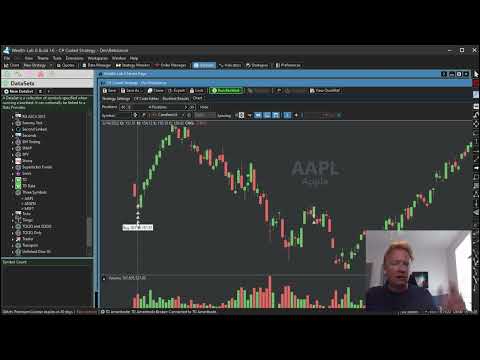
using WealthLab.Backtest;
using System;
using WealthLab.Core;
using WealthLab.Indicators;
using System.Collections.Generic;

namespace WealthScript123
{
	//Rebalances the strategy every month so each symbol shares an equal weight
    public class MyStrategy : UserStrategyBase
    {
        //create indicators and other objects here, this is executed prior to the main trading loop
        public override void Initialize(BarHistory bars)
        {
			StartIndex = 1;
        }

        public override void PreExecute(DateTime dt, List<BarHistory> participants)
        {
			pct = 100.0 / participants.Count;
            base.PreExecute(dt, participants);
        }

        //execute the strategy rules here, this is executed once for each bar in the backtest history
        public override void Execute(BarHistory bars, int idx)
        {
			if (bars.DateTimes[idx].Month != bars.DateTimes[idx - 1].Month)
			{
				//rebalance every month
				Rebalance(bars, pct);
			}
        }

		//declare private variables below
		private static double pct;
    }
}
- ATR - A Chandelier stop using a 22-period (default period) Average True Range.
- PercentC - A percentage of closing prices. For example, pass 7.5 for amount for a 7.5% trailing stop based on closing prices.
- PercentHL - Like PercentC, but adjusts based on intraday progress; uses highs for long positions and lows for short positions.
- PointC - amount becomes a point-based stop with respect to closing prices.
- PointHL - Like PointC, but amount is subtracted from highs (long) or added to lows (short) to adjust the trailing stop value.
using WealthLab.Backtest;
using System;
using WealthLab.Core;
using WealthLab.Indicators;
using WealthLab.ChartWPF;
using System.Drawing;
using System.Collections.Generic;

namespace WealthLab
{
	public class MyStrategy : UserStrategyBase
	{
		//create indicators and other objects here, this is executed prior to the main trading loop
		public override void Initialize(BarHistory bars)
		{
			//create a TimeSeries to plot trailing stop
			stops = new TimeSeries(bars.DateTimes);
			PlotTimeSeries(stops, "Trailing Stop", "Price", WLColor.Navy, PlotStyle.Dots);
		}

		//execute the strategy rules here, this is executed once for each bar in the backtest history
		public override void Execute(BarHistory bars, int idx)
		{
			if (HasOpenPosition(bars, PositionType.Long))
			{
				CloseAtTrailingStop(LastPosition, TrailingStopType.PercentHL, 10);
				stops[idx] = LastPosition.TrailingStopPrice;
			}
			else if (idx == bars.Count - 50)
			{
				PlaceTrade(bars, TransactionType.Buy, OrderType.Market);
			}
		}

		//declare private variables below
		private TimeSeries stops;
	}
}