Walk Forward Optimization Request:
1. A matrix or analysis type result function to help find most optimal IS runs and OS Parameters. Similar to what strategyquant.com describes here https://strategyquant.com/doc/strategyquant/walk-forward-optimization/
2. A metric tab like standard optimization to display all OS results together if one were re-optimizing their strategy every IS timeframe to compare with parameters against a standard optimization and see all score cord metrics like APR, positions, and how bad the drawdown and upside would be over the entire strategy duration.
you can erase the other post, as this simplifies the feature request.
Rename
It appears this could also be another positive side effect if you succeed with getting the Syncfusion free license mentioned here:
https://www.wealth-lab.com/Discussion/Filter-optimization-results-6482
https://www.wealth-lab.com/Discussion/Filter-optimization-results-6482
If not already, then please do not forget to vote on this follow-up request:
https://www.wealth-lab.com/Discussion/Advanced-filtering-of-optimization-results-7015
https://www.wealth-lab.com/Discussion/Advanced-filtering-of-optimization-results-7015
Since this item is close to the top I'm trying to grasp what's being requested here.
1) The first feature points to a matrix like produced in SrtrategyQuant. Is it this matrix?
"It is simply a set of Walk-Forward optimizations performed with different number of reoptimization periods and different Out of Sample %." The idea is to perform a Meta-optimization that runs multiple WFO optimizations with varying intervals and OOS percentages? Okay. Could be interesting. Certainly a non-trivial effort and probably would belong in its own extension? I guess that's one you'd leave running overnight.
2) "A metric like standard optimization to display all OS results together." I'm having trouble envisioning exactly what this would like above and beyond what we already present.
2) Its the summation of the OS totals if the of the overall WFO timeframe should you run the WFO utilizing the recommended re-optimization timeframe.
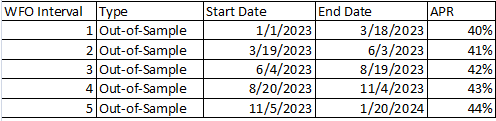
For example See the following WFO Results:

Now if we would invest $5000 and run optimization per the specified WFO timeframes what would the resulting APR and profit?
Essentially this is the reason to run WFO per the determined timeframe from #1 to see how often the strategy should be re-optimized to make it more robust. So if I were to do this for the duration of the strategy, what would the total OS APR & profit then be?
Its just adding up the OS results of the WFO. I hope this explains the intent of #2 better.
For example See the following WFO Results:
Now if we would invest $5000 and run optimization per the specified WFO timeframes what would the resulting APR and profit?
Essentially this is the reason to run WFO per the determined timeframe from #1 to see how often the strategy should be re-optimized to make it more robust. So if I were to do this for the duration of the strategy, what would the total OS APR & profit then be?
Its just adding up the OS results of the WFO. I hope this explains the intent of #2 better.
The value of it still isn’t clear to me. You just reproduced the first table but eliminated the in-sample rows.
I did not show the resultant equity and resultant APR with that table shown below where the resultant profit and resultant APR utilizing original strategy investment would be if you re-optimized the strategy every WFO interval to match the WFO as intended.
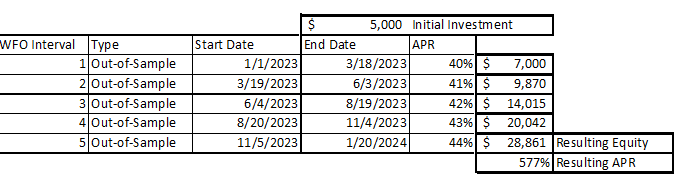
It's misleading to simply add the equities together like that. This ignores the fact that WFO parameters can change mid-position. The accurate way to view the overall result is to use the already existing feature here:
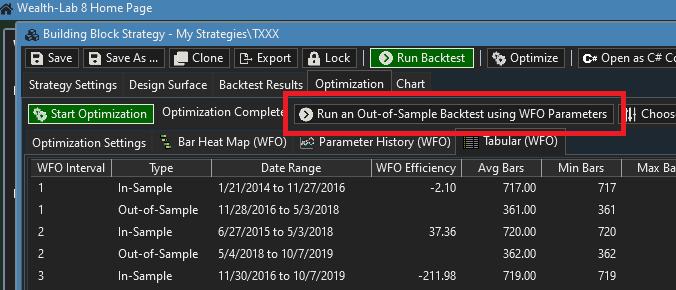
So that feature already runs the strategy utilizing all the oos parameter at each timeframe increment and shows the result? Then yeah, that accomplishes what I was asking for then on #2.
Your Response
Post
Edit Post
Login is required