While testing SymbolInd, I get WL hanging. I prepared a video where you can see that this indicator cannot be loaded within five minutes and at this time WL freezes. Before that I tried to wait half an hour with the same result.
Perhaps these topics are somehow related:
https://www.wealth-lab.com/Discussion/Slow-backtesting-of-Pairs-Trading-strategy-9555
https://www.wealth-lab.com/Discussion/SymbolInd-slows-down-Strategy-Builder-9047
Attached video:
https://drive.google.com/file/d/1gqd0Lz2KxpinPUWfHCdaU2dIvG21eh9W/view?usp=sharing
Rename
This capture creates impression of data lookup going on when WL is hitting a data provider that tries to request the high frequency intraday data over and over. What historical data providers are enabled in the DM and in what order?
Eugene, hi!
I left only those checkboxes that are necessary for the test. Initially, there were much more checkmarks. The result hasn't changed.
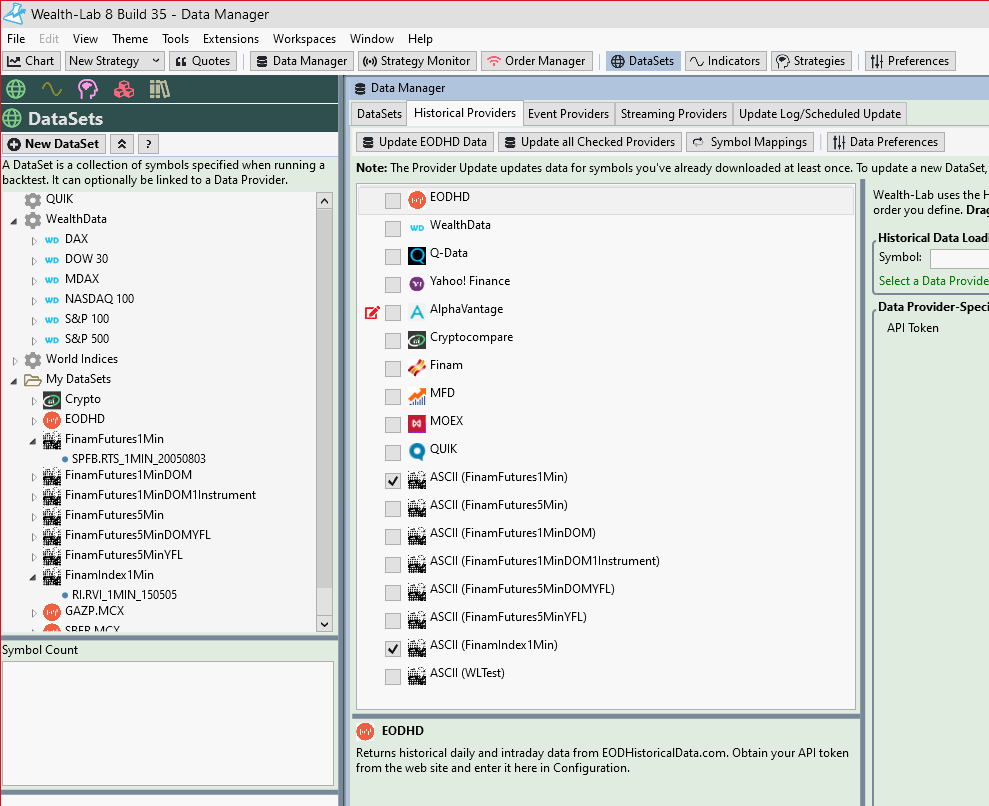
I left only those checkboxes that are necessary for the test. Initially, there were much more checkmarks. The result hasn't changed.
Hi Denis,
On second thought, there's custom indicator (of your construction) involved: "Candles". Can you make SymbolInd plot plain vanilla time series like OHLC?
On second thought, there's custom indicator (of your construction) involved: "Candles". Can you make SymbolInd plot plain vanilla time series like OHLC?
Eugene,
I set the standard indicator AveragePriceOHLC, everything worked fine.
I send the code of the indicator on which WL hangs. Previously, this indicator worked well.
Please help me understand what is wrong. Perhaps I made a mistake in the indicator code.
I set the standard indicator AveragePriceOHLC, everything worked fine.
I send the code of the indicator on which WL hangs. Previously, this indicator worked well.
CODE:


using WealthLab.Core;
using System;
using System.Drawing;
using WealthLab.Indicators;

namespace WealthLab.Indicators
{

   //the VChart indicator
   public class Candles : IndicatorBase
   {
      //parameterless constructor
      public Candles() : base()
      {
      }

      //for code based construction
      public Candles(BarHistory source, PriceComponent pc)
         : base()
      {
         Parameters[0].Value = source;
         Parameters[1].Value = pc;
         Populate();
      }

      //static method
      public static Candles Series(BarHistory source, PriceComponent pc)
      {
         string key = CacheKey("Candles", pc);
         if (source.Cache.ContainsKey(key))
            return (Candles)source.Cache[key];
         Candles vchart = new Candles(source, pc);
         source.Cache[key] = vchart;
         return vchart;
      }

      //Name
      public override string Name => "Value Chart";

      //Abbreviation
      public override string Abbreviation => "Candles";

      //description
      public override string HelpDescription => "The Value Charts indicator developed by Mark W. Helweg. Applies a volatility based detrending to the source price component.";

      //pane
      public override string PaneTag => "Candles";

      //access price component used
      public PriceComponent PriceComponent1 => Parameters[1].AsPriceComponent;

      //default color
      public override WLColor DefaultColor => WLColor.Red;

      //default plot style
      public override PlotStyle DefaultPlotStyle => PlotStyle.BarChart;

      //populate
      public override void Populate()
      {
         //get parameter values
         BarHistory source = Parameters[0].AsBarHistory;

         //BarHistory bh = new BarHistory("RI.RVI_1MIN_150505", Frequency.Minute);

         //BarHistory bh = GetHistory(bars, "RI.RVI_1MIN_150505");

         if (source == null)
            return;
         PriceComponent pc = Parameters[1].AsPriceComponent;

         //set datetimes
         DateTimes = source.DateTimes;

         switch (pc)
         {
            case PriceComponent.Open:
               for (int n = 0; n < source.Close.Count; n++)
               {
                  Values[n] = source.Open[n];
               }
               break;

            case PriceComponent.High:
               for (int n = 0; n < source.Close.Count; n++)
               {
                  Values[n] = source.High[n];
               }
               break;

            case PriceComponent.Low:
               for (int n = 0; n < source.Close.Count; n++)
               {
                  Values[n] = source.Low[n];
               }
               break;

            case PriceComponent.Close:
               for (int n = 0; n < source.Close.Count; n++)
               {
                  Values[n] = source.Close[n];
               }
               break;

            case PriceComponent.Volume:
               for (int n = 0; n < source.Close.Count; n++)
               {
                  Values[n] = source.Volume[n];
               }
               break;

            default:

               break;
         }
      }

      //generate parameters
      protected override void GenerateParameters()
      {
         AddParameter("Source", ParameterType.BarHistory, null);
         AddParameter("Price Component", ParameterType.PriceComponent, PriceComponent.Close);
      }

      //get corresponding bar chart companion indicator
      public override IndicatorBase GetBarChartCompanion(PriceComponent pc)
      {
         if (PriceComponent1 == pc)
            return this;
         return new Candles(Parameters[0].AsBarHistory, pc);
      }
   }
}
Please help me understand what is wrong. Perhaps I made a mistake in the indicator code.
Looks OK on the surface. What's the point in choosing Candles when you can simply select OHLC in the SymbolInd indicator?
Eugene,
I used the Candles indicator earlier with the SymbolInd indicator and had no problems.
The AveragePriceOHLC indicator provides information only about the average price in the form of a line. The Candles indicator draws full-fledged candles. For my analysis, full-fledged candles are needed.
Were you able to reproduce the freezing problem?
Eugene, hi!
I recently tested this indicator again on the current version of WL (build 37).
The indicator works every other time. It seemed to me that it depends on the time settings of the chart, but I could not confirm this guess.
I recently tested this indicator again on the current version of WL (build 37).
The indicator works every other time. It seemed to me that it depends on the time settings of the chart, but I could not confirm this guess.
Your Response
Post
Edit Post
Login is required