There is a built-in Pairs Trading strategy. Testing on a 5 minute interval takes a very long time. Much longer than single symbol strategies. 8 minutes versus less than 10 seconds on a single symbol strategy.
It would be nice to increase the speed of testing on multi-symbol strategies.
It would be nice to increase the speed of testing on multi-symbol strategies.
Rename
I believe the slowdown is taking place in the GetHistory call. Try to pass on the name of the DataSet and see if it alleviates the issue:
Pairs Trading is mostly thought as a Daily strategy though.
CODE:
public BarHistory GetHistory(BarHistory synchWith, string symbol, string dataSetName = null)
Pairs Trading is mostly thought as a Daily strategy though.
Eugene, hi!
Thanks, I've applied the edits you suggested. Received acceleration from 7 minutes of the test to 5 minutes.
I wonder what caused the acceleration? Is it possible to speed up even more? Because with the current test time, optimization is not possible.
Thanks, I've applied the edits you suggested. Received acceleration from 7 minutes of the test to 5 minutes.
I wonder what caused the acceleration? Is it possible to speed up even more? Because with the current test time, optimization is not possible.
The strategy "as is" runs in about 15 seconds for me on about 200,000 5-minute bars (10 years).
Which provider do you use? Maybe the slowness is downloading the data each time?
If that's not it, watch the status bar for "Running Backtest..."
1. How long does "Running Backtest..." appear?
2. When "Running Backtest..." disappears the post-processing begins. How long from this point until the results are displayed?
If #2 is the "long pole", probably you should try to isolate a slow performance visualizer - start by removing finantic visualizers and then others that seem more complex.
By the way, probably not related but, a few days ago, I discover that, if you have the Finantic SvoreCard extension, the Compare tool is quite “expensive”. When I installed it, I simply selected all the metrics and tools (the more the merrier, or so I thought). Then I incidentally read a comment from Dr.Koch about it affecting performance and since disabling it I saw a huge performance increase. From now on, I will only activate it when/if I need it.
Further details here:
https://www.wealth-lab.com/Discussion/Finantic-ScoreCard-causes-delays-during-backtesting-9492
Although this is not part of the base installation, maybe it should be mentioned in a FAQ somewhere. Since long that I was wondering why my backtests got so slow on my installation and could not figure it our.
Cone, hello!
I'm loading data from files using an ASCII provider. The inscription "Running Backtest..." I see most of the time. I do not observe the delay between this inscription disappears and the display of the results.
I'm loading data from files using an ASCII provider. The inscription "Running Backtest..." I see most of the time. I do not observe the delay between this inscription disappears and the display of the results.
Based on what the Alkimist wrote, I do not have the finantic.ScoreCard extension installed.
Just in case, I send a list of installed extensions.

Just in case, I send a list of installed extensions.
I noticed that one of my symbols only went back to 2018. After getting the data back to 2013, the "Running Backtest" part goes for about 30 seconds and then another 30 seconds for the results.
What is your data range, exactly?
How many positions are created?
I'm using a medium-high end machine, but this strategy is creating more than 20,000 positions. Backtests that create this many positions will slow down since they're collected in Lists. (.NET 7 will probably help with that.)
What is your data range, exactly?
How many positions are created?
I'm using a medium-high end machine, but this strategy is creating more than 20,000 positions. Backtests that create this many positions will slow down since they're collected in Lists. (.NET 7 will probably help with that.)
Hello Cone!
Recorded the entire testing process on video:
https://drive.google.com/file/d/1mBGr3RC24FZujjL0gsJa6dchjkIDEcha/view?usp=sharing
The video shows the duration and period of testing, the number of transactions, the time limits of the symbols.
I will also add that my computer is not weak and testing of single-character strategies takes place in a matter of seconds.
Wow, you've got a lot of patience to let a 3-week backtest run for 6 minutes!
From the video, I saw:
- Data is Scaled for 5 Minute bars
- Date Range from 15.02.2014 to 08.03.2014
35 seconds just "Loading Data"
about 5 min 20 sec "Running Backtest"
261 Positions x 2 (0 NSF)
What is the base scale ASCII data? 1 Minute bars? 5 Minute bars?
From the video, I saw:
- Data is Scaled for 5 Minute bars
- Date Range from 15.02.2014 to 08.03.2014
35 seconds just "Loading Data"
about 5 min 20 sec "Running Backtest"
261 Positions x 2 (0 NSF)
What is the base scale ASCII data? 1 Minute bars? 5 Minute bars?
5 Minute bars.
QUOTE:
35 seconds just "Loading Data"
Why is this 5-minute ASCII (?) data loading so slowly, what historical and event providers do you have enabled?
How much RAM and CPU do you have?
Glitch, hello!
Here is my computer data:
Here is my computer data:

Eugene, hi!
Here are the tested quotes:
https://drive.google.com/file/d/1dXPGVL9HCPFnD-XZhdnNQ-eJ1uTiq8fx/view?usp=sharing
https://drive.google.com/file/d/1D3rcFj1jK6L0QT_N_pkiekAXzLCumpej/view?usp=sharing
They are downloaded from the Finam website.
Here are the tested quotes:
https://drive.google.com/file/d/1dXPGVL9HCPFnD-XZhdnNQ-eJ1uTiq8fx/view?usp=sharing
https://drive.google.com/file/d/1D3rcFj1jK6L0QT_N_pkiekAXzLCumpej/view?usp=sharing
They are downloaded from the Finam website.
Denis, could you answer question in Post #11? Thank you.
Eugene,
I don't understand the meaning of this question.
I can answer it on Thursday. I will have an English speaking person with me.
I don't understand the meaning of this question.
I can answer it on Thursday. I will have an English speaking person with me.
Denis, sorry if I wasn't clear. What I meant to say is: which provider checkboxes are enabled in the Data Manager > Historical and Event providers tabs.
Eugene, hi!
Sorry for the delay in reply.
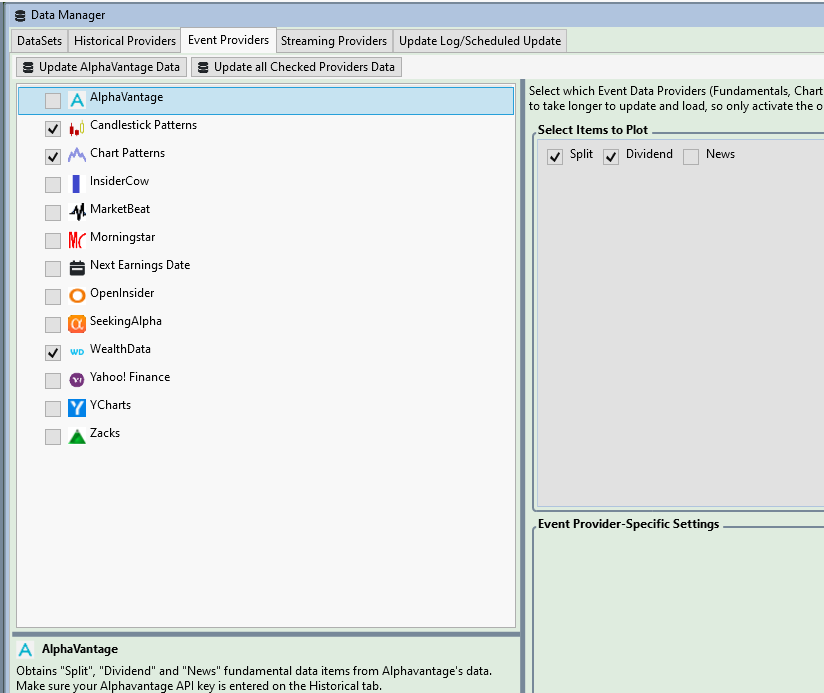
I am sending you the contents of the tabs you are interested in:

Sorry for the delay in reply.
I am sending you the contents of the tabs you are interested in:
Cone, hello!
Base scale ASCII data 1 minute on both symbols.
Previously posted 5 minutes. I was wrong, this is a testing scale.
Base scale ASCII data 1 minute on both symbols.
Previously posted 5 minutes. I was wrong, this is a testing scale.
I've downloaded the data, duplicated your edit and Strategy Settings. The pairs backtest takes under 2 seconds.
.. but I didn't select the Candlestick and Chart Pattern Event providers, and I don't know which patterns you've selected for each. Try deselecting those Event Providers - they could be the source of slowness.
.. but I didn't select the Candlestick and Chart Pattern Event providers, and I don't know which patterns you've selected for each. Try deselecting those Event Providers - they could be the source of slowness.
QUOTE:
Try deselecting those Event Providers - they could be the source of slowness.
That's what I had in mind. They should be left disabled unless you're working on a chart pattern strategy, let alone intraday!
I disabled those checkboxes. And now my testing is going fast. Thanks for the help.
I wonder why these checkboxes slow down exactly when testing on two symbols?
I wonder why these checkboxes slow down exactly when testing on two symbols?
These tasks are computationally intensive and will slow down any backtest.
Eugene, hi!
That's just the point that slowdown occurs exactly on two symbols. And it is not the sum of slowdowns when testing a one-symbol strategy twice.
That's just the point that slowdown occurs exactly on two symbols. And it is not the sum of slowdowns when testing a one-symbol strategy twice.
So that we I can duplicate what you were seeing, please post images of:
1. Preferences > Candlesticks
2. Preferences > Chart Patterns
3. Data Manager > Event Providers > Candlestick Patterns (selected patterns)
3. Data Manager > Event Providers > Chart Patterns (selected patterns)
1. Preferences > Candlesticks
2. Preferences > Chart Patterns
3. Data Manager > Event Providers > Candlestick Patterns (selected patterns)
3. Data Manager > Event Providers > Chart Patterns (selected patterns)


I see it. Just one chart pattern is enough to slow that down significantly. There must be an speed optimization to be had in there somewhere. We'll add it to the list for investigation.
Your Response
Post
Edit Post
Login is required