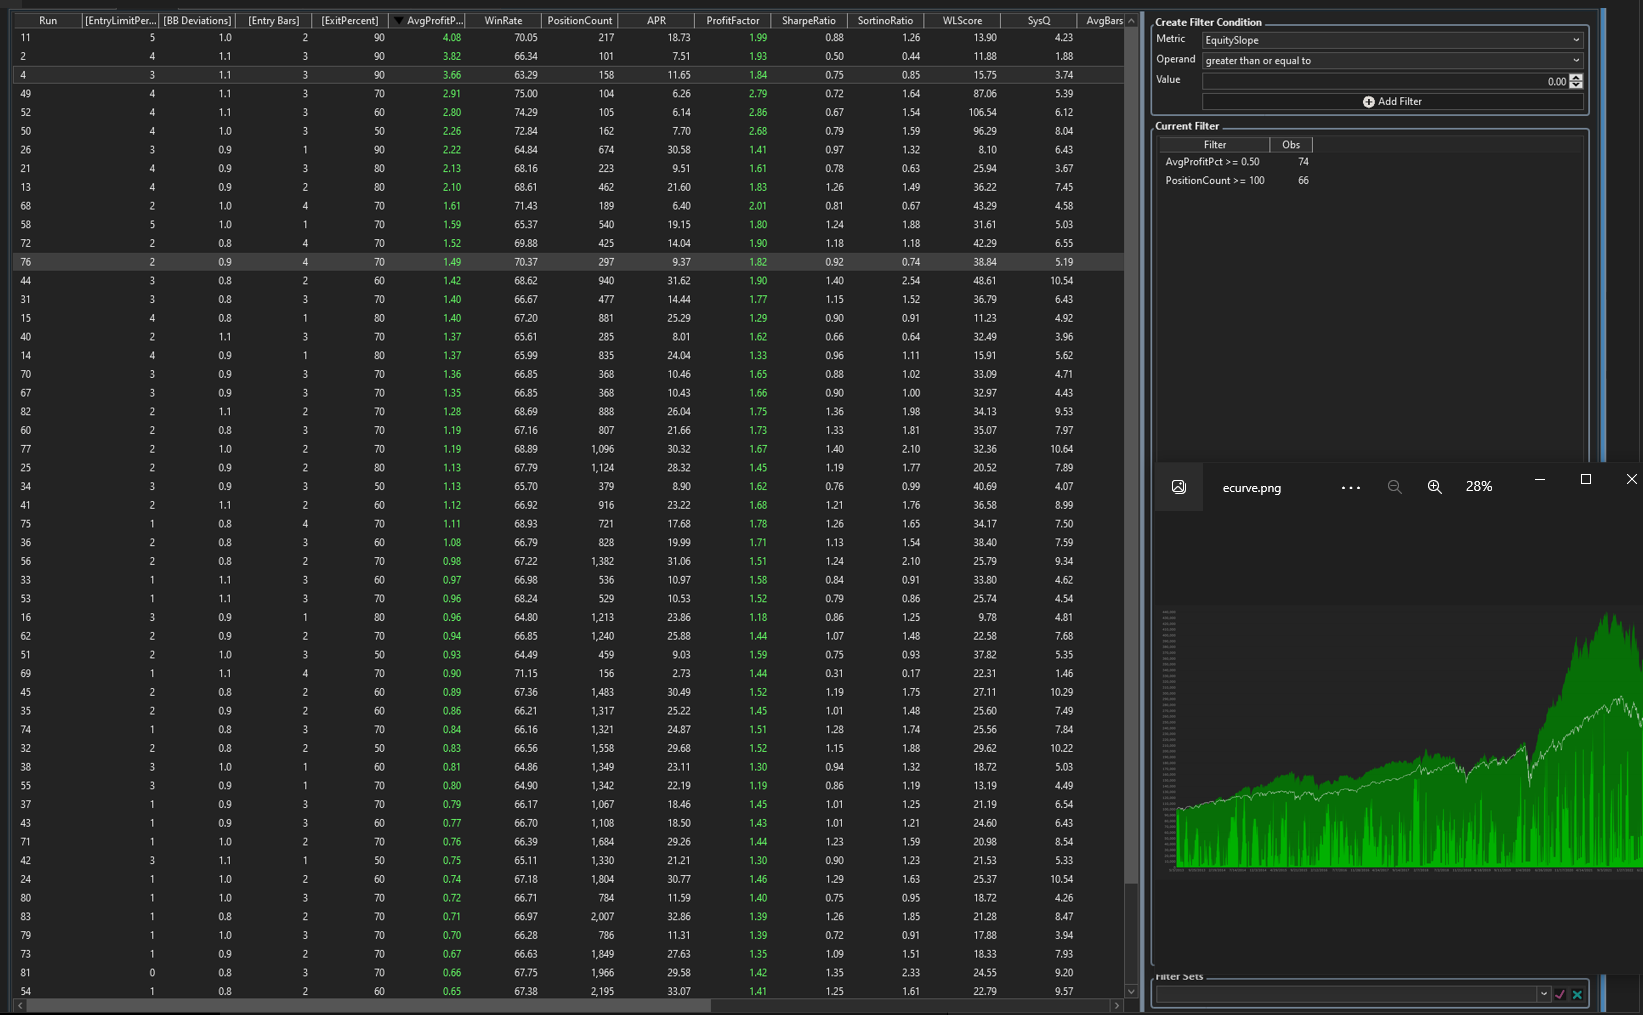
It would be very handy to have the equity curve showing as I go through selections on the optimization results grid.
Rename
Yes that would be nice, but unfortunately we don't preserve the equity curve, only the metric values for each run. This is to conserve resources/memory. You can run the backtest on any specific combination of parameter values which would then show you the equity curve, but I don't think we want to bloat the optimization by including it in each result.
QUOTE:
don't think we want to bloat the optimization by including it [the equity curve] in each result.
Agreed. But more importantly, what are you going to do with the equity curve if you had it available?
What I would do is "feature extract" what you want out of the equity curve and report that as a ScoreCard merit metric you can include in a column. Moreover, now you can include said ScoreCard metric in the Strategy Ranking tool so you can compare one strategy against the other with that metric. This should be your ultimate plan.
QUOTE:
But more importantly, what are you going to do with the equity curve if you had it available?
Good point @superticker, and one obvious thing to make use of such equity curve would be to analyze its smoothness i.e. how downside deviations affect its straightness. The good thing is that a numbers only analysis is possible through the various ratios like Sortino, Lake etc. They're available in Scorecards without the need in a multiple equity curve bloat.
All valid points. I do think though a picture says a thousand words. I might see:
a) that the equity curve has done well lately and look into why or
b) did poor in crashes and look into trend filters, etc
c) or a curve that looks very consistent and just play around with position sizing
All of which are hard to articulate into a measure per se.
It would probably be too expensive to export a picture to disk that can be accessed when the given optimization result is selected?
Yes, it would bog down the optimization big time.
QUOTE:
a) that the equity curve has done well lately ...
b) did poor in crashes and look into trend ...
c) or a curve that looks very consistent ...
All of which are hard to articulate into a measure per se.
Agreed. One ScoreCard merit metric can't feature extract all, unrelated a-thru-c items. But the idea here is to use the ScoreCard metric as a "screener" for stocks that need further investigation. Such stocks could be placed in their own dataset and their equity curves examined more carefully.
Probably a different topic, but I'm disappointed with the lack of the current ScoreCard metrics to measure positive merit over recent time. You can chime in at https://www.wealth-lab.com/Discussion/Building-a-BySymbol2-Performance-Visualizer-8137 if you're interested.
I have been preparing this one for some time, finally brought up today in separate feature request to be redirected here by Eugene :)
A couple of comments:
1 - agree there is a need and no scorecard metric today (WL, Sharpe, Sortino, etc) that provides the equivalent reading of the equity curve smoothness. Even the most recent "Equity Slope" addition does unfortunately not cover smoothness
2 - I don't have sufficient knowledge to develop a visualizer metric - however think the Equity Slope metric could be a good beginning if the p&l impact can be suppressed; in other words - Equity Slope could provide a reading for the linearity/slope and volatility of the curve. This could either one or two separate metrics - respecting performance concerns expressed by Glitch
QUOTE:
I don't have sufficient knowledge to develop a visualizer metric
finantic.ScoreCard brings support for scriptable performance metrics, no need to have development skills:
https://www.wealth-lab.com/extension/detail/finantic.ScoreCard
So it's up to motivated traders to find out if such metric exists and/or create using the toolset provided by finantic.ScoreCard.
thank you Eugene - believe me motivation is High
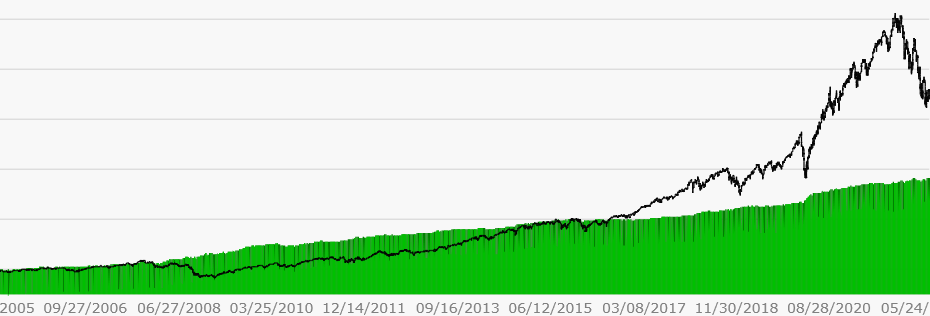
in the interest of simplicity and given #7 , I would be quite happy to see an EquitySlope (linear regression slope of the eq curve, as is today, no change) plus the correlation coefficient (r) of the linear regression to show the fit
the example below shows an EquitySlope of 0.21 for the strategy and 0.57 for the benchmark, insufficient for a metric on the curve. hence (r) would provide the fit to assess the smoothness of the strategy
QUOTE:
2 - I don't have sufficient knowledge to develop a visualizer metric - however think the Equity Slope metric could be a good beginning
We hear you. However, if all you need is a simple linear regression of the equity curve with an "r" correlation coefficient (to judge linear fit), then the finantic.ScoreCard can do this for you without any fancy ScoreCard programming. Take a look at my Reply# 2 in https://www.wealth-lab.com/Discussion/Calling-the-MultipleRegression-fitting-Math-Net-routine-7786 for an example of using its built-in simple linear regression function.
Now if you want something more complicated than simple linear regression of the equity curve, then that does require some ScoreCard coding. And to debug that coding requires some Scott Plotting. (I'm looking at that, but it's not a high priority.)
thank you @superticker - a lot for me to learn, with great appreciation.
already enjoying some of finantic's capabilities, will consider the scorecard as well.
incidentally - my suggestion in #9 appears to respond to Glitch's request (#1) on your link.
ooh well, I may have misplaced the suggestion. Irony is the simple linear regression gets you the correlation coefficient.
I understand the positive shape of the tail end of the curve, you're trying to address with the polynomial version. this exceeds my capability, nevertheless will happy to help in any way i can
already enjoying some of finantic's capabilities, will consider the scorecard as well.
incidentally - my suggestion in #9 appears to respond to Glitch's request (#1) on your link.
QUOTE:
I just had an idea, we recently talked about adding some new Performance Metric(s) to give us the slope of the equity curve. Now, I'm going to add a simple linear regression of the equity curve. But I see there is room for more advanced metrics around this.......
ooh well, I may have misplaced the suggestion. Irony is the simple linear regression gets you the correlation coefficient.
I understand the positive shape of the tail end of the curve, you're trying to address with the polynomial version. this exceeds my capability, nevertheless will happy to help in any way i can
Dr Koch - your help here will be greatly appreciated
Based on above discussion (see #8 .. #10) I have been recommended by Eugene and Superticker to explore the finantIc.scorecard's features. Frankly very impressed with the amount of additional metrics and capabilities.
Could you walk us through how to set up the correlation coefficient on an equity curve - and possibly how to add it to the performance metrics [tabular] optimization report
Many thanks in advance
Your Response
Post
Edit Post
Login is required