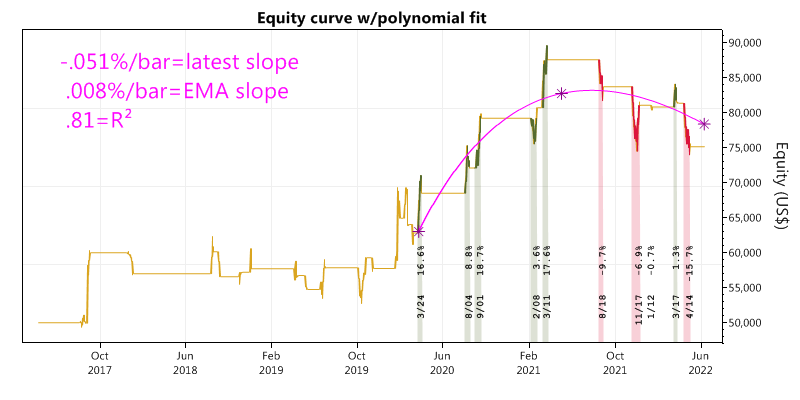
I want to create a new Performance Visualizer that works much like the BySymbol tab. But I want to remove many of the later columns (which BySymbol has) and replace them with two new columns depicting the "latest equity slope" and "R-squared" for the polynomial fit as shown in the graphic.
My original thinking was to create a latest-equity-slope ScoreCard, but I'm really not interested in parameter optimizing by this metric directly (although one might do so in some circumstances). Bottom line, I just want to compute the latest-equity-slope and R-squared metrics for inclusion in two "BySymbol2" columns.
To do so, I need the equity TimeSeries for each symbol, the final Positions for each symbol to build the polynomial fit from, and access to MathNet. So what can I use as starting material for this?
Rename
Currently there are no replies yet. Please check back later.
Your Response
Post
Edit Post
Login is required