I recently made some intersting discoveries and thought to share them here....
But lets start from the beginning:
What is a Limit Order Strategy?
A strategy that enters position with a limit order is here called a Limit Order Strategy.
If you follow this web site since a few months you'll have noticed this one:

The OneNight strategies are on Rank'1 and Rank#2 - since months!
.. and these are Limit Order Strategies.
If you follow Wealth-Lab since years you saw the same pattern: The top ranked strategies are always Limit Order Strategies.
There must be some magic!
The OneNight strategy, when implemented as a Building Block strategy looks like this:
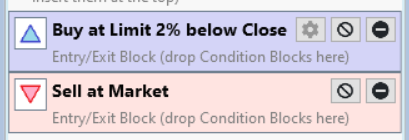
This about the simplest Limit Order Strategy I can imagine.
It buys with a limit order 2% below yestarday's close price and closes a position the next morning at the opening price.
Not much magic visible!
What is going on here?
But lets start from the beginning:
What is a Limit Order Strategy?
A strategy that enters position with a limit order is here called a Limit Order Strategy.
If you follow this web site since a few months you'll have noticed this one:
The OneNight strategies are on Rank'1 and Rank#2 - since months!
.. and these are Limit Order Strategies.
If you follow Wealth-Lab since years you saw the same pattern: The top ranked strategies are always Limit Order Strategies.
There must be some magic!
The OneNight strategy, when implemented as a Building Block strategy looks like this:
This about the simplest Limit Order Strategy I can imagine.
It buys with a limit order 2% below yestarday's close price and closes a position the next morning at the opening price.
Not much magic visible!
What is going on here?
Rename
I did the following:
I created an EODHD DataSet by combining all symbols form S&P 500 and Nasdaq-100, this results in about 530 symbols.
Then I selected all symbols that had no split or dividends during the last 5 years.
This resulted in 35 symbols.
This step is necessary becaouse Granular Processing is currently not able to handle stocks with splits or dividend payments. Vote for #FeatureRequest Adjust-Intraday-Data-for-Granular-Processing if you also think that this should be changed.
With this 5-year DataSet I conducted various backtests:
* Normal EOD backtest with small position size and no NSF positions
* Normal EOD backtest with larger position size and many NSF positions
* Backtest with larger Position size and Granular Processing
* Backtest with LOEWE indicator
QUOTE:I want that feature request to be activated too, but this comment is ONLY for EODHD, right? In other words, it can't handle it if your intraday data is not split, which is the case only for EODHD.
Granular Processing is currently not able to handle stocks with splits
Aside: IQFeed doesn't split intraday at the source either, but our IQFeed Historical provider does a lot of heavy lifting to make that happen.
IMO granular processing is not the place to be putting logic for adjusting intraday data for splits of dividends.
We're not suggesting to adjust the data in the cache.
Rather, it's how to make use the data that you have.
Rather, it's how to make use the data that you have.
The results, for two different strategies look like this:
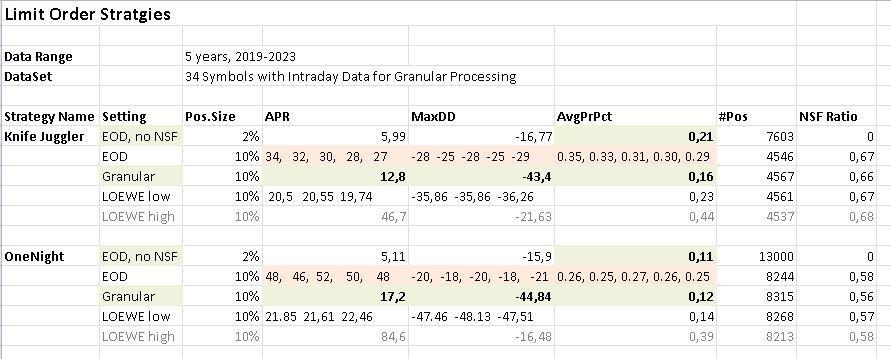
Results for a "normal" backtest with 10% position size (and an NSF Ratio of about 0.6) is shown in the line "EOD".
Is shows the spectacular APR and MaxDD values we know form the Top 5 (and similar) lists.
There are several APR values recorded, because we have way more orders than fills. With an "EOD" backtest the fills are chosen randomly from all available orders of a day.
If such a backtest is run several times, the actual simulated positions change from run to run, and with these various sets of positions change the results (APR, MaxDD, Profit per Trade).
In the line above "EOD" there is a line "EOD, no NSF" where position sizes ar chosen small enough (2%) so that all orders are filled and there are no NSF positions. There is no random choosing of positions and results are stable between runs. And: Results are much MUCH WORSE! than the "EOD" results.
Then there are backtests with Granular Processing. These result in high precission backtests where the sequence of fills is determined to mirror reality as close as possible. I consider this line as "closest to reality" and the "gold standard" to compare other results against.
These results are also MUCH WORSE than the "EOD" (standard backtest) results.
Finally we have a line called "LOEWE low". These backtest use the LOEWE indicator as a transaction weight.
Comparing these lines we see:
The usual and "normal" backtest is way too optimistic.
And the question arises:
What is going on here?
I’m not going to introduce a bunch of logic in granular processing to try and cope with intraday split and dividend adjustment. This will have to happen at some higher level so the correct intraday is just used by granular processing. Maybe a new finantic data provider extension or extension of BestData that can do this job!
I like your research here. The first thought that comes to my mind is that the AvgPrPer per trade is too low. That makes many systems vulnerable and actually hard to trade..
The difference in the APR between the "no NSF" backtest and the 10% backtest takes place because with the 10% backtest has likely a much higher exposure and the 4% backtest a lower.
I also wonder what happens when you use WealthData for the 35 symbols. Remember WD is adjusting the OHL to a more realistic value by using some mathematical rules to avoid fake high and lows as well getting a real tradable opening price.
I am not familiar with the LOEWE indicator, I am sure you figured out a way to use transaction weight for a limit system.
QUOTE:
The difference in the APR
Yes, of course. APR is proportional to position size, the same for MaxDD. But the ratio of APR and MaxDD (Calmar Ratio) should be (nearly) the same. And more important the average profit per trade in percent (AvgPrPct) should definitely be (roughly) the same!
QUOTE:
I am sure you figured out a way to use transaction weight for a limit system.
Yes.
What is this LOEWE indicator?
The WL help text (Strategy->Strategy Settings->Advanced Strategy Settings->Use Granular Limit/Stop Processing) says:
Granular Processing determines such a weight based on the time of day that a transaction would have been filled based on an analysis of the corresponding intraday data.
But what should we do if there is no intraday data?
After all intraday data is more expensive and often not available for delisted stocks (i.e. many symbols in the WealthData Portfolios).
There is hope!
There is the idea to estimate time of day of a fill based on the [b]difference between opening price and limit price/b] And this is roughly what the LOEWE indicator does.
I did a detailed experiment during the last weeks and it turns out that the best match between LOEWE and Granular Processing happens with the following specs:
For white candles compare the total travelling distance of a single day with the distance between open and limit price.
For black candles compare the total travelling distance of a single day with the distance between the high price and the limit price.
The estimated (minimal) total travelling distance for black candles is:
(high - open) + (high - low) + (close - low)
The estimated (minimal) total travelling distance for white candles is:
(open - low) + (high - low) + (high - close)
Finally the ratio is scaled to result in a range between 0 hours and 6.5 hours.
A comparison between Granular Processing and LOEWE looks like this:
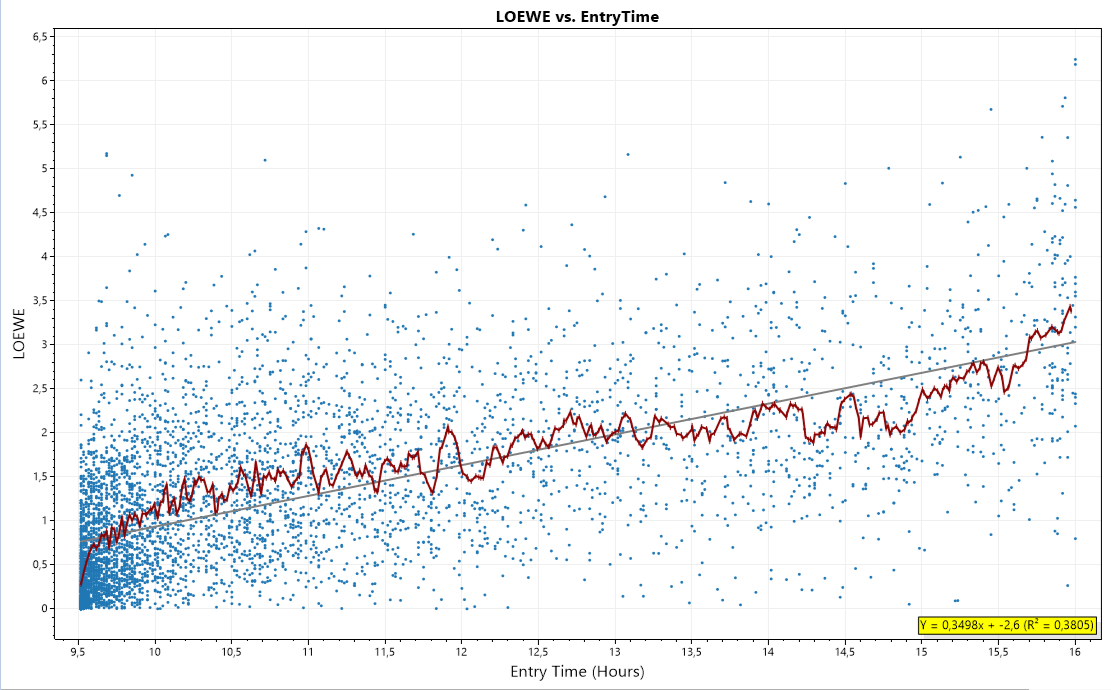
The X-Axis shows time-of-day as determined by Granular Processing.
The Y-Axis shows indicator values of the LOEWE indicator between 0h and 6.5h.
Each blue dot is a trade.
The red line is a centered moving average.
The gray line is a linear regression.
The R2 of the linear regression is 0.38
Result: We do not know what the intraday price moves are. They can be anything. Still show the heuristics used by LOEWE a pretty good correlation.
The LOEWE indicator is part of finantic.Indicators Build 5.
The WL help text (Strategy->Strategy Settings->Advanced Strategy Settings->Use Granular Limit/Stop Processing) says:
QUOTE:
A realistic simulation when backtesting Stop / Limit Strategies require that
higher priorities be assigned to trades that would have been filled earlier chronologically.
Granular Processing determines such a weight based on the time of day that a transaction would have been filled based on an analysis of the corresponding intraday data.
But what should we do if there is no intraday data?
After all intraday data is more expensive and often not available for delisted stocks (i.e. many symbols in the WealthData Portfolios).
There is hope!
There is the idea to estimate time of day of a fill based on the [b]difference between opening price and limit price/b] And this is roughly what the LOEWE indicator does.
I did a detailed experiment during the last weeks and it turns out that the best match between LOEWE and Granular Processing happens with the following specs:
For white candles compare the total travelling distance of a single day with the distance between open and limit price.
For black candles compare the total travelling distance of a single day with the distance between the high price and the limit price.
The estimated (minimal) total travelling distance for black candles is:
(high - open) + (high - low) + (close - low)
The estimated (minimal) total travelling distance for white candles is:
(open - low) + (high - low) + (high - close)
Finally the ratio is scaled to result in a range between 0 hours and 6.5 hours.
A comparison between Granular Processing and LOEWE looks like this:
The X-Axis shows time-of-day as determined by Granular Processing.
The Y-Axis shows indicator values of the LOEWE indicator between 0h and 6.5h.
Each blue dot is a trade.
The red line is a centered moving average.
The gray line is a linear regression.
The R2 of the linear regression is 0.38
Result: We do not know what the intraday price moves are. They can be anything. Still show the heuristics used by LOEWE a pretty good correlation.
The LOEWE indicator is part of finantic.Indicators Build 5.
The LOEWE indicator is designed to be used as a transaction weight for Limit Entry Orders.
The OneNight strategy with LOEWE looks like this:
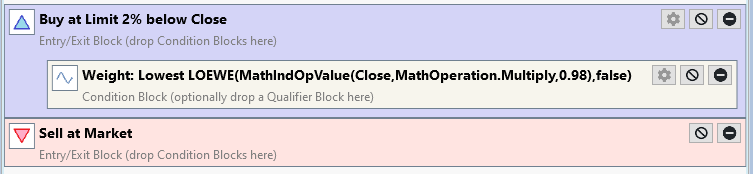
One input of LOEWE is the limit price calculated as an indicator price series.
The OneNight strategy with LOEWE looks like this:
One input of LOEWE is the limit price calculated as an indicator price series.
The table in Post #5 contains two lines for LOEWE (for each strategy)
The LOEWE low line is produced with the strategy as shown in Post #13 (for OneNight) and a very similar modification of Knife Juggler.
The results show that LOEWE works as expected: The results are (much) closer to the (preferred, very exact) Granular Processing results than to the (way too optimistic) EOD results.
This means: Using LOEWE for transaction weight is a rather good method to make backtests of Limit Order Strategies more realistic, especially if no matching intraday data is available.
The LOEWE high line just checks the influence of the LOEWE indicator on the results. The backtest is the same as for "LOEWE low" but with inverted logic: The latest trades are used. (Weight Prioritization: Highest Values)
The results are spectacular!
This shows that the entry time has a (very) high impact on overall results of a Limit Order Strategy.
I hear you saying: "I want the results form the "LOEWE high" line.
Let me explain:
Clarification
The LOEWE indicator - while technically called an indicator - is intended to be used as a transaction-weight only.
It observes prices at the bar after the order is submitted. So it technically peeks in to the future, which is necessary to do its job.
Don't use it as an indicator! Results will be useless in this case.
And yes, of course you want the results from the LOEWE high line. To get closer we need some more understanding...
Very captivating stuff!! 😯
I spent a lot of time developing a knife juggler strategy on small cap stocks and went live with it for about 2 months. I stopped running it after my real life profits were nowhere near what my backtests were saying they should be (I did end up slightly profitable on it).
I ended up purchasing intra-day data from EODHD and ran granular processing and the results of the granular backtest were horrible.
I then tried to develop the system in Nasdaq stocks with wealth data, but I couldn't get a high enough APR in my testing to warrant trading the system.
I ended up purchasing intra-day data from EODHD and ran granular processing and the results of the granular backtest were horrible.
I then tried to develop the system in Nasdaq stocks with wealth data, but I couldn't get a high enough APR in my testing to warrant trading the system.
QUOTE:
the results of the granular backtest were horrible
The Granular Processing is as close to reality as you can get in a backtest.
The results above hint at two things:
* The magic has to do with NSF positions
* The magic has to do with time-of-day of the fill of the entry order
So, after a long journey, I came up with a coded strategy that runs the OneNight strategy with Granular Processing switched on and produces a series of plots.
The strategy is run on the portfolio described in Post #1 (35 symbols, 5 years).
First I created a basket labeled "Days with one entry/fill/trade".
This basket received all days with just one fill along with all the positions of these days.
Then a second basket labeled "Days with two entries"
and so on until Basket#35 with label "Days with 35 entries"
If all these baskets are filled from the backtest results and plotted, it produces the following graph:
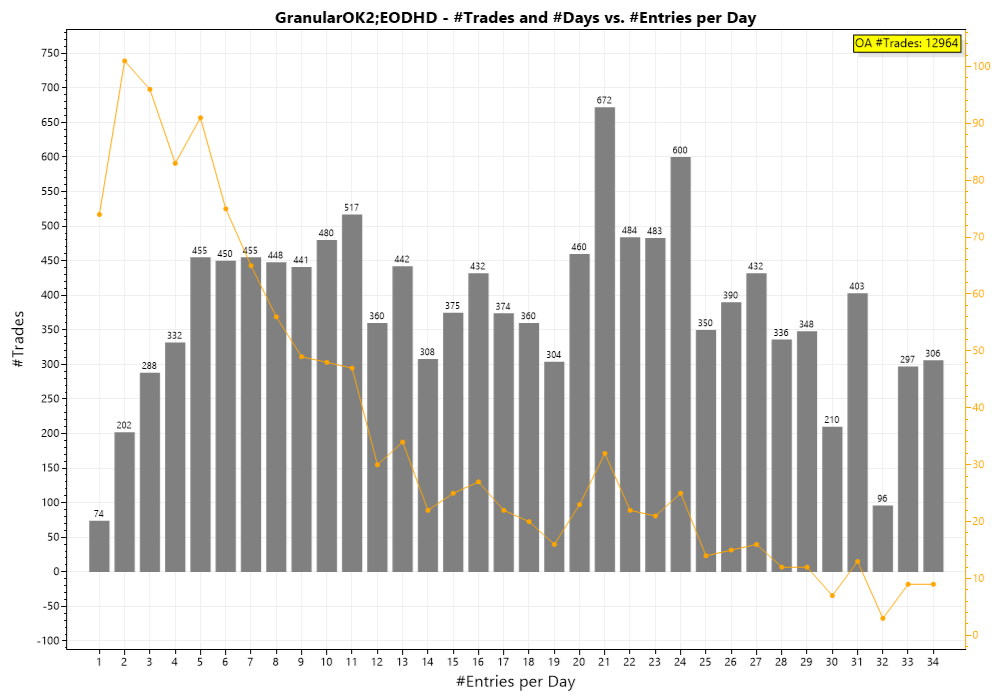
X-Axis shows entries per day, these are our baskets, ordered in ascending order.
Left Y-Axis: Number of trades in a basket
Right Y-Axis: Number of days in a basket
The gray bars show the number of trades in the various baskets, it refers to the left Y-Axis.
The orange line shows the number of days in the various vbaskets, it refers to the left Y-Axis.
We talked about this graphic in the german user group and everybody was surprised, that the number of trades is roughly evenly distrubuted among all baskets.
The explanation lies in the orange line: There are much more days with just a few trades and
a low number of days with many trades (as expected). But the grey bars show number of days times number of trades at such a day.
* The magic has to do with NSF positions
* The magic has to do with time-of-day of the fill of the entry order
So, after a long journey, I came up with a coded strategy that runs the OneNight strategy with Granular Processing switched on and produces a series of plots.
The strategy is run on the portfolio described in Post #1 (35 symbols, 5 years).
First I created a basket labeled "Days with one entry/fill/trade".
This basket received all days with just one fill along with all the positions of these days.
Then a second basket labeled "Days with two entries"
and so on until Basket#35 with label "Days with 35 entries"
If all these baskets are filled from the backtest results and plotted, it produces the following graph:
X-Axis shows entries per day, these are our baskets, ordered in ascending order.
Left Y-Axis: Number of trades in a basket
Right Y-Axis: Number of days in a basket
The gray bars show the number of trades in the various baskets, it refers to the left Y-Axis.
The orange line shows the number of days in the various vbaskets, it refers to the left Y-Axis.
We talked about this graphic in the german user group and everybody was surprised, that the number of trades is roughly evenly distrubuted among all baskets.
The explanation lies in the orange line: There are much more days with just a few trades and
a low number of days with many trades (as expected). But the grey bars show number of days times number of trades at such a day.
The plot in Post #19 is a bit boring. Not much of a surprise there and certainly no magic. So lets go the next step: We calculate the average profit in each basket:

X-Axis: Number of entries per day, as in the plot before
Y-Axis: Average Profit of all trades in a basket.
As clearly visible:
(nearly) All days with less than 18 entries are profitable.
and (nearly) all days with 18 or more entries are losers.
This is a relation as crystal clear as one sees seldom when dealing with trading strategies!
There is a straight conclusion:
Trade only on days with a low number of entries!
And there is a small problem:
You don't know how many entries a day will get before the day is over.
Trade only on days with a low number of entries!
And there is a small problem:
You don't know how many entries a day will get before the day is over.
I took a few more steps on my quest for wisdom.
First I concentrated on the bad days, i.e. days with more than 16 entries.
This time I was interested if the time_of_day of the entry makes a difference.
The following plot shows profit vs. entry time:
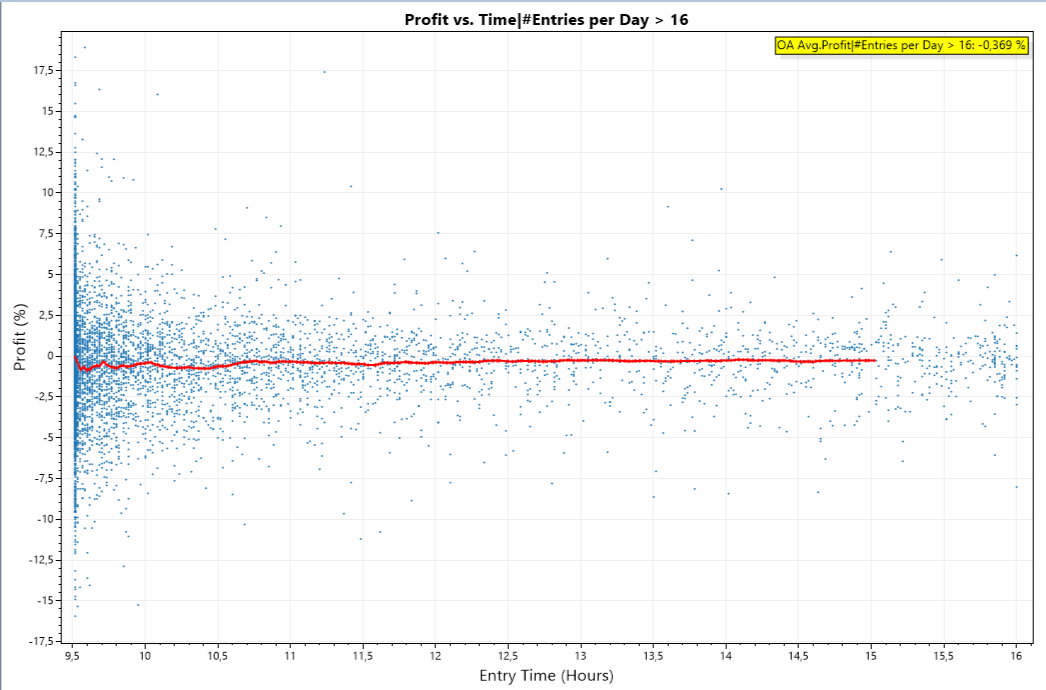
The X-Axis shows time_of_day of an entry expressed in hours, i.e. 9.5 is 9:30h
The Y-Axis shows the profit in percent.
Each blue dot is a single trade.
The red line is a centered moving average of the blue points.
As it is usually the case when trading results are plotted, there is a diffuse cloud of points.
It gets interesting when we zoom in:
(This requires the finantic.InteractiveGraphics extension ;))
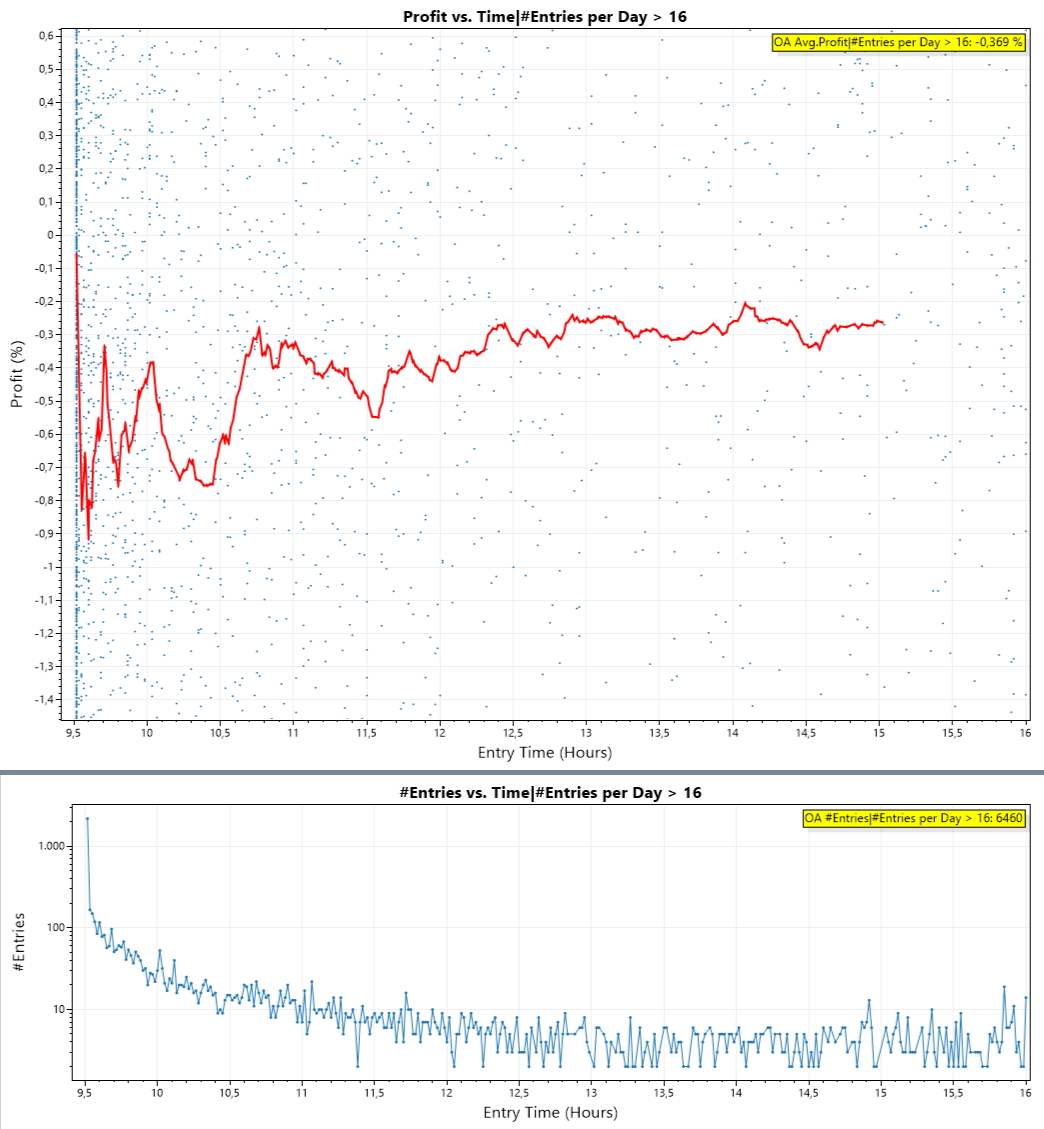
The lower plot shows number of Trades vs. EntryTime.
Here comes the big surprise:
The red line is clearly in negative territory for the first few hours.
The early trades are the bad trades!
We suspected this before, so the surprise is not that relation. For me the surprise was, that this relation is clearly visible in a plot - for the first time!
First I concentrated on the bad days, i.e. days with more than 16 entries.
This time I was interested if the time_of_day of the entry makes a difference.
The following plot shows profit vs. entry time:
The X-Axis shows time_of_day of an entry expressed in hours, i.e. 9.5 is 9:30h
The Y-Axis shows the profit in percent.
Each blue dot is a single trade.
The red line is a centered moving average of the blue points.
As it is usually the case when trading results are plotted, there is a diffuse cloud of points.
It gets interesting when we zoom in:
(This requires the finantic.InteractiveGraphics extension ;))
The lower plot shows number of Trades vs. EntryTime.
Here comes the big surprise:
The red line is clearly in negative territory for the first few hours.
The early trades are the bad trades!
We suspected this before, so the surprise is not that relation. For me the surprise was, that this relation is clearly visible in a plot - for the first time!
As a cross-check I produced the same plots for all days with less than 18 trades:
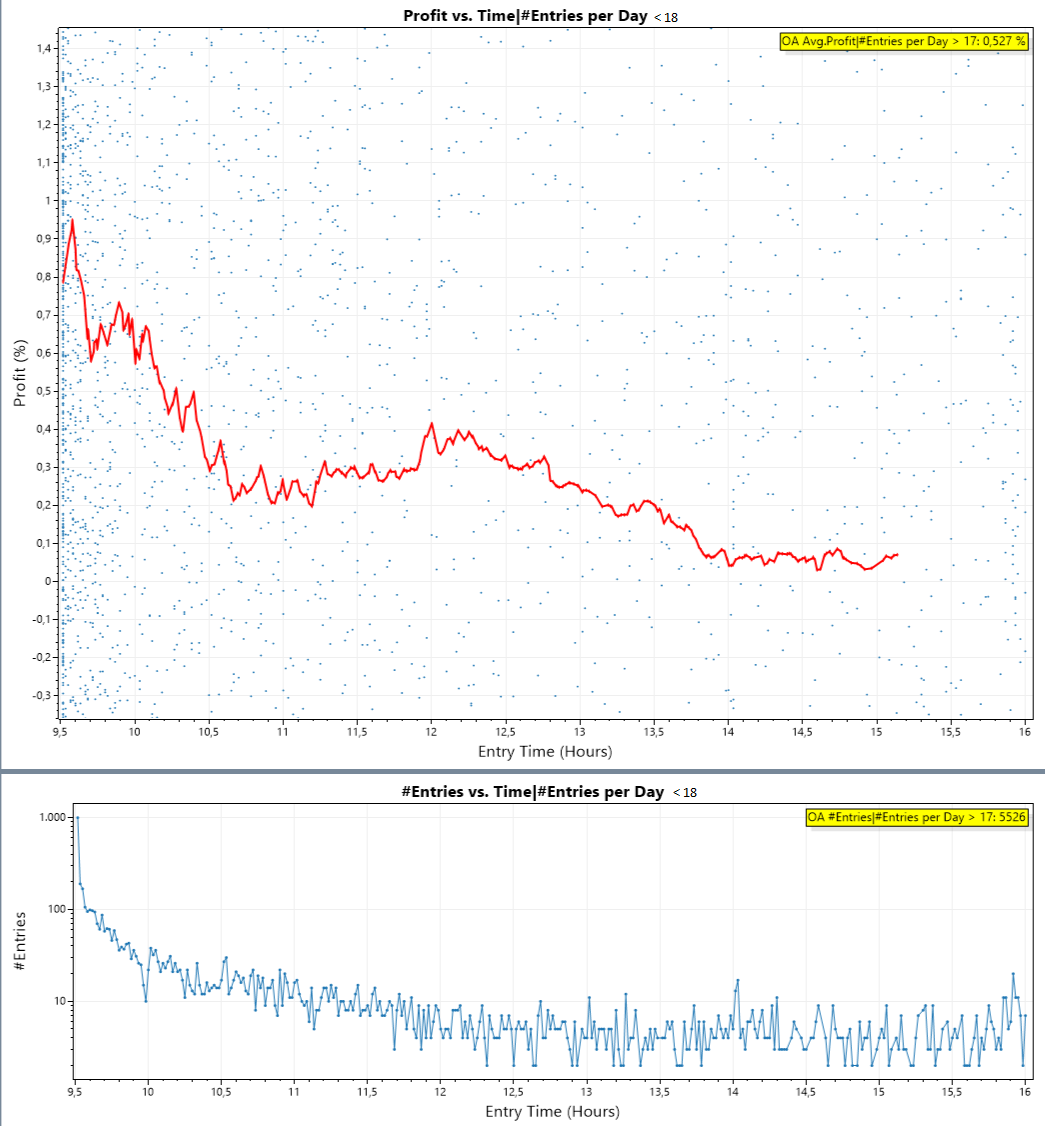
Surprise:
Early trades are the good trades!
Lets contemplate....
Surprise:
Early trades are the good trades!
Lets contemplate....
This is very interesting. Have you run your original code through Monte Carlo with a very high number of runs to verify you can match the granular processing results? If a high enough value is picked, we should match the EOD granular results within reason on one of the runs.
QUOTE:
Have you run your original code through Monte Carlo
No.
Monte Carlo does something different: It takes an existing set of trades and scrambles them. If you use the set of trades without NSF Positions (2% Position size) you'll get quite different results than for the set with NSF positions (10% Positions size).
Probably we can produce some of these results later and see how they compare to Granular Processing. (I am not optimistic here)
Monte Carlo chooses trades from the NSF Positions too.
When I look at the plot in Post #23 I see a highly profitable long trading strategy if:
* Trades are entered before 12:30
* It is a calm day (less than 18 entries on that day)
If these conditions hold there are a lot of trades with an average profit of more than 0.3%
And when I look at the plot in Post #22 I see a highly profitable short trading system, if
* Trades are entered before 12h
* It is a busy day (more than 16 entries per day)
If these condition hold there are a lot of trades with an average profit of more than 0.4%
Well, these are dreams, because the number of fills is not known before the end of the day. To come such a dream closer everything evolves around the question:
Is it possible to predict the number of fills during the next day?
And because the number of fills is highly dependent on volatility:
Is it possible to predict next day's volatility?
In the German User Group We discussed some possibilities:
* it is well known that it is simpler to predict volatility than price movements
* Probably pre-market data can help?
* What if we observe the first 5 minutes of a day?
* Probably VIX can help. (see https://en.wikipedia.org/wiki/VIX)
Ideas anyone?
Suggestions? Experiments? Results?
I think the solution is easy. You need a filter, so that you are not placing orders for all stocks. Like this filter:  .
.
I developed the Internal Bar Strength indicator as an indicator that is close to market action and makes every asset class comparable.
You will like get 50% less orders, less NSFs and higher APP per trade - I think.
.I developed the Internal Bar Strength indicator as an indicator that is close to market action and makes every asset class comparable.
You will like get 50% less orders, less NSFs and higher APP per trade - I think.
Intraday, I have a list for tomorrow but I don't know which ones will be traded and active.
As you said seeing the first 5-15 minutes of the asset can tell about the day's session.
I don't use the VIX because I don't know how to interpret it and I understand that it is no longer effective than before. How do you use it?
Perhaps the tools that options traders use ? I'm thinking of delta, implied volatility. Are there any adept of options trading ?
It would be interesting to see on the Post #22 and Post #23 graph the volatility or volume depending on the time. We will surely find a correlation.
As you said seeing the first 5-15 minutes of the asset can tell about the day's session.
I don't use the VIX because I don't know how to interpret it and I understand that it is no longer effective than before. How do you use it?
QUOTE:
Is it possible to predict next day's volatility?
Perhaps the tools that options traders use ? I'm thinking of delta, implied volatility. Are there any adept of options trading ?
It would be interesting to see on the Post #22 and Post #23 graph the volatility or volume depending on the time. We will surely find a correlation.
QUOTE:
Monte Carlo chooses trades from the NSF Positions too.
So theoretically if enough Monte Carlo runs were made we should find a match or close to the granular processing results. Assuming datasets are the same or very similar. Correct?
On any given day, yes.
But it might take 42 billion runs (just a guess) to create a backtest such that every sequence of trades for every day occurred in chronological order.
Of course, we're really only talking about the days on which NSF trades occurred. Maybe only 1.2 billions runs then.
But it might take 42 billion runs (just a guess) to create a backtest such that every sequence of trades for every day occurred in chronological order.
Of course, we're really only talking about the days on which NSF trades occurred. Maybe only 1.2 billions runs then.
Pardon me for not knowing which belongs on the Y(dependent) vs X(independent) axes here ..., but let's say you plot (#entries per day) vs (the day's VIX). What do you get?
I would assume on days with a high VIX there would be many entries/day and the profit would be small. In other words, high volatility leads to more randomness (and trades) and less profit. Does the data support this hypothesis?
Maybe I need to incorporate the VIX into my trading strategy.
I would assume on days with a high VIX there would be many entries/day and the profit would be small. In other words, high volatility leads to more randomness (and trades) and less profit. Does the data support this hypothesis?
Maybe I need to incorporate the VIX into my trading strategy.
In summary, and in my experience, limit orders below the prior close get hit a lot when the market falls substantially, and the average trade is low. If one can predict a large down day then you will become one of the wealthiest people on earth over time. It is a fantasy.
The optimal situation is a price drop in the morning, then a strong recovery. Again, this is unpredictable.
We just have to roll the dice and work an edge over time.
VIX or EMA filters may help - but in my experience they don't help much.
The optimal situation is a price drop in the morning, then a strong recovery. Again, this is unpredictable.
We just have to roll the dice and work an edge over time.
VIX or EMA filters may help - but in my experience they don't help much.
Your Response
Post
Edit Post
Login is required