When you move from a single strategy to a strategies portfolio, the main question for you is how to group strategies.
I guess, now Meta Strategy backtesting is the most appropriate entity for this. But it doesn’t produce enough info I guess. You can see a Profit Curves (MetaStrategy) and it helps of course, but I would like to see something like correlation matrix – a matrix where you can see the correlation of every strategy with every strategy. That’s main of what I would like to have. Yes, I can see all the strategy backtesting metrics of the portfolio now, but almost no extra info about why.
If trying to extend the idea – maybe something like rolling correlations (chart, or table) so you can see if there are periods where the average correlation of the portfolio grows so you can use this info to make you portfolio more robust.
New instruments for portfolio backtesting
Rename
What you just described, has already existed in WL6 as "Combination Strategy: Correlations":
http://www2.wealth-lab.com/WL5WIKI/PVComboCorrelations.ashx
http://www2.wealth-lab.com/WL5WIKI/PVComboCorrelations.ashx
I don't know about the details of how this one works (the whole idea is more important) - but that's certanly looks like what I mean).
And I would add a single metrics - like average correlation of the portfolio. And std for example - i mean metrics for strategies pairs and metrics for the whole portfolio according to the pairs metrics
We have a task to selectively integrate features of the remaining performance visualizers. "Combination Correlations" is on the list of PVs to convert.
Sneak preview
waaat?)
Had you been working on it by the time I started this topic??
Great!
... What is "Contribution" tab?)
Actually, I'm not really sure about negative correlation beeing better then zero correlation). But maybe it is.
Any plans for adding mean correlation?
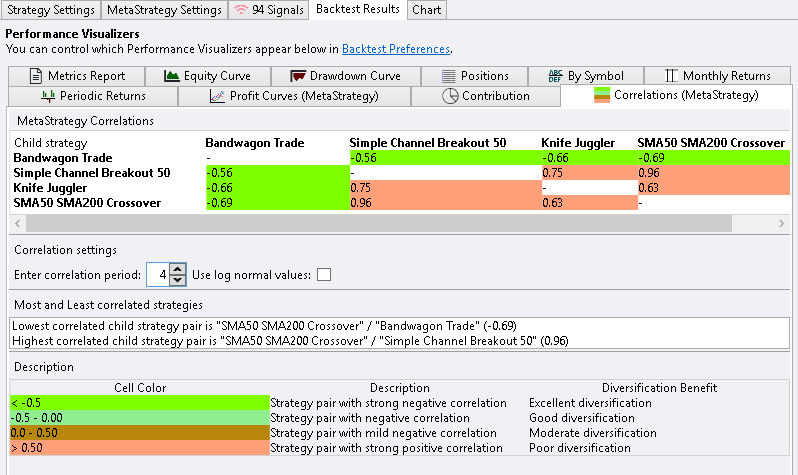
Btw, how does correlation period work? What is this parameter about?
Had you been working on it by the time I started this topic??
Great!
... What is "Contribution" tab?)
Actually, I'm not really sure about negative correlation beeing better then zero correlation). But maybe it is.
Any plans for adding mean correlation?
Btw, how does correlation period work? What is this parameter about?
The correlation period is identical to the lookback period of the Corr (correlation) indicator. So what you see on the screenshot is the 4-day correlation. Typically it's 252 but for the screen capture to remain illustrative I had to apply a less realistic period. You could apply a longer period such as a value closer or equal to the number of bars in the backtest to get the correlations of the entire time span.
Let's review the average correlation idea later if there's a chance.
Contribution is part of PowerPack extension. You can find it documented in the WL7 Help also.
https://www.wealth-lab.com/extension/detail/PowerPack#screenshots
And MetaCorrelations will be included in the PowerPack as well.
Let's review the average correlation idea later if there's a chance.
Contribution is part of PowerPack extension. You can find it documented in the WL7 Help also.
https://www.wealth-lab.com/extension/detail/PowerPack#screenshots
And MetaCorrelations will be included in the PowerPack as well.
Your Response
Post
Edit Post
Login is required