WealthLab 8 Build 23 & Build 24
IQfeed Build 7 & Build 8 - Streaming Charts
All times referenced are EST
NOTE: I have not tested any time frame other than 78 minute bars. I have done some spot
checks several different bar times such as 5 minute 15 minute, 30 and 60 minute
bars and I have not observed the problem described below.
Be forewarned that what follows is lengthy and tedious. If you don't trade on
78 minute bars, it may not be worth your time to read this.
Summary:
1. Refreshing a 78 minute bar during the FIRST 30 minutes of the 78 minute bar
causes an entirely new bar to form.
2. If a 78 minute chart is open for the entire market session, the 78 minute bar
open and close prices will be correct for the day. However, closing the chart
today and then opening it tomorrow before the market session will give incorrect
78 minute bar open and close prices for the prior day. What was correct is
incorrect a day later.
My test process is as follows.
1. Open 78 minute streaming chart before the market opens.
After 9:31 and before 10:00 (9:45 is a good time) draw horizontal lines
at the high, low and open of the current bar. Refresh (click the "lightning"
button at the upper left of the chart) the 78 minute chart.
The current open bar will disappear and a new bar will start at the next tick
after the refresh. The high, low and open of the new bar will be different
than on the bar prior to the refresh. However one of the high, low and
open prices on the bar prior to the refresh may be the same as on the new bar
if the current price at the time of refresh matched one of the old high, low or
open prices.
Note: If you do the refresh after the first 30 minute period of each 78 minute
bar, you will not see what I describe above.
2. a. Open a WealthLab workspace PRIOR to the market open. Open a 78 minute
and one minute streaming chart in the work space. Enter the same symbol in
each chart. Save the workspace. Leave the workspace open from before the
market open until after the market close. Do not close the workspace until after
performing step b below.
b. After the market close compare the open and close prices for each of the
current day 78 minute bars to the prices on the 1 minute chart. For example the
second 78 minute bar opens at 10:49 and closes at 12:06. The prices will all
agree provided you did not refresh any of the charts or close and re-open the
workspace.
c. Close the workspace and do not reopen the workspace until tomorrow.
Open the workspace tomorrow prior to the market open.
d. Perform the same test on all the 78 minute bars for yesterday's date as in
step b above. The first 78 minute bar prices might, or might not, agree with the
prices on the one minute chart at the correct open and close times for the first
78 minute bar. The close of the last 78 minute bar will agree on both charts.
The other open and close prices on the other 78 minute bars will not agree on
both charts. However, the open and close prices at a 30 minute offset to the
right on the one minute chart will EXACTLY agree with the open and close
prices on the 78 minute chart.
Note: the open and close prices might be CLOSE on both charts at the correct
open and close times on the one minute chart, but I almost always get an
EXACT price match at the 30 minute offset. My impression of what I have
observed is that the EXACT price match happens greater than 95% of the
time. Occasionally, (maybe rarely) I don't get the price match at the offset
or at the correct times. This is quite infrequent, but I have observed it and I
haven't been able to see any common cause.
e. The "open the workspace before the market open", "close the workspace
after the market close" and "re-open the workspace tomorrow" PATTERN will lead
to more and more incorrect 78 minute bar data in the historical data. Since the
chart of 78 minute bars available after running a back test agrees with a 78
minute chart created with the chart tool, I assume that the data used in the
back test is the same as the data used to create a chart with the chart tool
and is therefore incorrect. This incorrect data will lead to incorrect optimization
and back test results.
My normal workflow follows the PATTERN with a data update at 9:00 EST.
I enter trades manually with my broker using the what I see on the streaming
charts.
Rename
We've been through this before (https://www.wealth-lab.com/Discussion/Unexpected-ending-time-for-first-bar-of-day-on-78-minute-time-frame-IQFeed-8706), but you didn't say if you have the IQFeed Provider's Regular Session Open option enabled or not.
Somewhere in point d. you compared bars built from streaming data (which all agreed as I recall) and then bars from IQFeed historical - these will depend on the RSO setting, which I can guess you have disabled because you're seeing the 30 minute offset. Correct?
Re: e.
If you have bad data, refresh it from the Provider. If you've toggled the RSO option, you should refresh data for any interval that doesn't have bars that end on both the :00 hour and :30 minute marks.
DATA Manager: Regular Session Only is checked, and has been since our discussion in the post you referenced. Yes, all the 78 minute bars show the times as 10:48, 12:06, 13:24, 14:42, 16:00 as shown in the referenced post.
Okay then. I'll see what I can discover.
I have included an image of what I am seeing. I opened a 78 minute chart for ABBV on 12-12 before the market open and closed the chart after the market close. This image is from today, 12-13, when I opened the chart before the market open.
The 78 minute chart is on the left, and a 1 minute chart is on the right.
The bar of interest is the 4th 78 minute bar. I have marked the open and close prices with a horizontal green line.
I have also drawn a green horizontal line on the 1 minute chart at the open and close prices shown for the 4th 78 minute bar.
on the 1 minute chart the vertical blue lines are at the proper open time of 1:25 and the proper close time of 2:42. the vertical green lines on the 1 minute chart are at a 30 minute offset from the proper open and close times. dashed lines are for the open, and solid lines are for the close. it is easy to see that the 78 minute bar close price occurs at the 30 minute offset (solid green lines) relative to the price at the correct close time (solid blue lines).
Hope this helps.
I don't see the chart. I posted it as a*.png file. do I need to use *.jpeg?
No, use PNG. You probably hit the Post button too soon, not letting the website insert the link into the message text.
OK I'll post the chart again.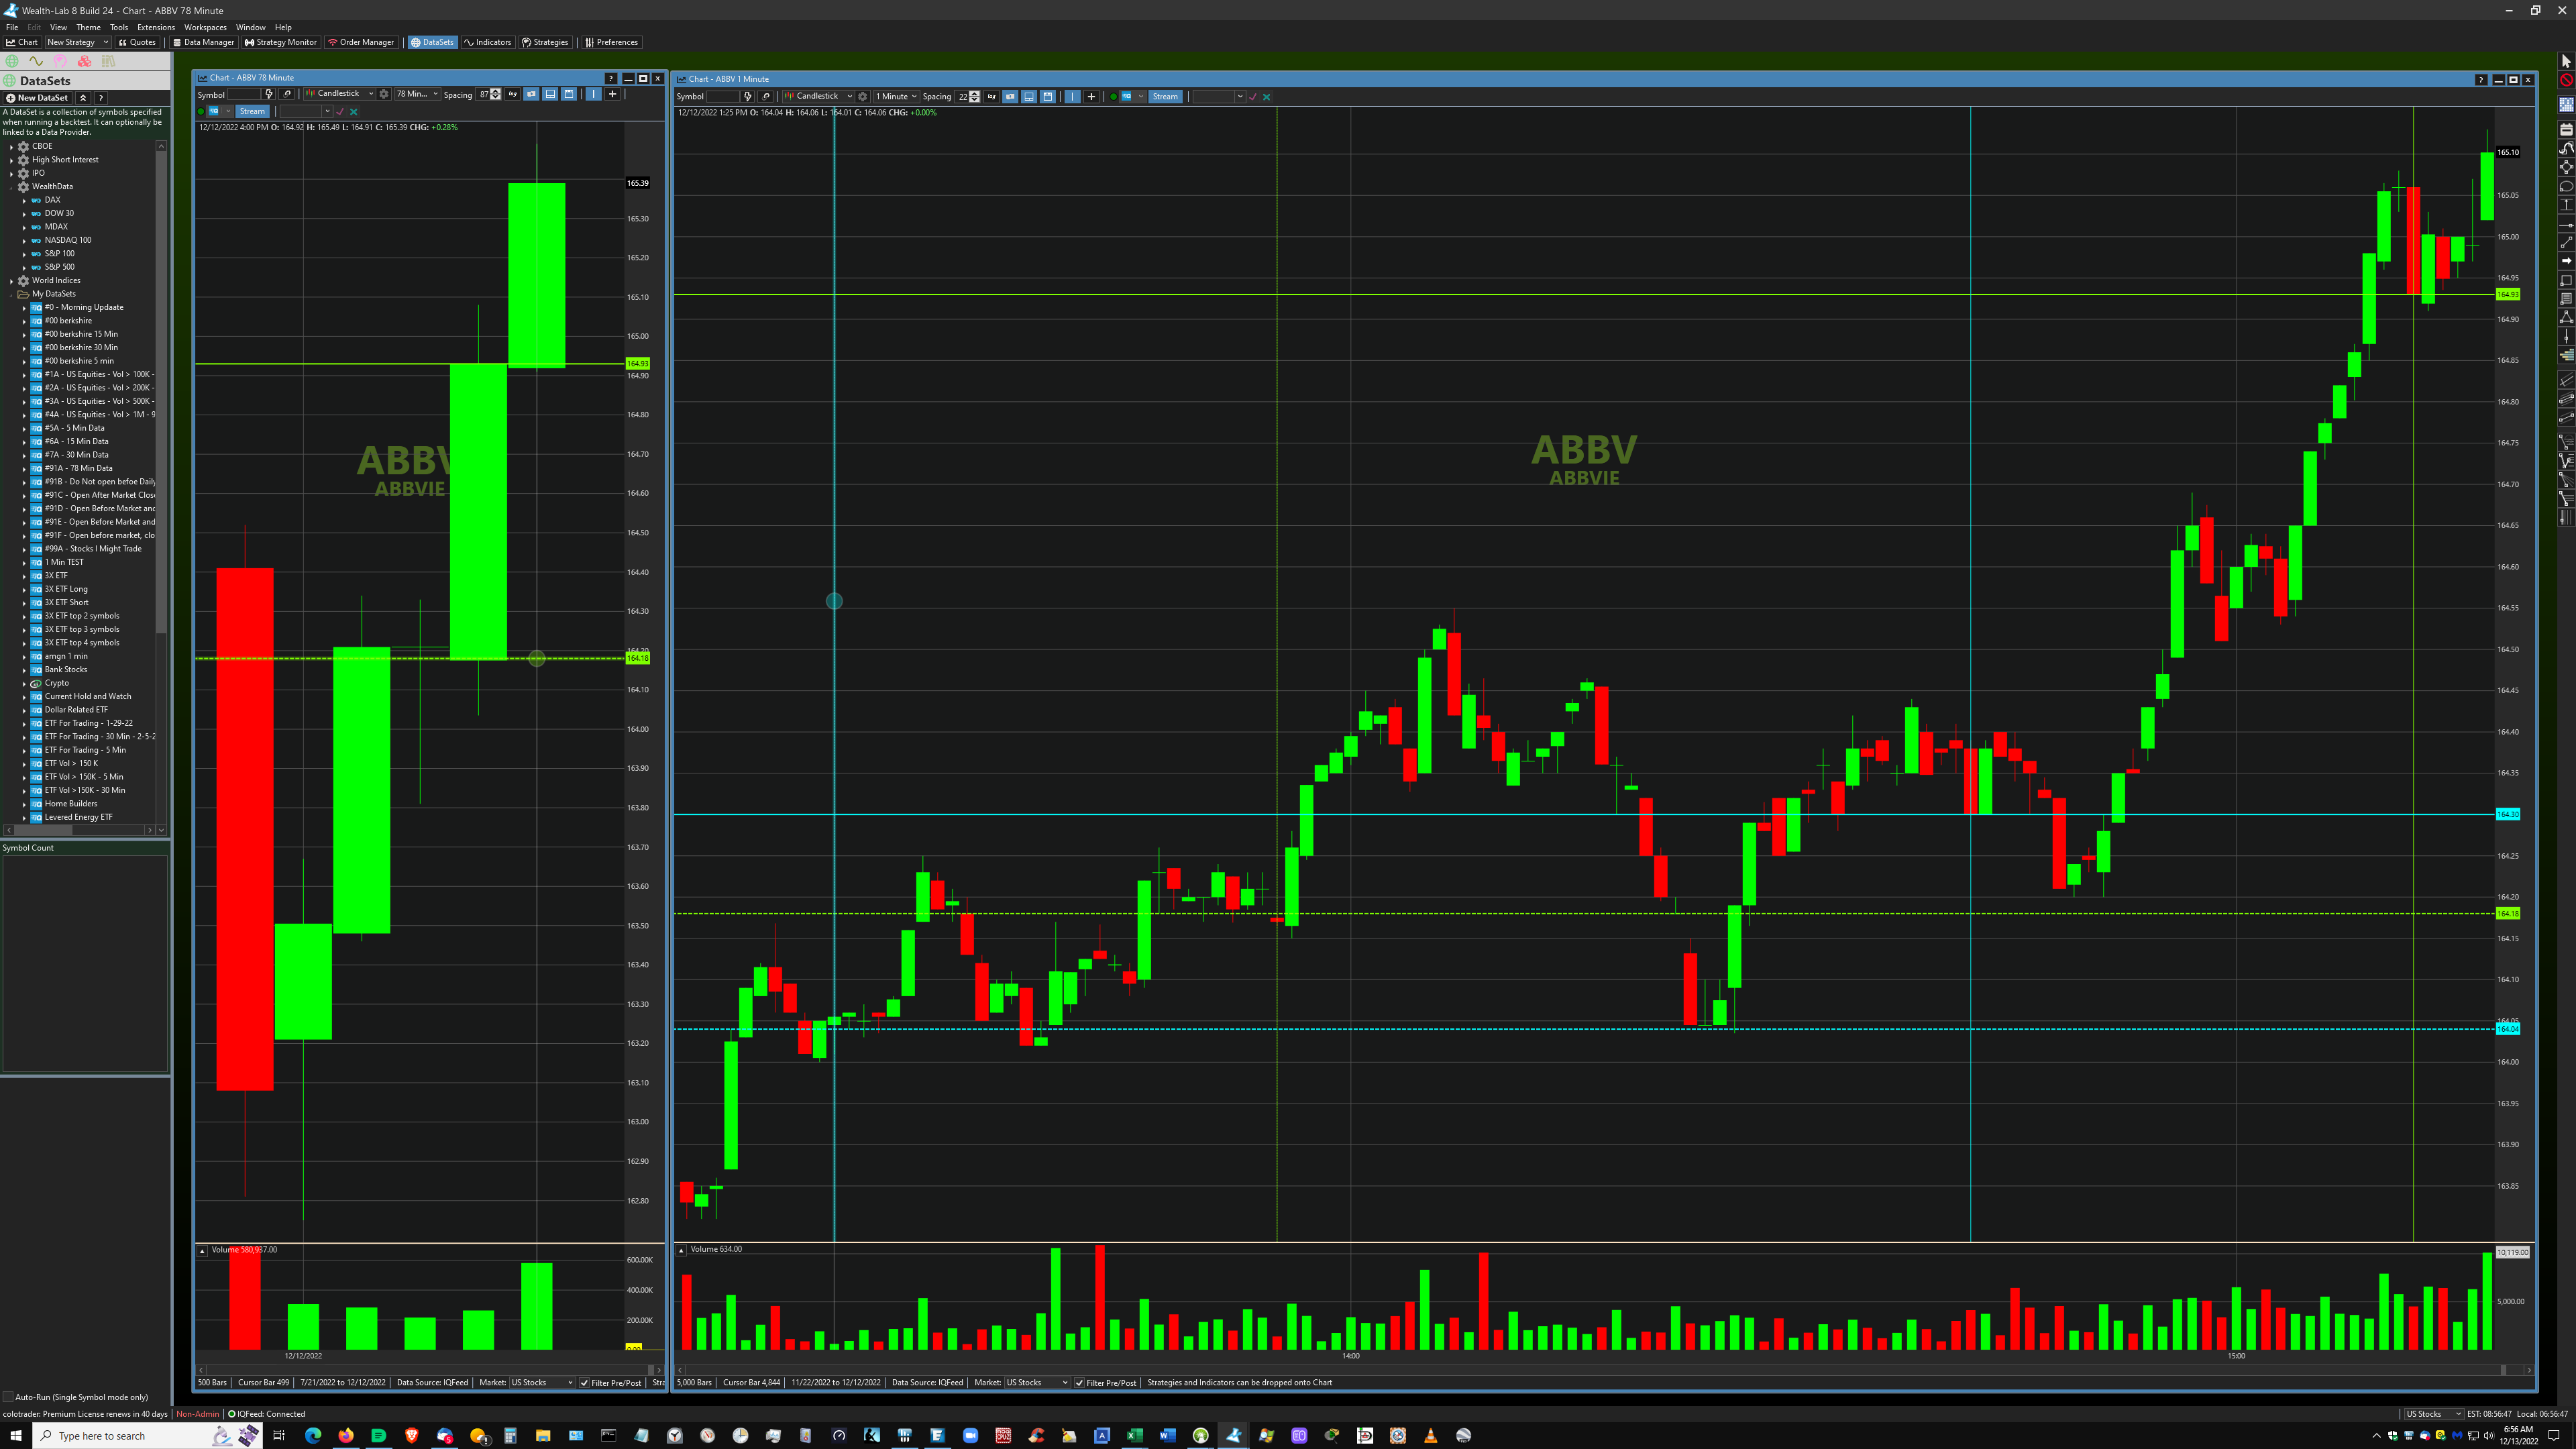
I'm looking into it, and from what I'm seeing, like you, I can't tell where IQFeed is coming up with the data. I'm going ask IQFeed support about this, and if we can't get a resolution, we'll just disable requests for bar intervals > 30 minutes and do the scaling ourselves from lower timeframes.
thanks
Working with DTN Gary on this, but I think we're going to have to switch to our own scaling from 1-minute bars...
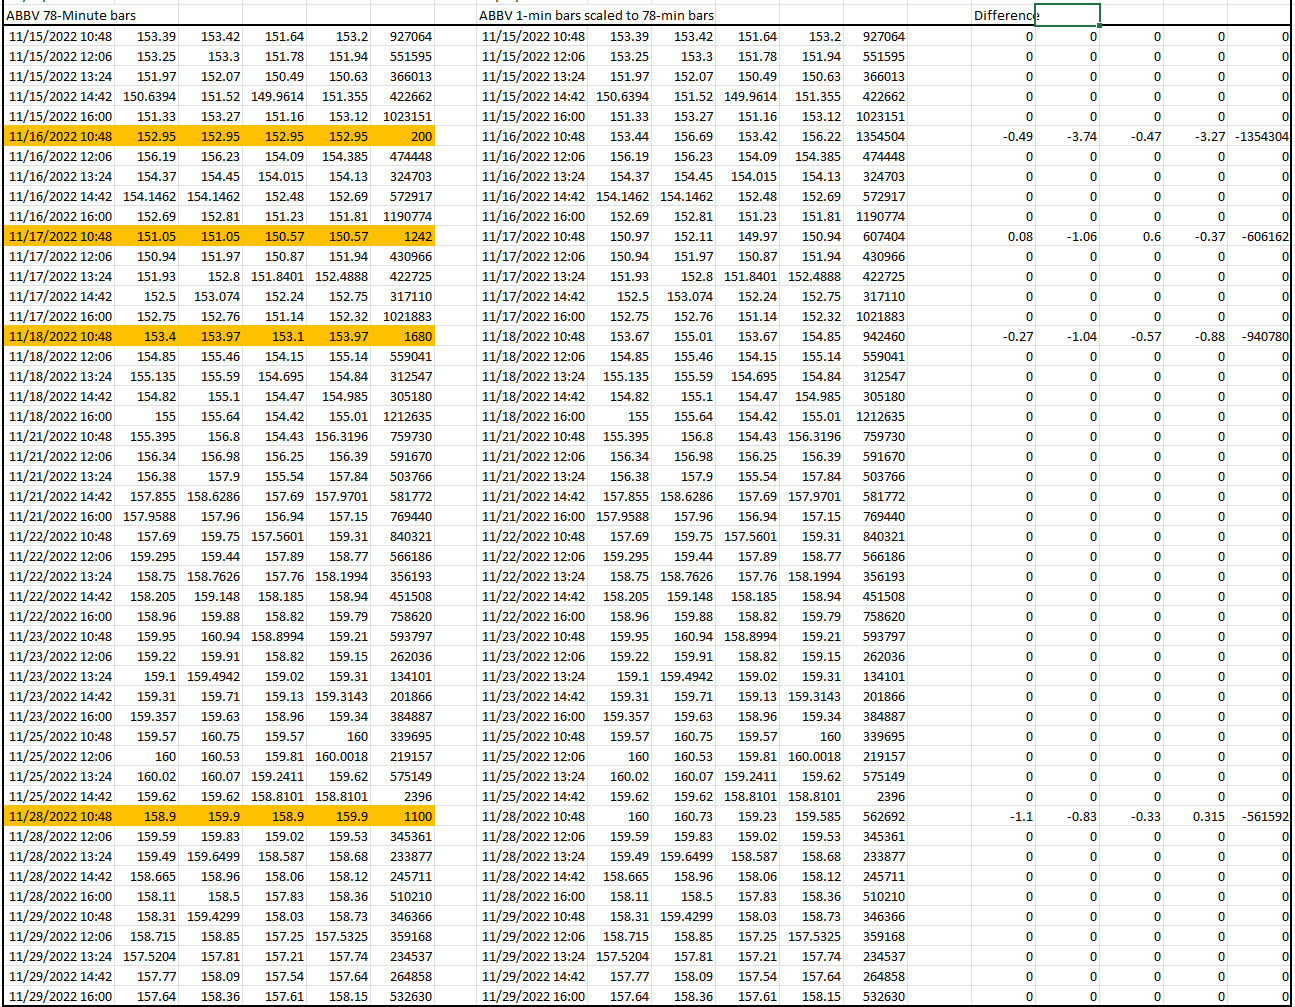
I rescaled IQFeed 1-minute data and compared the result to the 78-minute bars returned from IQFeed. As it turns out, the main problem is that the data for the current day only is not aligned or compressed correctly. Furthermore, for previous days there are occasional - but significant - errors on [usually] the 1048 bar.
In the case on 12/9 10:48, IQFeed's 78-minute bar returned the data from the 1-minute premarket bar ending 0930. That entire 78-minute period was essentially excluded!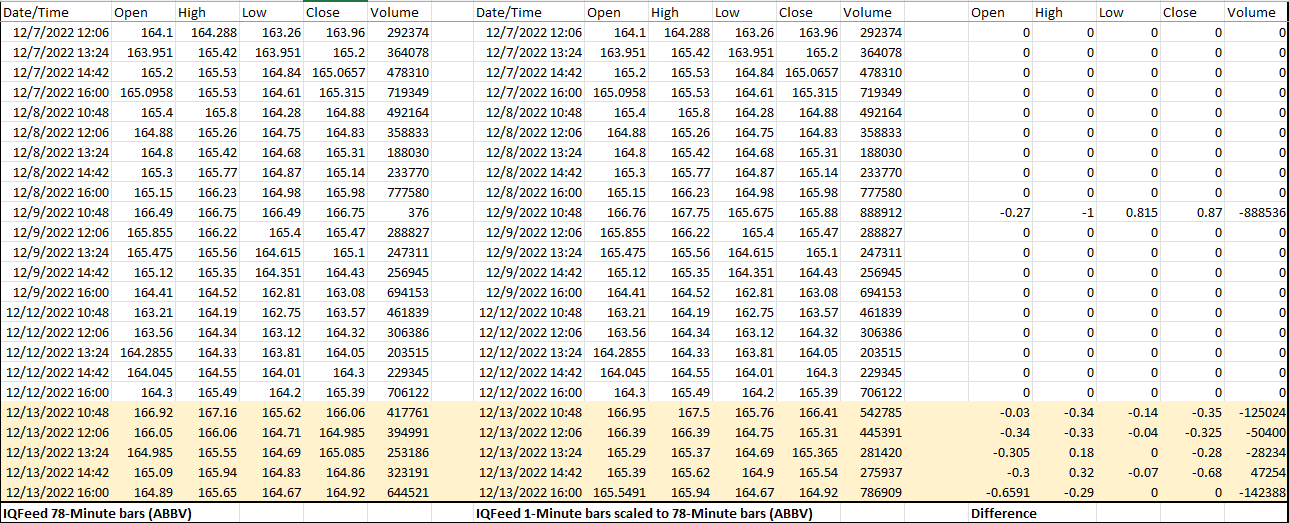
Hopefully IQFeed added that to whatever bug tracking system they use!
CODE:
ABBV 78 Minute bars returned yesterday (12/13/2022) OHLCV
12/13/2022 10:48 166.92 167.16 165.62 166.06 417761
12/13/2022 12:06 166.05 166.06 164.71 164.985 394991
12/13/2022 13:24 164.985 165.55 164.69 165.085 253186
12/13/2022 14:42 165.09 165.94 164.83 164.86 323191
12/13/2022 16:00 164.89 165.65 164.67 164.92 644521

ABBV 78 Minute bars returned today (12/14/2022) OHLCV
12/13/2022 10:48 166.95 167.5 165.76 166.41 542785
12/13/2022 12:06 166.39 166.39 164.75 165.31 445391
12/13/2022 13:24 165.29 165.37 164.69 165.365 281420
12/13/2022 14:42 165.39 165.62 164.9 165.54 275937
12/13/2022 16:00 165.5491 165.94 164.67 164.92 786909
It's only 2AM EST, but the data returned from IQFeed for the same request has changed (and is now correct).
The bad news is that historically, often, the data for the first bar is wrong as I showed previously, and again here -
Let's see if IQFeed picks up the ball. If they can't react quickly, we'll do the scaling ourselves.
I don't know if this is useful or just a distraction, but I thought I should mention it.
Yesterday I had a chart of ABBV open from before the market open to after the market close. I marked the open price and close price for the 14:42 bar with a horizontal line at each price. I then checked the two prices against a 78 minute chart in Fidelity Active Trader Pro. The open and close for that bar were identical in the Wealthlab and ATP charts. I closed the Wealthlab workspace containing the ABBV chart. and reopened the workspace. Now and the open and close prices for that bar were different than what I marked. The prices before I closed the chart agree with what you show for 1 minute, and the prices after the reopen agree with what you show for 78 minute.
I am referencing your information in your 9:56 post.
Yes, that's because while streaming, WealthLab builds the bars, so they are correct. When you open the Workspace, we make a history request since the last history request that was cached on disk. The bars returned for "today" are the bad ones.
Now, if you completely "Reload Chart Data from Provider", you'll see that even yesterday's bars are correct (now).
Today's 78-min bar history is a different story - that's the IQFeed bug.
Now, if you completely "Reload Chart Data from Provider", you'll see that even yesterday's bars are correct (now).
Today's 78-min bar history is a different story - that's the IQFeed bug.
Thanks,
At the moment, IQFeed dev support isn't being responsive, so we went ahead and pushed out our fix in IQFeed Build 9 for the odd intervals -
https://www.wealth-lab.com/extension/detail/IQFeed#changeLog
Note:
If you don't use the RSO option for one of the intended purposes (reduced data file size and opening price correction), you will need to use WealthLab's market filter to get the correct scaling for the odd intervals - so that the data starts at 0930.
Thanks.
I'm still seeing the same problem as before. RSO is Checked ,PowerPack 16, IQFeed 9.
I deleted the 78 minute folder from the IQFeed folder. and updated the data last night at 9:00 EST
I have attached an image of what I am seeing. I marked the open of Ford with a dotted green Line, the High with a solid green line, and the low with a solid blue line.
The Lines on the 78 minute chart are drawn to be in agreement with the open, high and low shown on the 1 minute chart.
I opened the 78 minute chart at approximately 9:52 EST. The 78 Minute chart is on the left and the 1 minuted chart is on the right.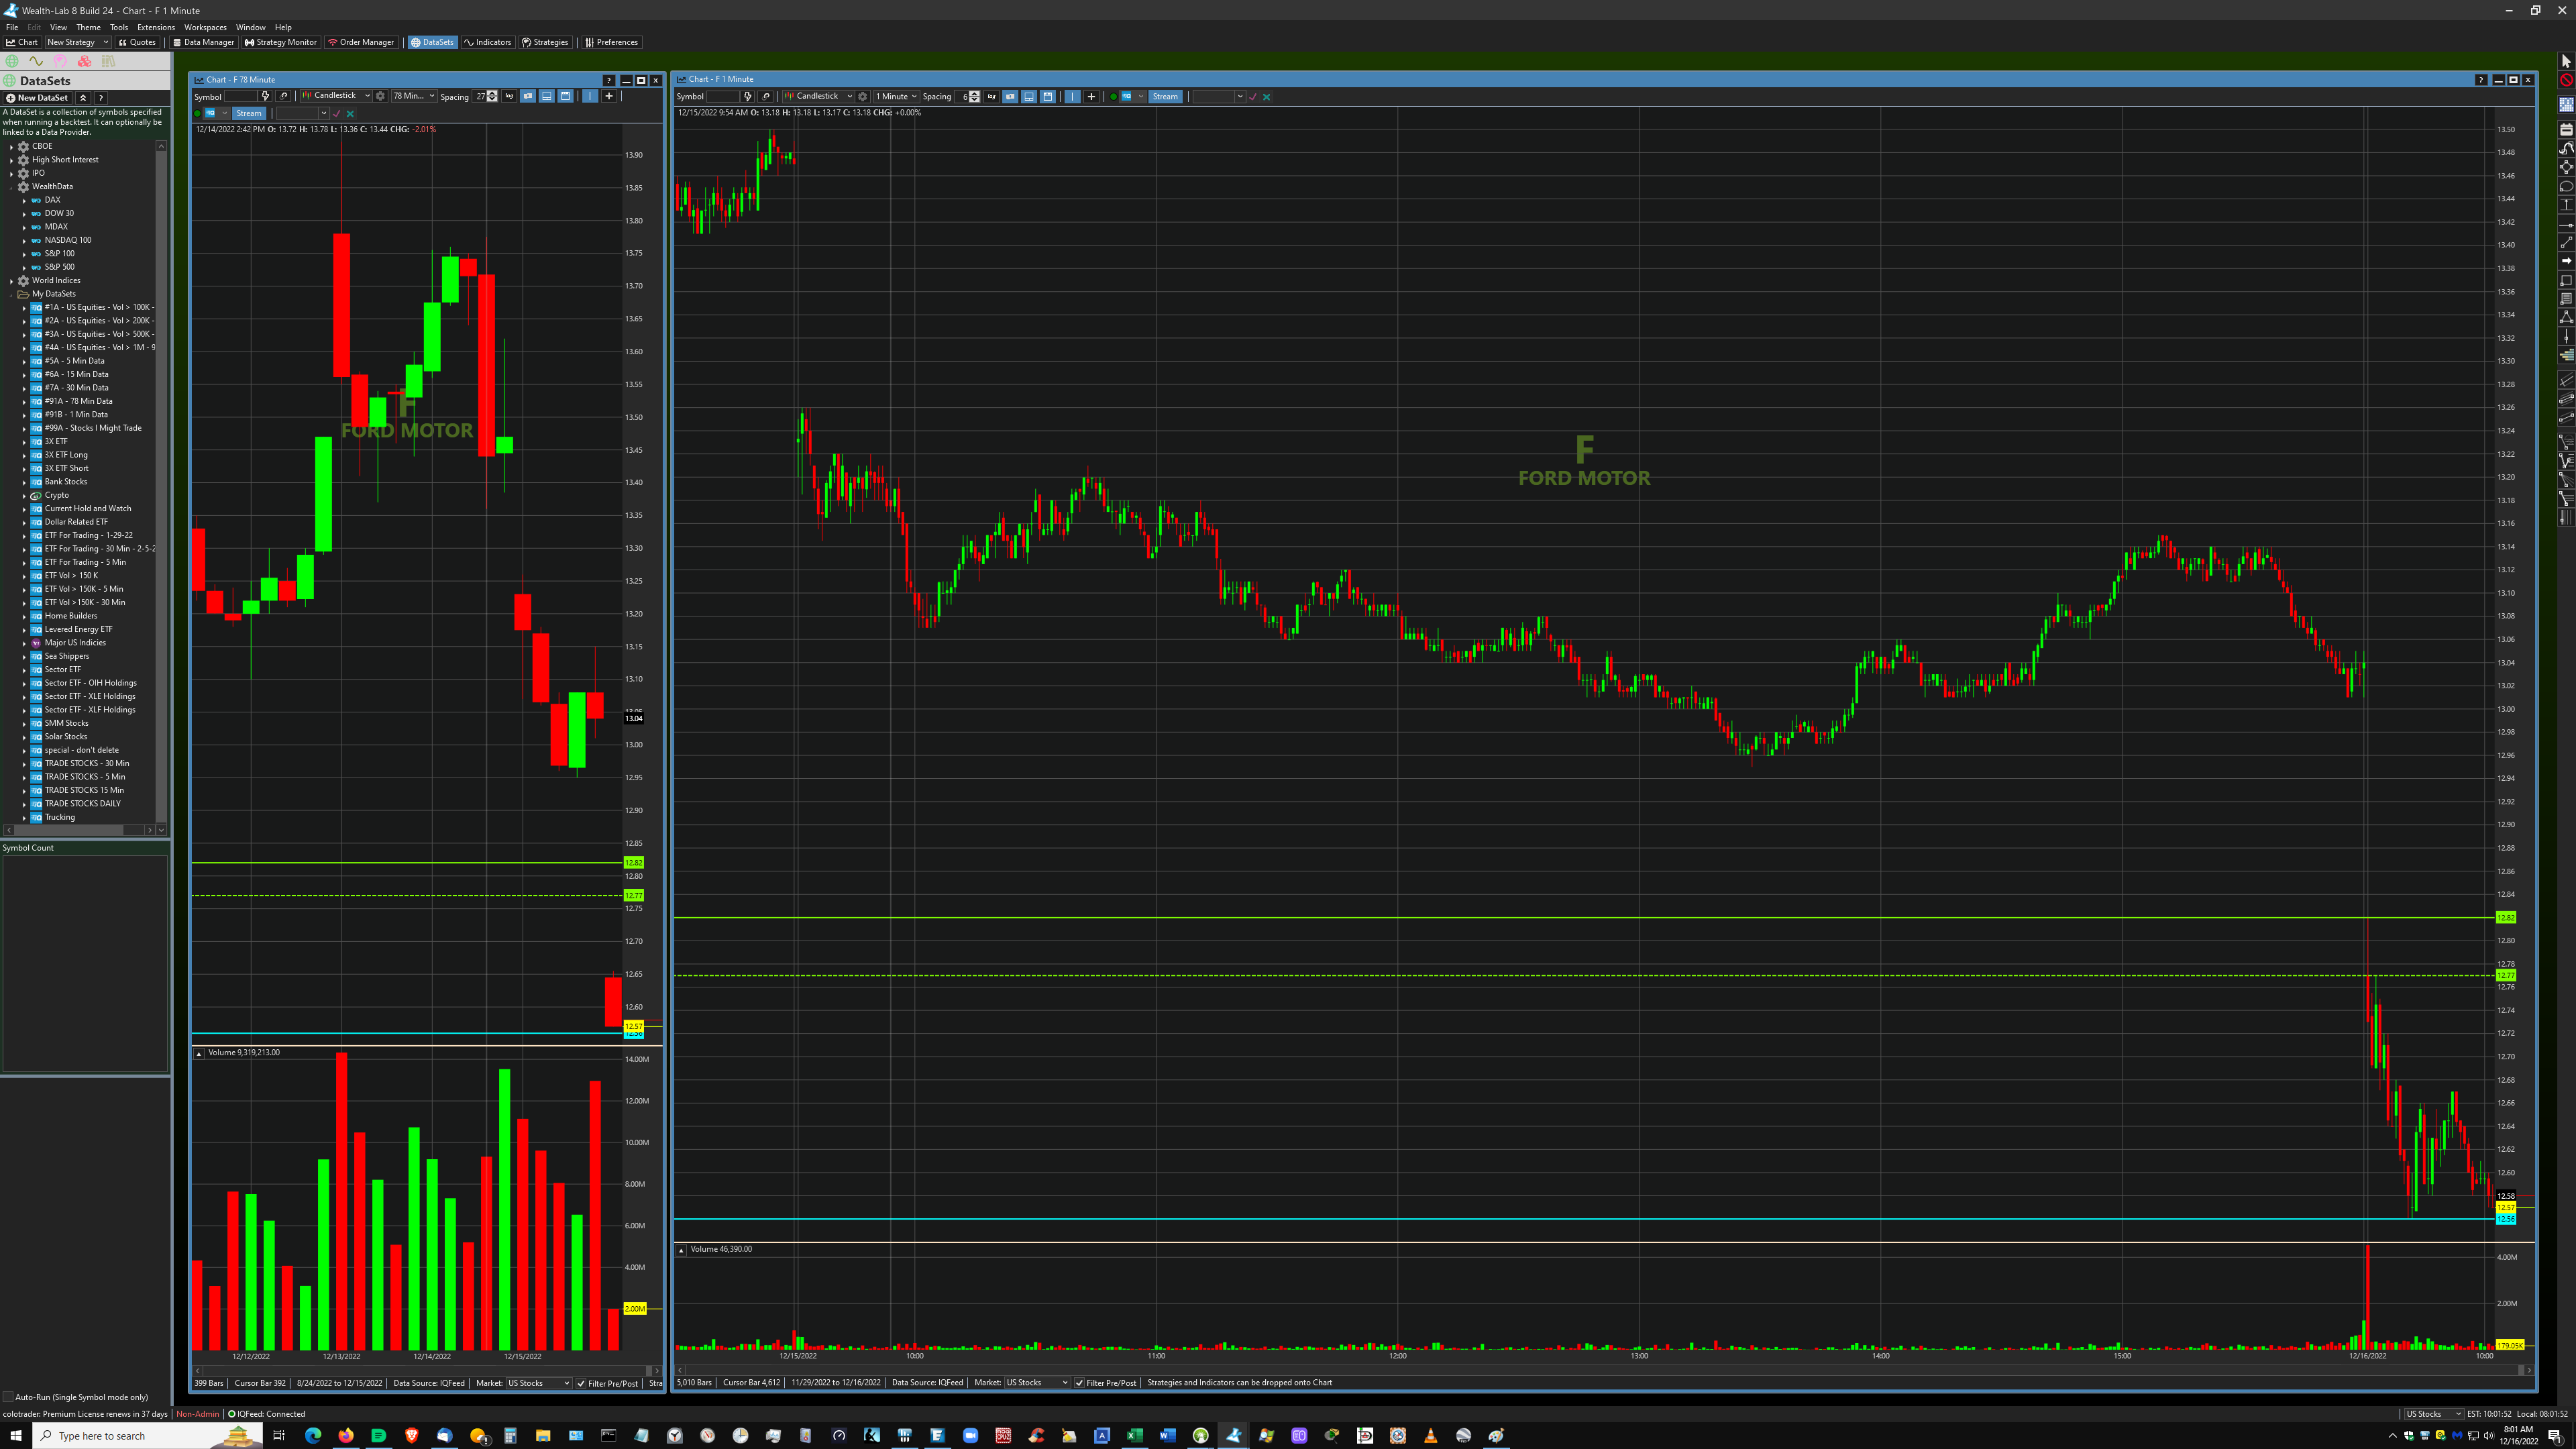
I'll have to see why, but if you uncheck the filter, it will be correct.
Edit -
Hmm, there seems to be an issue with the timestamp of the partial bar - without the Filter it ends at 10:24, as if the bars were referenced to midnight (this make sense).
Looking into what's going on with the Filter + RSO
Edit -
Hmm, there seems to be an issue with the timestamp of the partial bar - without the Filter it ends at 10:24, as if the bars were referenced to midnight (this make sense).
Looking into what's going on with the Filter + RSO
time: 10:58
I unchecked the filter on the Ford 78 minute chart and left RSO checked. The first bar (10:48) changed and now the open, high, low, and close agree with 78 minute chart in Fidelity ATP. I wasn't watching close enough to be certain, but I think the current (12:06) bar did the "disappearing" act and started over.
edit:
I just checked the 78 minute 12:06 bar high and low and they agree with the the high and low on the 1 minute chart starting with the 10:49 bar.
edit #2.
I did a refresh of the chart at 11:12 and the bar disappeared and started over. the high and low no longer agree with the 1 minute chart. I'll wait until after 11:18 and do another refresh and see what happens.
edit # 3
I refreshed the 78 minute chart at 11:25. nothing changed on the bar, and the 78 minute bar high and low did not agree with the 1 Minute chart starting at the 10:49 bar.
I'll wait to see what you find out, and hopefully the above commentary is not just noise.
It seems that WealthLab still sends the 78-minute request even though we made the provider respond that it doesn't support it. We need to find the disconnect there.
thanks
Your Response
Post
Edit Post
Login is required