How can I use the building blocks to show that an entry can only be made when the indicator has made a new high? The entry may take place until the entry makes a new low. It is only allowed again after a new high. In the following image I have shown the permitted (green) and prohibited (red) areas.
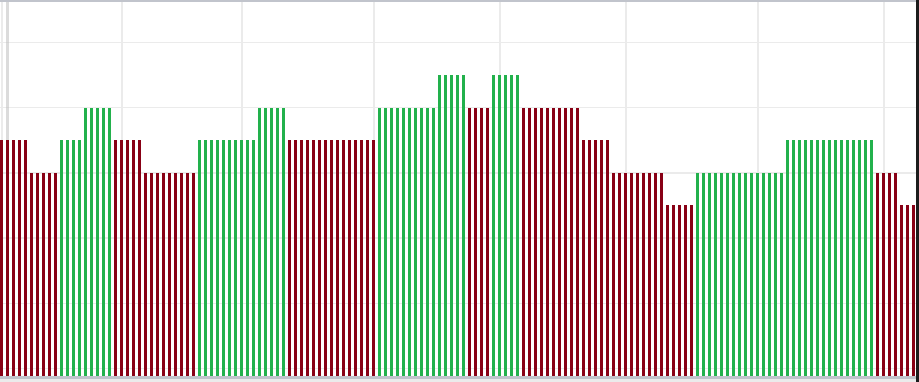
Each bar represents an indicator value. I was not able to implement this using NewLow/NewHigh, as I always need a lookback period for this. However, the lookback period does not allow me to define a condition that makes this possible. Unfortunately, I have not yet been able to think of a way to do this using the building blocks. Is this somehow possible with the building blocks or is it only possible via programming?
Each bar represents an indicator value. I was not able to implement this using NewLow/NewHigh, as I always need a lookback period for this. However, the lookback period does not allow me to define a condition that makes this possible. Unfortunately, I have not yet been able to think of a way to do this using the building blocks. Is this somehow possible with the building blocks or is it only possible via programming?
Rename
Just use Indicator Turns [Up].
That's a trigger condition that will get you back for those red-to-green transitions.
That's a trigger condition that will get you back for those red-to-green transitions.
I'm not certain that a TurnDown followed by TurnUp is enough for this because a turn up doesn't qualify as a new high automatically. Consider the indicator becoming green at a lower value than it had been prior to have declined, turning down. That's just what we're seeing in the right part of the screenshot in Post #0.
Many thanks for the answers. Unfortunately, it does not work with "Indicator Turns Up", as this only applies to the bar that goes up. If the next indicator bar is the same height, the "Indicator Turns Up" condition is no longer fulfilled. The indicator should be used as a filter and only allow entries in the areas marked in green. Does anyone have any other ideas?
Bars that are displayed at the same height are also identical in value.
Bars that are displayed at the same height are also identical in value.
The condition I would like to present is as follows. The current bar must be equal to or higher than the previous bar. In addition, there must be a previous bar (bar X) that was higher than the previous one. There must not be a lower bar between the current bar and bar X.
That's why I said it would work for the red-to-green transitions. If you need an "enabler" for the entire green period, you'll need create a custom indicator that can operate on that TimeSeries.
This is a mock-up (not IndicatorBase code) to show you the calculation required. This "indicator" returns 1 for the "green" sections and 0 for the "red".
This is a mock-up (not IndicatorBase code) to show you the calculation required. This "indicator" returns 1 for the "green" sections and 0 for the "red".
CODE:
      TimeSeries Enabled(TimeSeries source)
      {
         TimeSeries ts = new TimeSeries(source.DateTimes, 0);
         double val = 0;
         for (int n = 1; n < ts.Count; n++)
         {
            if (source.TurnsUp(n))
               val = 1;
            if (source.TurnsDown(n))
               val = 0;

            ts[n] = val;
         }
         return ts;
      }
Thank you very much Cone. I'll give it a try and hope that I can somehow manage it. I forgot to mention it. It is the StrongTrend Indicator. Is it customizable in this way?
Sure. "Enabled" takes any TimeSeries, and any Indicator is a TimeSeries.
But you need to make "Enabled" a custom Indicator and then you can use it on another indicator in Blocks using IndOnInd.

But you need to make "Enabled" a custom Indicator and then you can use it on another indicator in Blocks using IndOnInd.
That looks exactly what I could use. How can I build the indicator? Is there a short instruction somewhere?
Here ya go - CountTurn indicator will count the number of bars since the center bar of turn up or down (I extended Cone's idea.)
Please see the code comments for more info.
I find this handy for analysis because it makes it easy to see the turning points in the graph.
To use this please refer to the WL8 help for how to create an indicator.
Please see the code comments for more info.
I find this handy for analysis because it makes it easy to see the turning points in the graph.
To use this please refer to the WL8 help for how to create an indicator.
CODE:
using System;
using WealthLab.Core;
using WealthLab.Indicators;

namespace WLUtility.Indicators
{
    /// <summary>
    ///     Counts the number of bars since the center bar of a turn up or down.
    ///     There are three bars in a turn up or down. The center bar is the one that is between the two bars on either side of
    ///     it.
    ///     Positive values are since the turn up and negative values are since the turn down.
    /// </summary>
    public class CountTurn : IndicatorBase
    {
        public CountTurn()
        {
            // needed for WL8
        }

        public CountTurn(TimeSeries source)
        {
            Parameters[0].Value = source;
            Populate();
        }

        public override string Name => "Count Turn";
        public override string Abbreviation => "CountTurn";
        public override string HelpDescription => "Counts the number of bars since the center bar of a turn up or down";
        public override string PaneTag => "CountTurn";

        public override PlotStyle DefaultPlotStyle => PlotStyle.HistogramTwoColor;
        public override WLColor DefaultColor => WLColor.Green;
        public override bool IsCalculationLengthy => false;
        private TimeSeries Source => Parameters[0].AsTimeSeries;

        protected override void GenerateParameters()
        {
            AddParameter("Source", ParameterType.TimeSeries, PriceComponent.Close);
        }

        public override void Populate()
        {
            // speed things up a tad
            var source = Source;
            DateTimes = source.DateTimes;

            // we need 3 bars for a turn, hence the +2
            var min = Math.Min(source.FirstValidIndex + 2, source.Count);
            for (var idx = 0; idx < min; idx++)
            {
                Values[idx] = 0;
            }

            var count = 0;
            for (var idx = source.FirstValidIndex + 2; idx < source.Count; idx++)
            {
                if (source.TurnsUp(idx))
                {
                    count = 1;
                }
                else if (source.TurnsDown(idx))
                {
                    count = -1;
                }
                else if (count > 0)
                {
                    count++;
                }
                else if (count < 0)
                {
                    count--;
                }

                Values[idx] = count;
            }

            FirstValidIndex = source.FirstValidIndex + 2;
        }

        public static CountTurn Series(TimeSeries source)
        {
            var key = CacheKey("CountTurn");
            if (source.Cache.TryGetValue(key, out var obj))
            {
                return (CountTurn) obj;
            }

            var result = new CountTurn(source);
            source.Cache[key] = result;
            return result;
        }
    }
}
Start with File, New Indicator. Once the New Indicator window is open, you can hit F1 or click the question mark icon in the toolbar to get to the help page.
Note: you need to be running WL8 in Windows Admin mode to create Custom Indicators.
Note: you need to be running WL8 in Windows Admin mode to create Custom Indicators.
Thank you very much for your help! I will try it out tonight.
I have tried it and it works very well! Thanks again to Paul1986, Glitch and Cone!
@Gunny - you're welcome and glad that I could help.
AI side story for C# developers...
I coded the indicator in Post #9 using JetBrains Rider IDE with the GitHub Copilot plug-in. (Copilot is available for Visual Studio, too.) I had just completed the Populate method and after a few seconds, Copilot automatically suggested the Series method. It was correct! All I had to do was press tab to add the method. It was like it read my mind. I didn't even start to type the method. Its as if Copilot thought "I understand that you're coding an indicator for WealthLab. You have other indicators in your project. Each of them have a Series method. Here you go." Mind boggling!
Wow that's impressive!
That sounds crazy!
More AI awesome sauce... I asked GitHub Copilot Chat "Do you know all of the built-in indicators in WealthLab 8?"
This was its reply...
So, it seems to have learned about WealthLab 8.
This was its reply...
QUOTE:
WealthLab 8 provides a wide range of built-in indicators for technical analysis. Here are some of them:
1. Simple Moving Average (SMA)
2. Exponential Moving Average (EMA)
3. Weighted Moving Average (WMA)
4. Relative Strength Index (RSI)
5. Moving Average Convergence Divergence (MACD)
6. Bollinger Bands (BB)
7. Average True Range (ATR)
8. Stochastic Oscillator
9. Commodity Channel Index (CCI)
10. Money Flow Index (MFI)
11. On Balance Volume (OBV)
12. Rate of Change (ROC)
13. Parabolic SAR
14. Accumulation/Distribution Line
15. Chaikin Money Flow (CMF)
16. Ichimoku Cloud
17. Volume Weighted Average Price (VWAP)
18. Williams %R
19. Ultimate Oscillator
20. Keltner Channels
Please note that this is not an exhaustive list and there might be more indicators available in WealthLab 8. You can also create custom indicators based on your specific needs.
So, it seems to have learned about WealthLab 8.
It got Ichimoku Cloud wrong though, that's not built-in, it's an Extension.
Your Response
Post
Edit Post
Login is required