I Asked Claude to Build a Trading Indicator, Then I Backtested ItPublished: 9/23/2026
|
|
AI can create trading strategies and technical indicators remarkably quickly. But there's a much more important question:
Do they actually work?
Recently I had a real trading problem I wanted to solve. Instead of designing an indicator myself, I decided to ask Claude to tackle it — and then use WealthLab 9 to determine whether Claude's idea had any value. The result became a new indicator I call the Blowoff Score.
The Problem: Buying After a Parabolic Move
I've been developing a mean-reversion strategy called KJ Custom. Like many mean-reversion systems, it attempts to buy stocks after a short-term pullback. While reviewing some of its trades, I noticed something interesting. Some of the strategy's larger losing trades occurred in stocks that had recently experienced enormous, almost parabolic advances.
These stocks could technically satisfy the strategy's normal entry conditions after pulling back, but I wondered if the preceding price action was telling us something important. What if the stock wasn't simply experiencing a normal pullback? What if it was coming down from a blow-off move?
That gave me a research hypothesis:
Could I identify stocks that had recently experienced a parabolic move and prevent KJ Custom from entering them?
Rather than immediately start building an indicator, I asked Claude how it would approach the problem.
Asking Claude to Quantify a Blow-Off Top
Claude's response was interesting because it didn't try to identify a blow-off top using a single traditional indicator. Instead, it described a blow-off move as a combination of several behaviors occurring simultaneously:
- Upside momentum that is still accelerating
- Price stretched unusually far above its trend
- Daily trading ranges expanding rather than contracting
- Often, but not always, a surge in volume
That made intuitive sense. RSI alone might tell us a stock is overbought, but stocks can remain overbought for a long time. Distance from a moving average measures price extension, but doesn't necessarily capture acceleration. Volatility expansion provides another clue, and unusual volume can provide confirmation. Claude combined these concepts into a composite indicator ranging from 0 to 100. It called it the Blowoff Score. The higher the score, the more characteristics of a parabolic blow-off move are present.
The Blowoff Score Code
Here's the complete WealthLab 9 indicator. The default version gives 35% weight each to momentum acceleration and price extension, with volatility expansion and volume contributing 15% each.
using WealthLab.Core;
using WealthLab.Indicators;

namespace WealthLab.Patreon
{
    public class BlowOffScore : IndicatorBase
    {
        public BlowOffScore() : base()
        {
        }

        public BlowOffScore(BarHistory source, int accelPeriod,
            int extensionPeriod, int atrPeriod, int volShortPeriod,
            int volLongPeriod, int volumeAvgPeriod, int smoothPeriod,
            bool useVolume) : base()
        {
            Parameters[0].Value = source;
            Parameters[1].Value = accelPeriod;
            Parameters[2].Value = extensionPeriod;
            Parameters[3].Value = atrPeriod;
            Parameters[4].Value = volShortPeriod;
            Parameters[5].Value = volLongPeriod;
            Parameters[6].Value = volumeAvgPeriod;
            Parameters[7].Value = smoothPeriod;
            Parameters[8].Value = useVolume;
            Populate();
        }

        public static BlowOffScore Series(BarHistory source,
            int accelPeriod, int extensionPeriod, int atrPeriod,
            int volShortPeriod, int volLongPeriod, int volumeAvgPeriod,
            int smoothPeriod, bool useVolume)
        {
            string key = CacheKey("BlowOffScore", accelPeriod,
                extensionPeriod, atrPeriod, volShortPeriod,
                volLongPeriod, volumeAvgPeriod, smoothPeriod, useVolume);

            if (source.Cache.ContainsKey(key))
                return (BlowOffScore)source.Cache[key];

            BlowOffScore bos = new BlowOffScore(source, accelPeriod,
                extensionPeriod, atrPeriod, volShortPeriod,
                volLongPeriod, volumeAvgPeriod, smoothPeriod, useVolume);

            source.Cache[key] = bos;
            return bos;
        }

        public override bool PositionMetricCandidate => true;

        public override string Name => "Blow-Off Score";

        public override string Abbreviation => "BlowOffScore";

        public override string HelpDescription =>
            "0-100 composite score of parabolic blow-off strength: momentum acceleration, " +
            "extension above trend in ATRs, volatility expansion, and optional volume climax.";

        public override string PaneTag => Abbreviation;

        public override WLColor DefaultColor => WLColor.NeonRed;

        public override void Populate()
        {
            BarHistory bars = Parameters[0].AsBarHistory;
            DateTimes = bars.DateTimes;

            int accelPeriod = Parameters[1].AsInt;
            int extensionPeriod = Parameters[2].AsInt;
            int atrPeriod = Parameters[3].AsInt;
            int volShortPeriod = Parameters[4].AsInt;
            int volLongPeriod = Parameters[5].AsInt;
            int volumeAvgPeriod = Parameters[6].AsInt;
            int smoothPeriod = Parameters[7].AsInt;
            bool useVolume = Parameters[8].AsBoolean;

            EMA emaBase = EMA.Series(bars.Close, extensionPeriod);
            ATR atrBase = ATR.Series(bars, atrPeriod);
            ATR atrShort = ATR.Series(bars, volShortPeriod);
            ATR atrLong = ATR.Series(bars, volLongPeriod);
            SMA volAvg = useVolume
                ? SMA.Series(bars.Volume, volumeAvgPeriod)
                : null;

            Int32 startBar =
                Math.Max(Math.Max(extensionPeriod, volLongPeriod),
                atrPeriod) + 2 * accelPeriod;

            if (useVolume)
                startBar = Math.Max(startBar, volumeAvgPeriod + 1);

            TimeSeries blowoff = new TimeSeries(bars.DateTimes, 0);

            for (Int32 bar = 0; bar < bars.Count; bar++)
            {
                if (bar < startBar)
                {
                    blowoff[bar] = 0;
                    continue;
                }

                // 1. Acceleration
                Double roc1 =
                    (bars.Close[bar] - bars.Close[bar - accelPeriod]) /
                    bars.Close[bar - accelPeriod] * 100.0;

                Double roc2 =
                    (bars.Close[bar - accelPeriod] -
                    bars.Close[bar - 2 * accelPeriod]) /
                    bars.Close[bar - 2 * accelPeriod] * 100.0;

                Double accel = roc1 - roc2;
                Double accelScore =
                    Clamp01((accel + 10.0) / 20.0) * 100.0;

                // 2. Extension above trend, measured in ATRs
                Double atrVal =
                    atrBase[bar] > 0 ? atrBase[bar] : 0.0001;

                Double extension =
                    (bars.Close[bar] - emaBase[bar]) / atrVal;

                Double extensionScore =
                    Clamp01((extension + 1.0) / 6.0) * 100.0;

                // 3. Volatility expansion
                Double volExpansion =
                    atrLong[bar] > 0
                    ? (atrShort[bar] / atrLong[bar]) - 1.0
                    : 0.0;

                Double volExpansionScore =
                    Clamp01((volExpansion + 0.3) / 1.3) * 100.0;

                // 4. Volume climax
                Double volumeScore = 50.0;

                if (useVolume)
                {
                    Double volAvgVal =
                        volAvg[bar] > 0 ? volAvg[bar] : 1.0;

                    Double volumeRatio =
                        (bars.Volume[bar] / volAvgVal) - 1.0;

                    volumeScore =
                        Clamp01((volumeRatio + 0.3) / 1.8) * 100.0;
                }

                // Weighted composite
                blowoff[bar] = useVolume
                    ? accelScore * 0.35 +
                      extensionScore * 0.35 +
                      volExpansionScore * 0.15 +
                      volumeScore * 0.15
                    : accelScore * 0.5 +
                      extensionScore * 0.5;
            }

            // Light smoothing to reduce bar-to-bar whipsaw
            if (smoothPeriod > 1)
            {
                TimeSeries smoother =
                    EMA.Series(blowoff, smoothPeriod);

                for (Int32 bar = 0; bar < bars.Count; bar++)
                    blowoff[bar] = smoother[bar];
            }

            AssumeValuesOf(blowoff);
        }

        protected override void GenerateParameters()
        {
            AddParameter("Bars", ParameterType.BarHistory, null);
            AddParameter("Accel Period", ParameterType.Int32, 5);
            AddParameter("Extension Period", ParameterType.Int32, 50);
            AddParameter("ATR Period", ParameterType.Int32, 14);
            AddParameter("Vol Short Period", ParameterType.Int32, 5);
            AddParameter("Vol Long Period", ParameterType.Int32, 50);
            AddParameter("Volume Avg Period", ParameterType.Int32, 20);
            AddParameter("Smooth Period", ParameterType.Int32, 3);
            AddParameter("Use Volume", ParameterType.Boolean, true);
        }

        private static Double Clamp01(Double x)
        {
            if (x < 0)
                return 0;

            if (x > 1)
                return 1;

            return x;
        }
    }
}
The code is useful, but it's important not to confuse the sophistication of an implementation with evidence that it works. That was the easy part. Now came the question that actually matters.
Does the Indicator Have Any Predictive Value?
This is where I think AI-assisted trading research gets interesting. Claude had created an indicator that sounded reasonable. But a convincing explanation isn't evidence.
So I implemented the Blowoff Score as a WealthLab indicator and tested it against the historical trades generated by KJ Custom. Using WealthLab 9's Analysis Series visualizer, I analyzed the Blowoff Score at the time each historical position was entered. This allowed me to answer a very specific question:
How did the strategy's trades perform at different Blowoff Score levels?
The result was striking.
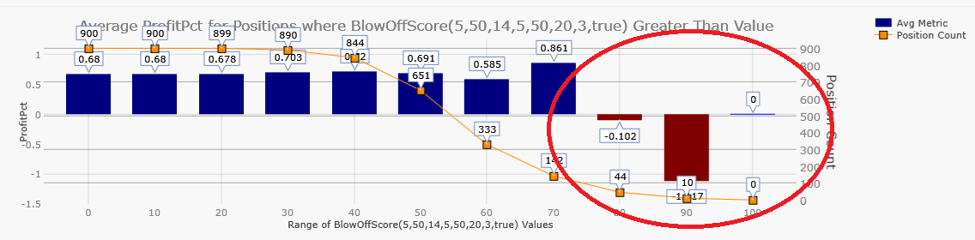
As the Blowoff Score moved toward the upper end of its range, the average profitability of KJ Custom trades deteriorated substantially. In particular, trades occurring when the Blowoff Score approached 80 performed markedly worse. Now we had something more interesting than an AI-generated indicator. We had evidence.
Turning the Discovery Into a Trading Rule
The next temptation would be to optimize the exact Blowoff Score threshold until the backtest produced the best possible result. That's also an excellent way to overfit a trading system. Instead, I wanted a simple threshold that captured the broad relationship visible in the data. I settled on 70. KJ Custom now avoids opening a new position when:
Blowoff Score >= 70
This isn't intended to predict the exact top of a stock. It's simply telling the strategy:
This stock has recently exhibited enough characteristics of an extreme parabolic move that we don't want to attempt this particular mean-reversion trade.
That's an important distinction. An indicator doesn't necessarily need to predict the market by itself to be useful. Sometimes its value comes from identifying a market condition in which a particular strategy historically performs poorly.
Looking at Some Recent Trades
The filter also produced an interesting result when I looked at some of KJ Custom's recent losing trades. Two examples were KLAC and AXON. Both had experienced substantial advances before eventually generating KJ Custom entry signals. Their Blowoff Scores were elevated enough that the new filter would have prevented those trades.
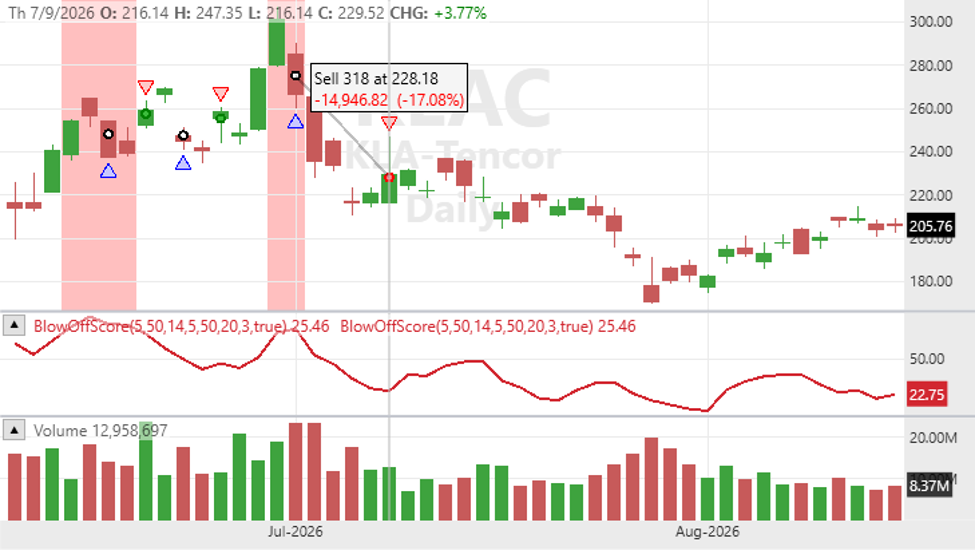
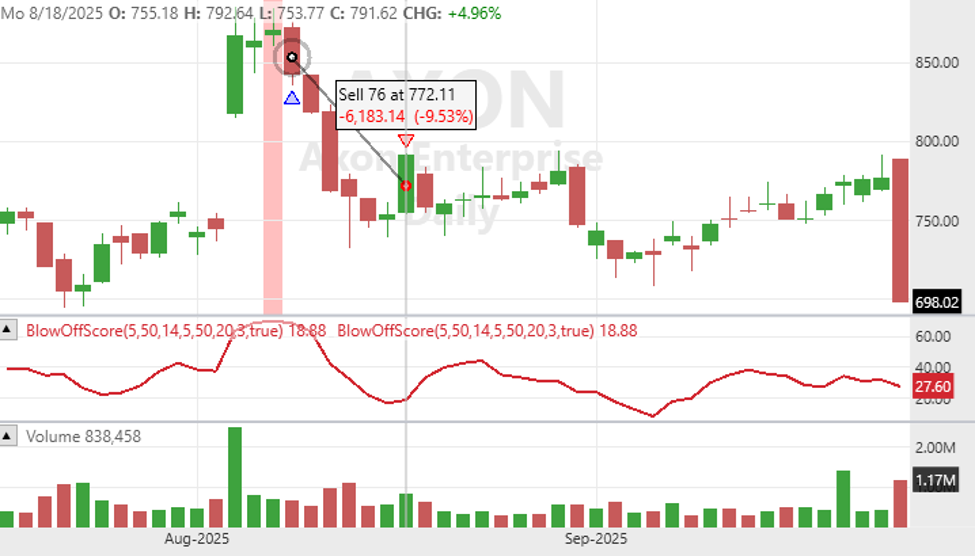
Of course, avoiding a few losing trades doesn't prove that an indicator will continue working in the future. That's why I find the broader historical relationship more compelling than individual examples. The KLAC and AXON trades simply illustrate the type of market behavior the indicator was designed to detect.
AI Didn't Find the Edge
There's an important distinction in this experiment. I wouldn't say Claude discovered a trading edge.
Claude helped me turn an observation into a testable hypothesis.
I supplied the original observation:
Some of my worst mean-reversion trades seem to occur after stocks have made extreme parabolic advances.
Claude helped translate that qualitative observation into something quantitative. WealthLab then allowed me to test that idea across historical trades and determine whether there was actually a relationship worth investigating. The research process looked like this:
Observation → AI → Indicator → Backtest → Evidence → Strategy
That's a very different way of using AI than simply asking:
"Give me a profitable trading strategy."
The Real Opportunity for AI in Quantitative Trading
Large language models are extraordinarily good at taking loosely defined ideas and turning them into code, formulas, indicators, and testable rules. That can dramatically accelerate quantitative research. But it also creates a new problem. AI can generate plausible trading ideas far faster than we can determine whether those ideas are actually valid.
An indicator can have a compelling explanation. A strategy can contain sophisticated logic. The code can look perfect. None of that means it has predictive value. That's why I believe the most powerful combination isn't simply AI + trading. It's:
AI + rigorous backtesting.
Use AI to generate hypotheses. Use historical data to challenge them. And only keep the ideas that survive the test.
Bringing AI and Backtesting Together in WealthLab 9
This research workflow is one of the reasons we've been expanding the AI capabilities in WealthLab 9. The built-in Strategy AI can generate complete trading strategies from plain-English ideas. Claude can connect directly to WealthLab, create and modify strategies, run backtests, retrieve results, and help analyze them. But underneath those new AI capabilities is the same mature WealthLab backtesting engine designed to answer the question we've been asking for more than two decades:
Does this trading idea actually work?
That's particularly important now. AI has made it dramatically easier to generate trading code — and even to create entirely new backtesting tools. But generating a backtest isn't the difficult part. The difficult part is trusting that the engine correctly handles all the details and edge cases that real-world strategy testing eventually exposes. WealthLab has been tackling those problems for more than two decades. Now AI gives us a completely new way to interact with that foundation.
AI makes it possible to generate and explore ideas faster than ever. The challenge now isn't generating more ideas. It's figuring out which ones deserve our attention. And that's exactly what backtesting is for.
No Credit Card required.