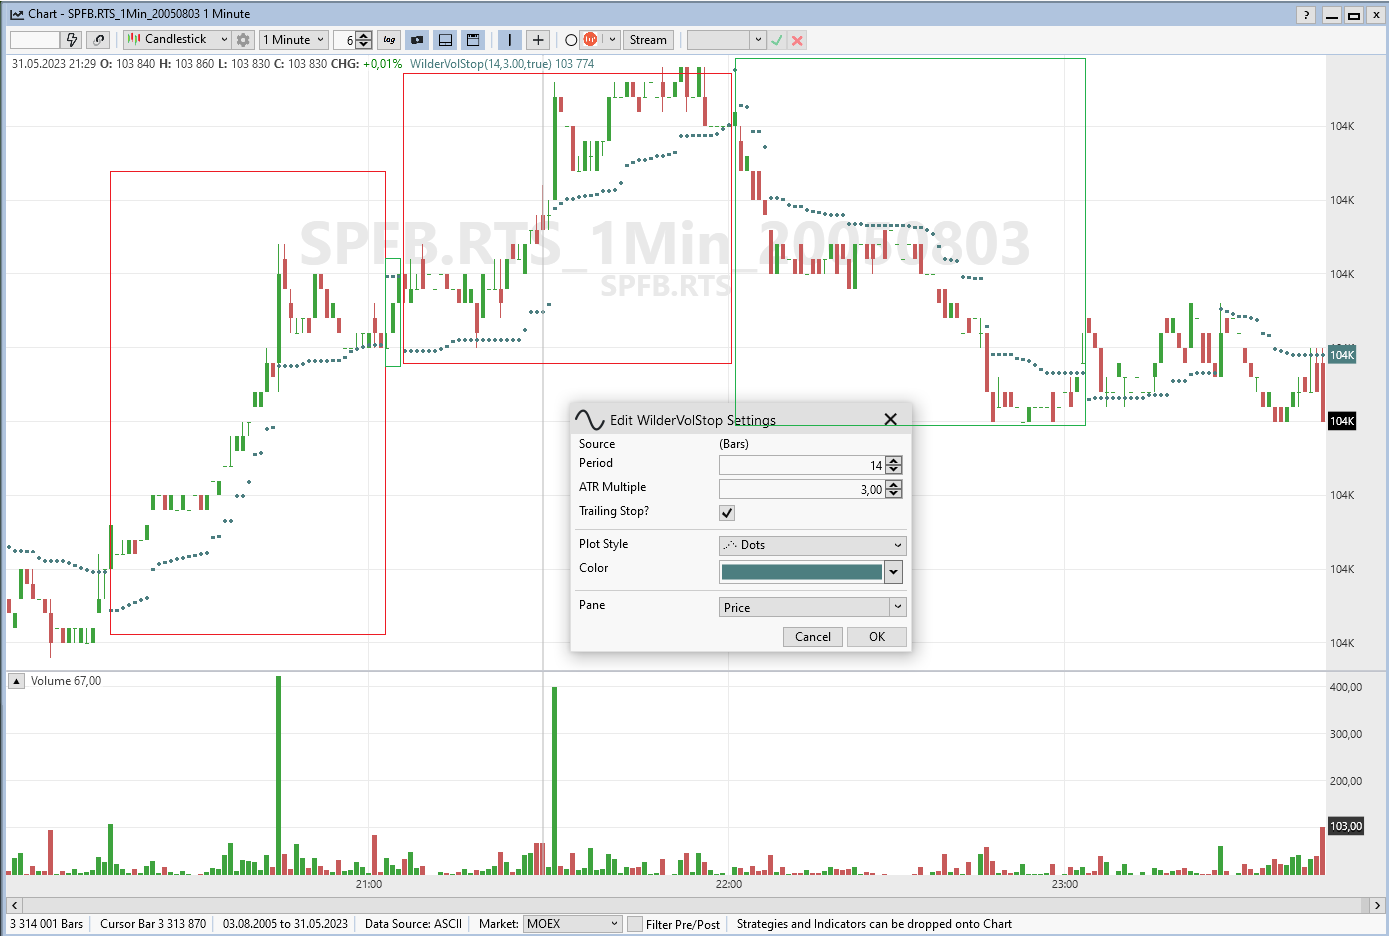
I noticed that the WilderVolStop indicator draws groups of dots that clearly fall into the category of a downtrend or an uptrend.
I don't really understand how I can programmatically determine which of these categories the indicator value falls into on a certain candle.
It would seem that if the previous value of the indicator is less than the current one, then we have an uptrend, and if more, then a downtrend.
However, this logic does not work on the boundaries of point groups. In addition, the previous value of the indicator may be the same as the current one.
I also tried to compare the price of the indicator with the current price (close) and the results are not obvious either. Not always, when the indicator value is higher than the price, we are talking about a downtrend.
Please help me programmatically determine which group the current indicator value belongs to.
Rename
I can say a change is coming in B42 so you should wait for it.
Also, a violation of the close price is considered a trend change for this indicator so you can disregard those high/low spikes.
Also, a violation of the close price is considered a trend change for this indicator so you can disregard those high/low spikes.
If closing price is above the dot we are in an up trend.
Your Response
Post
Edit Post
Login is required