Is there a Chart setting to toggle to "Show Pane Name" ? Would like to have the Chart Pane name shown as either 1) a 'title" at the top of the Pane, or 2) simply replace the current title/label that shows the expression being plotted in the Pane with the more "Reader Friendly" Pane's name.
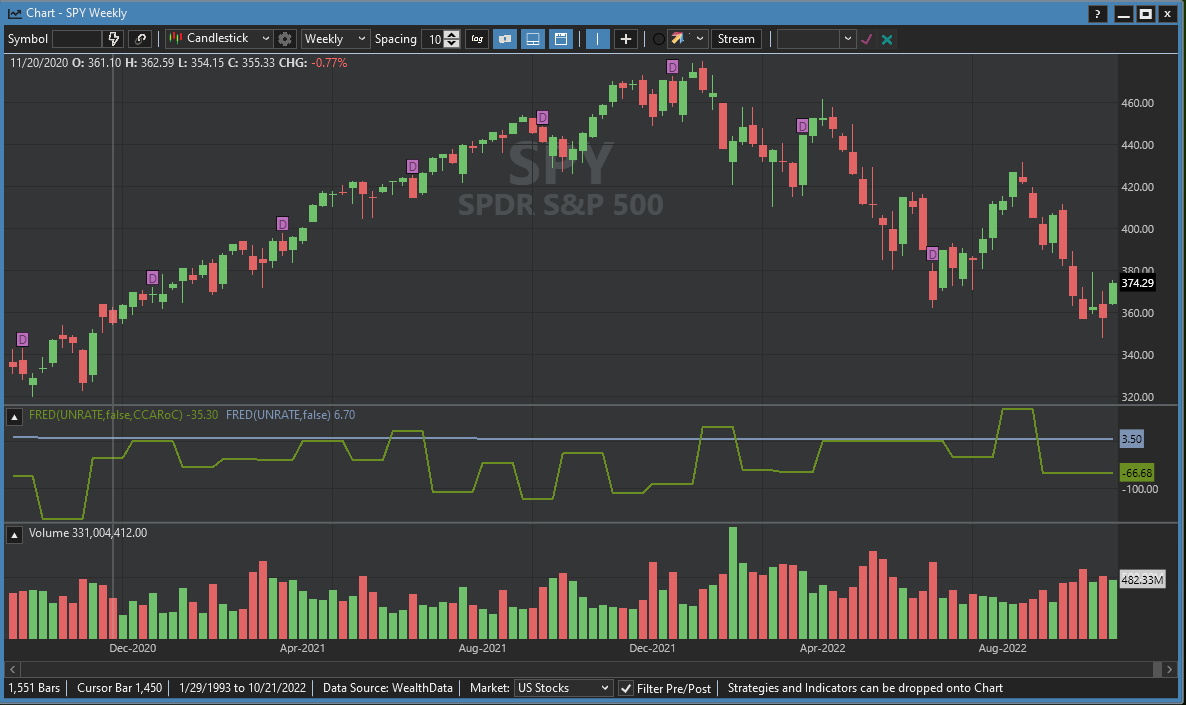
FWIW one good example use case of this is when I plot a bunch of FRED data timeseries and the timeseries names are incredibly confusing to look at as just a string of characters etc that serve as pretty poor abbreviations of whats being plotted. As well many of the numbers included in the FRED series refer to any of the transformations implicit in the timeseries being pulled which is just hard to remember.
Not sure if this is just a bug with the FRED indicator in WL8 because it does not appear to do anything when I select the checkbox to pull the FRED description.
Rename
QUOTE:
Not sure if this is just a bug with the FRED indicator in WL8 because it does not appear to do anything when I select the checkbox to pull the FRED description.
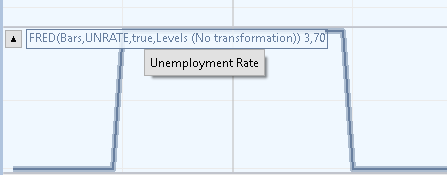
No, there is no bug and it works correctly. It won't plot the description but if you hover the mouse over the FRED time series WL will pop up a box with description - see below. Make sure to check "Get description?" first (i.e. before your series is cached without a description).
Ah ok. That's a bit helpful. Would definitely like the ability to Label a Pane with Title/description specifically for Pane plots that are the result of multiple indicators being plotted via complex transformations with the intention of the indicators being compared to each other (e.g. Divergence observation between timeseries vs just looking at the timeseries independently - reading a description/title allows me to quickly understand what I should be looking at in a particular pane immediately).
Being able to understand quickly how a plot should be viewed and interpreted, in general, and not just with FRED data, is the general use case I'm trying to improve for myself in order to better being to infer causal relationships rather than simple spurious correlations. Super tough to have to stare at an expression or hover over a label across dozens of indicator plots every time I open a workspace.
Being able to understand quickly how a plot should be viewed and interpreted, in general, and not just with FRED data, is the general use case I'm trying to improve for myself in order to better being to infer causal relationships rather than simple spurious correlations. Super tough to have to stare at an expression or hover over a label across dozens of indicator plots every time I open a workspace.
QUOTE:
Would definitely like the ability to Label a Pane with Title/description specifically...
You can already accomplish this albeit in a different way. It does require coding though. See "bool suppressLabels" parameter of PlotTimeSeries, PlotIndicator etc.
The suppressLabels parameter lets you disable to indicator pane labels and the value markers along the chart's right margin for this plot.
This gives you a fine grained control on each series plotted rather than turn them off at once as you're proposing - which may be an edge case.
I'm happy to dive into some code modifications. Is there a Code view just for an adhoc Chart window that I created manually. (E.g. No strategy).
Yes, right click on the chart and choose "Push dropped indicators..."
QUOTE:
(i.e. before your series is cached without a description).
What will force the cache to refresh itself? I just went back into "Edit..." some FRED indicators and checked the pull description box. I then saved my workspace, shutdown WL, and rebooted my computer, then restarted WL, and when I open the Workspace it does not pull the FRED description when it opens the Chart.
Is it actually being cached for a finite timeframe or simply persisting whatever the state that was was initially selected. When you said cached I just assumed that it would purge the cache upon PC shutdown and then refresh the cache upon PC restart.
QUOTE:
When you said cached I just assumed that it would purge the cache upon PC shutdown and then refresh the cache upon PC restart.
No it wouldn't. Try "tomorrow" (next market session) or purge the FRED folder (File menu > "Open WL User Data Folder").
You can use the += operator in the code below to append text to an existing plot label for clarification.
You might also be able to use one of the string parameters in the FRED(...) call for labeling.
CODE:
      public override void Initialize(BarHistory bars)
      {
         ind = new Fred(bars,"UNRATE",true,"Levels (No transformation)");
         ind.Description += "*** This is appended text ***";
         PlotIndicator(ind, WLColor.Blue, PlotStyle.Line);
      }
      private IndicatorBase ind;
You might also be able to use one of the string parameters in the FRED(...) call for labeling.
@superticker
This is perfect. Thanks so much for this workaround! More or less what I was looking to do.
This is perfect. Thanks so much for this workaround! More or less what I was looking to do.
Eugene we really should spend a bit of TLC and make those FRED abbreviations less verbose. We can overwrite the dynamically generated Description for indicators.
Dion, I exposed those strings on purpose so that users knew what kind of operation is applied to the series and to match the source website. We could consider abbreviating say "Continuously Compounded Annual Rate Of Change" into "Cont. Comp. Ann. ROC" but would saved space justify the added obscurity?
My gripe is the ubiquitous "No transformation". If there's "No transformation", just don't print that. Otherwise put the transformation if there actually is one.
QUOTE:
I exposed those strings on purpose so that users knew what kind of operation is applied to the series and to match the source website. We could consider abbreviating say "Continuously Compounded Annual Rate Of Change" into "Cont. Comp. Ann. ROC" but would saved space justify the added obscurity?
...
My gripe is the ubiquitous "No transformation". If there's "No transformation", just don't print that. Otherwise put the transformation if there actually is one.
I appreciate the idea of always allowing the user understand the settings that result in what is being displayed. However, in my [weakly held] opinion, I feel like being able to click the label and go to the Edit dialog to see the settings behind the data series is totally sufficient. And then biasing the UI label to the descriptive text only is cleaner more user-friendly. Mainly because I the user generally understand the initial settings I used to pull in the data, and I only want to see the descriptive text. If I forget once in a while then I simply click the label, go to the Edit dialog, and refresh my memory. Refreshing my memory of the settings being the data series is like the 1% usecase, whereas quickly viewing the data series and knowing what I'm viewing by virtue of a clean looking plain-english text description is the 99% usecase.
Thanks all for listening to my feedback. I actually believe that using WL has easily got to be the best tool yet that I've used to view economic data like FRED in the context of market data/strategies. I often wouldspend hours building bespoke dashboards for this stuff in python notebooks and WL just makes this 10x faster/easier/powerful.
(Alternatively, perhaps all of the Edit... dialogs for a data series can simply have a Description override field, where the user can just type in whatever string they want to be used as the label.)
QUOTE:
I feel like being able to click the label and go to the Edit dialog to see the settings behind the data series is totally sufficient.
Assuming I read your message correctly, this is not in the cards for FRED because its labels are not intended to be user modified in the manner you're proposing. They're used internally to recognize the different transformations and return the correct time series. Sorry.
QUOTE:
FRED ... its labels are not intended to be user modified ... They're used internally to recognize the different transformations and return the correct time series.
I'm trying to decide if this is a good thing or a bad thing.
If the FRED instance is passed by reference, then I would define one or two enum state (field) variables to hold this information. For the FREDinstance.Description, they can be de-referenced to strings to document the state of that FRED instance.
QUOTE:
for a data series can simply have a Description override field, where the user can just type in whatever string they want to be used as the label.
If you're using code, you can do that today. The code below removes the string ", Levels (No transformation)" from the description line. Any string operation is valid here including regular expressions.
CODE:
      public override void Initialize(BarHistory bars)
      {
         ind = new Fred(bars, "UNRATE", true, "Levels (No transformation)");
         ind.Description = ind.Description.Replace(", Levels (No transformation)",null);
         PlotIndicator(ind, WLColor.Blue, PlotStyle.Line);
      }
      private IndicatorBase ind;
QUOTE:
If you're using code, you can do that today. The code below removes the string ", Levels (No transformation)" from the description line. Any string operation is valid here including regular expressions.
Thanks for that @superticker. A couple issues with this path:
1) In order to operate at the code level of a Chart I first have to dump all the indicators which then inevitably apparently creates a code backed *Strategy* which I then have to copy in some "placeholder" Execute() block *I think*. I don't even want a strategy here, I just want a Chart that I can modify the rendering of at the code level.
2) The dumping of all my indicators is throwing a bunch of exceptions (it appears to be exporting some odd looking parameters in some cases, but I'm still new here and still not that familiar with C# or the WL API to say what exactly the problem is..
Example error log when I drop all indicators and then "Run Backtest" (which i assumed would then hopefully populate the Chart tab".
E,g, I have not idea why the Push Indicators action is autopopulating what looks like a StdDev instance for a parameter to MathIndOpInd in this case:
ind14 = new MathIndOpInd(bars,new TimeSeriesIndicatorWrapper(bars.Close),MathOperation.Subtract,new StdDev);
I do a "Close - Close" operation to plot zero lines, and "Close / Close" to plot a line at 1 in a few places, and it appears that it may be related to this, but unclear exactly because this particular chart has 30 indicators that get pushed.
Also the error log below references "RSI" not being referenced properly - I don't even have RSI anywhere on the Chart that dropped the indicators from:
63: 'RSI' does not contain a constructor that takes 4 arguments
65: 'RSI' does not contain a constructor that takes 4 arguments
71: 'RSI' does not contain a constructor that takes 4 arguments
73: 'RSI' does not contain a constructor that takes 4 arguments
Compiled at 10/20/2022 13:25:54
49: A new expression requires an argument list or (), [], or {} after type
77: A new expression requires an argument list or (), [], or {} after type
2: The using directive for 'WealthLab.DataExtensions' appeared previously in this namespace
...
63: 'RSI' does not contain a constructor that takes 4 arguments
...
75: 'StdDev' does not contain a constructor that takes 4 arguments
...
I have no idea what the problem above is. Pushing the indicator(s) to code is only designed to help you code that indicator into a coded strategy. But the code generated by this operation is not easy to follow. Only the line of code that declares the indicator instance may be useful. The rest of the code may be confusing to many, especially someone new to C#.
If you press the "Open as C# Coded Strategy" button, that would fix most of the above problem. But following that machine generated C# code will be difficult. I suppose you could try it and see if you can then simplify that solution.
I would just save the code part that declares the indicators instances and recast the rest of the code by hand. That's the best way. Perhaps if you tell us what your strategy does, we can get you started with a coded solution if it's not too complicated.
Thanks again @superticker - Yes I think you're right about simply using the auto code gen as a way to cut and paste indicator configurations. That makes more sense.
I think I just realized my "mental operating model for WL" was a bit wrong - Rather than doing exploratory analysis work just in a Chart window (which is what this whole thread has been about - no real Strategy based off of all of these 30 [mostly transformations of FRED] indicators, but eventually I will use a handful of them in a proper strategy), I should just be opening a Strategy document from the get go and do my exploratory work in the Chart there so that I both have the ability to do custom coding of plot indicators, on top of, even using the Building Blocks tools to accomplish other quick indicator creation beyond the standard Chart tools.
Then once I want to build a Strategy I can piece together the small handful of indicators required from the above as needed.
I guess I did not realize initially that a Chart in Strategy could also have plots/indicators/panes that are *unrelated* to the actual Strategy - but I'm now thinking they can "co-exist" (E.g. Strategy used indicators + indicators for user visualization to give additional context around the state of the market when a strategy signal triggers).
FRED descriptions have gotten a much-needed haircut for the next release!
Your Response
Post
Edit Post
Login is required