Hi, Glitch:
This message is for you because I got the impression you worked on the B19 performance enhancements for optimizations. I've noticed that optimizations seem to have slowed considerably versus B18. I'm doing a basic exhaustive optimization with 480 permutations and it is taking about 9 minutes. This is on an AMD 5950x (16 cores) with 64 GB memory and a WD Black SSD.
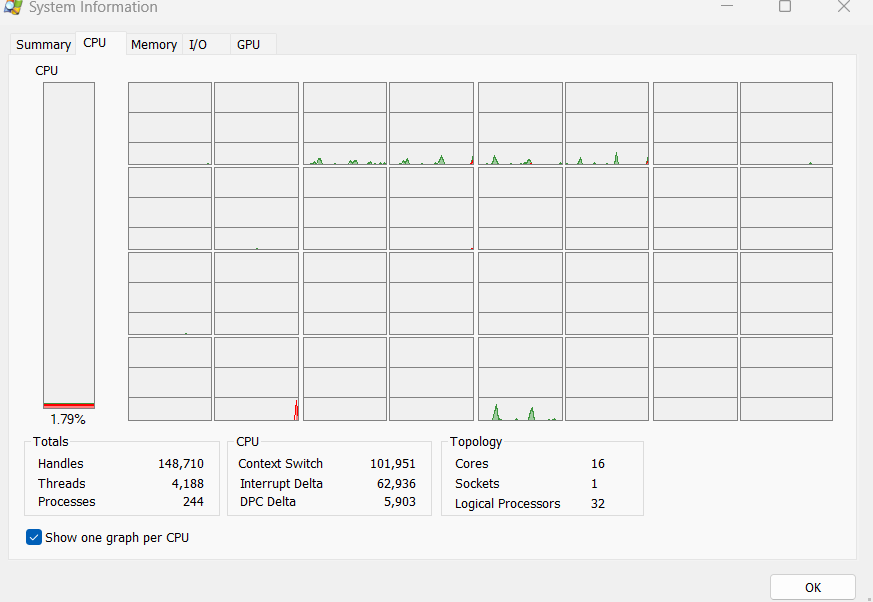
When I bring up Process Explorer it is showing a typical average CPU usage of under 0.5 percent. It looks like the processing is using maybe 4 to 6 cores and each of them are hardly pushing a few percent from observing the CPU graph. Although, the graph here shows the average at 1.79% when I took the snapshot:
If you would like more evidence please let me know. If so, I'll bake up another C# strategy and give it a try, or maybe you have one I could try. I don't want to supply my current strategy because it is rather large. The key thing that stood out to me is the very low CPU usage.
I'm just letting you know about this potential issue in case you wanted to take a look at it before I supply more info, if requested.
Thanks,
Paul
This message is for you because I got the impression you worked on the B19 performance enhancements for optimizations. I've noticed that optimizations seem to have slowed considerably versus B18. I'm doing a basic exhaustive optimization with 480 permutations and it is taking about 9 minutes. This is on an AMD 5950x (16 cores) with 64 GB memory and a WD Black SSD.
When I bring up Process Explorer it is showing a typical average CPU usage of under 0.5 percent. It looks like the processing is using maybe 4 to 6 cores and each of them are hardly pushing a few percent from observing the CPU graph. Although, the graph here shows the average at 1.79% when I took the snapshot:
If you would like more evidence please let me know. If so, I'll bake up another C# strategy and give it a try, or maybe you have one I could try. I don't want to supply my current strategy because it is rather large. The key thing that stood out to me is the very low CPU usage.
I'm just letting you know about this potential issue in case you wanted to take a look at it before I supply more info, if requested.
Thanks,
Paul
Rename
I am seeing the same issue
Could you each run the following strategy and let me know what appears in the Debug tab?
CODE:

using WealthLab.Backtest;
using System;
using WealthLab.Core;
using WealthLab.Indicators;
using System.Collections.Generic;

namespace WealthScript1
{
    public class MyStrategy : UserStrategyBase
    {
        //create indicators and other objects here, this is executed prior to the main trading loop
        public override void Initialize(BarHistory bars)
        {
         int pc = Environment.ProcessorCount;
         WriteToDebugLog(pc.ToString());
        }

        //execute the strategy rules here, this is executed once for each bar in the backtest history
        public override void Execute(BarHistory bars, int idx)
        {
            if (!HasOpenPosition(bars, PositionType.Long))
            {
                //code your buy conditions here
            }
            else
            {
                //code your sell conditions here
            }
        }

        //declare private variables below

    }
}
For every symbol, it shows 32 (logical) processors which is in accordance with an AMD 5950x.
Edit... by the way, my strategy was doing a lot of plotting and also called DrawText in a couple of places. I commented out the plots and the DrawText, and that made no difference. The strategy was also using ZigZag so I got rid of that - no difference.
I didn't think ditching the plots and draws would matter since I suspect the WL code short circuits plots and draws when optimizing, but I thought it was worth a try. Hope that helps.
I am using the SMAC Optimizer & it take for ever
Glitch:
I used SysInternals Process Explorer to take a look at what is going on in the WL8 process threads. I see a lot of threads with a start address of coreclr.dll!MetaDataGetDispenser+0x78bb0. Looks like there is probably around 32 of them. Most of the time the threads seem to be in state Wait:UserRequest, and the CPU usage is puny - like 0.07%.
When looking at the process handles there are four semaphores - two of them with the word WilStaging and two with the word WilError in them. Hope that helps.
If you need any more detailed info please let me know.
Paul
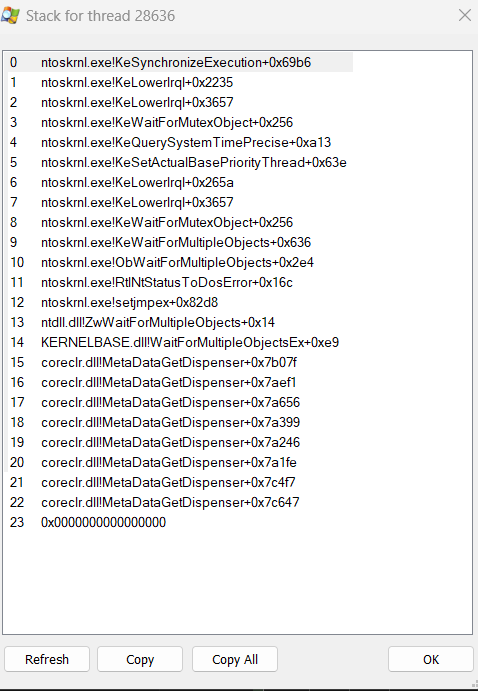
One more thing. Here's a quick snapshot of the stack of one of the threads...
I have an idea of what it might be, maybe we could get a special build out to you to see if it helps. But it's not occurring on my machines so I can't check it locally. Send an email to support@wealth-lab.com and we can coordinate it.
Glitch - I sent you an email.
Your Response
Post
Edit Post
Login is required