Hello,
I am running into some weird issues when I am comparing my backtest results to the results displayed in the WFO tabular. I exported the tabular to an excel spreadsheet and it showed there should be only 27 positions in the OOS backtest. However, the backtest shows 35 positions.
I realized that the start date on the "Run an OOS backtest with the WFO parameters" button is at the beginning of the period of the entire data set (Asking this to be changed in another post/FeatureRequest). I then changed the start date to be the same as the beginning of the OOS data. However, I still got 31 positions. I found there was one position that did not show up in the Tabular at the end of the data. This still gives at least three positions that are showing up in the middle of the backtest but are not accounted for in the Tabular.
All of this discrepancy is making me wonder how accurate the OOS backtest actually is. Or is the tabular displaying incorrectly? Either way, it is concerning.
Here is a series of screenshots showing what I described above.
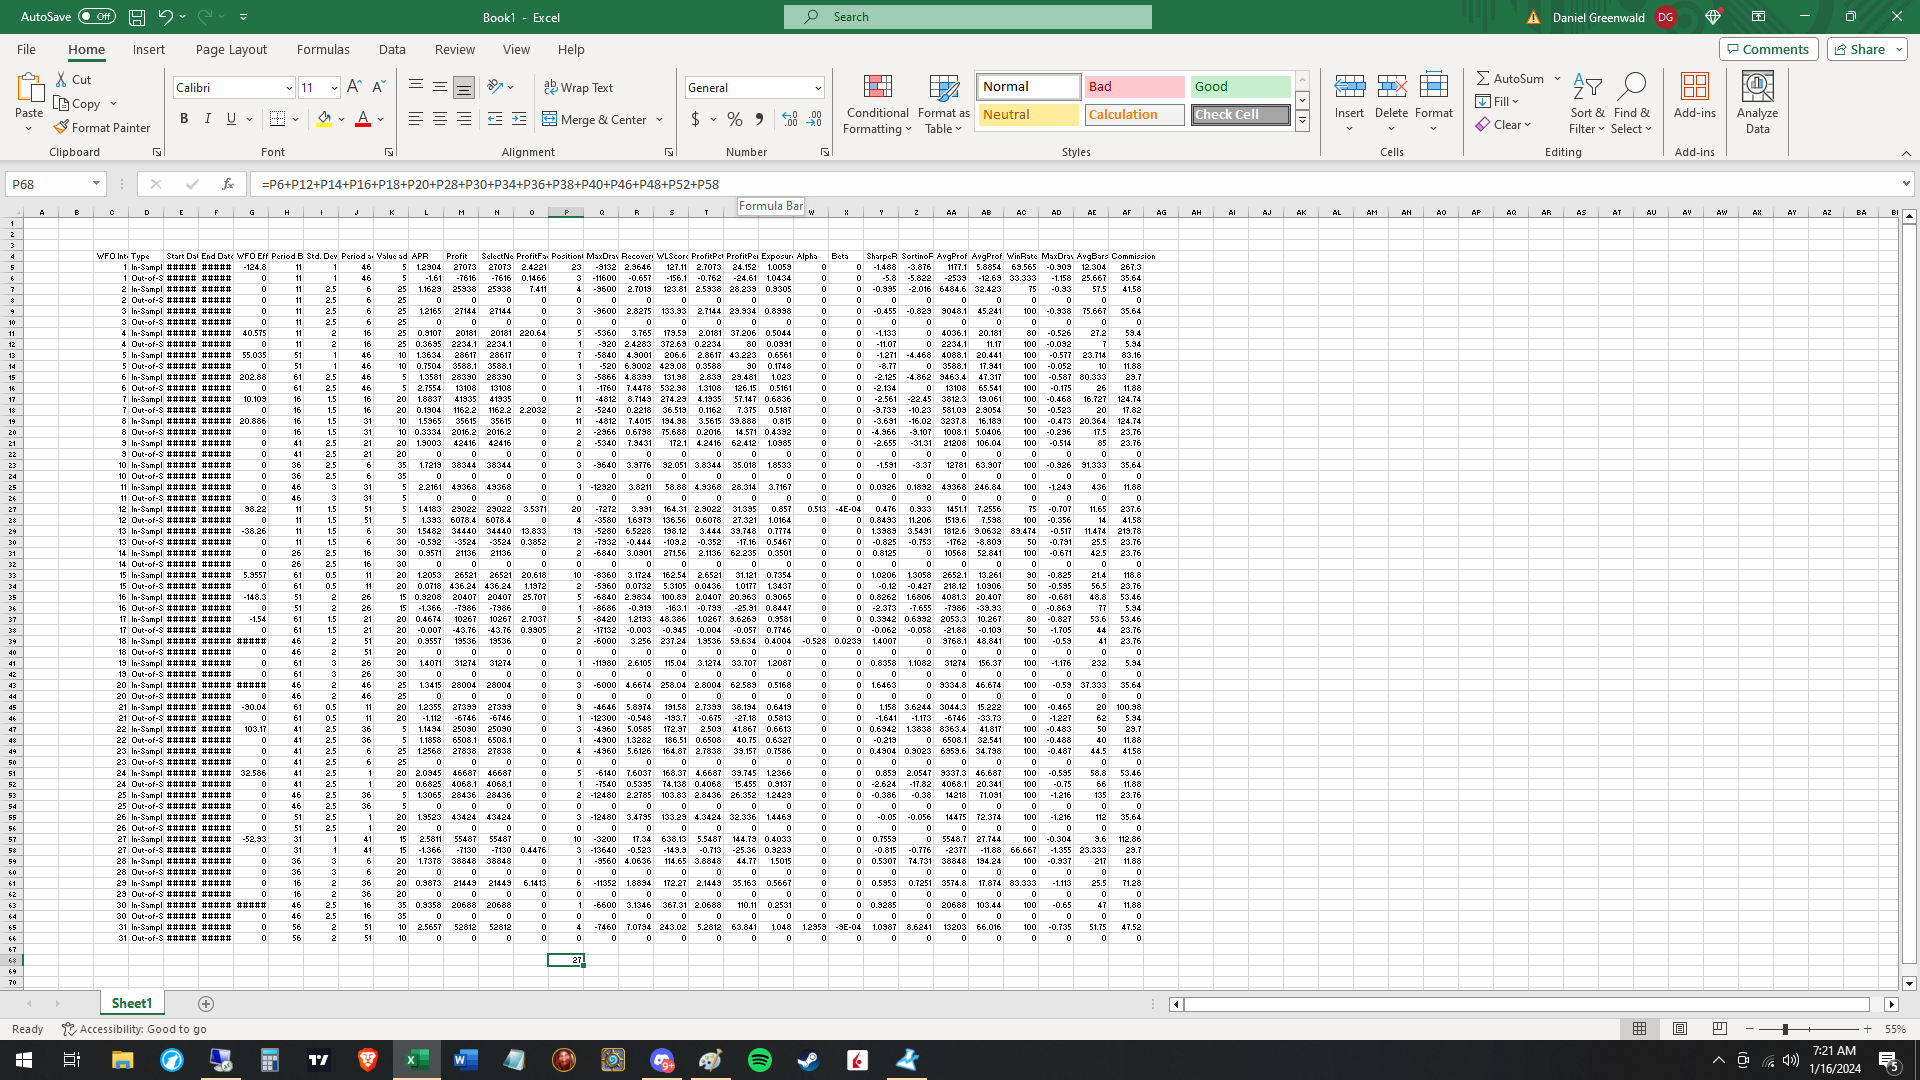
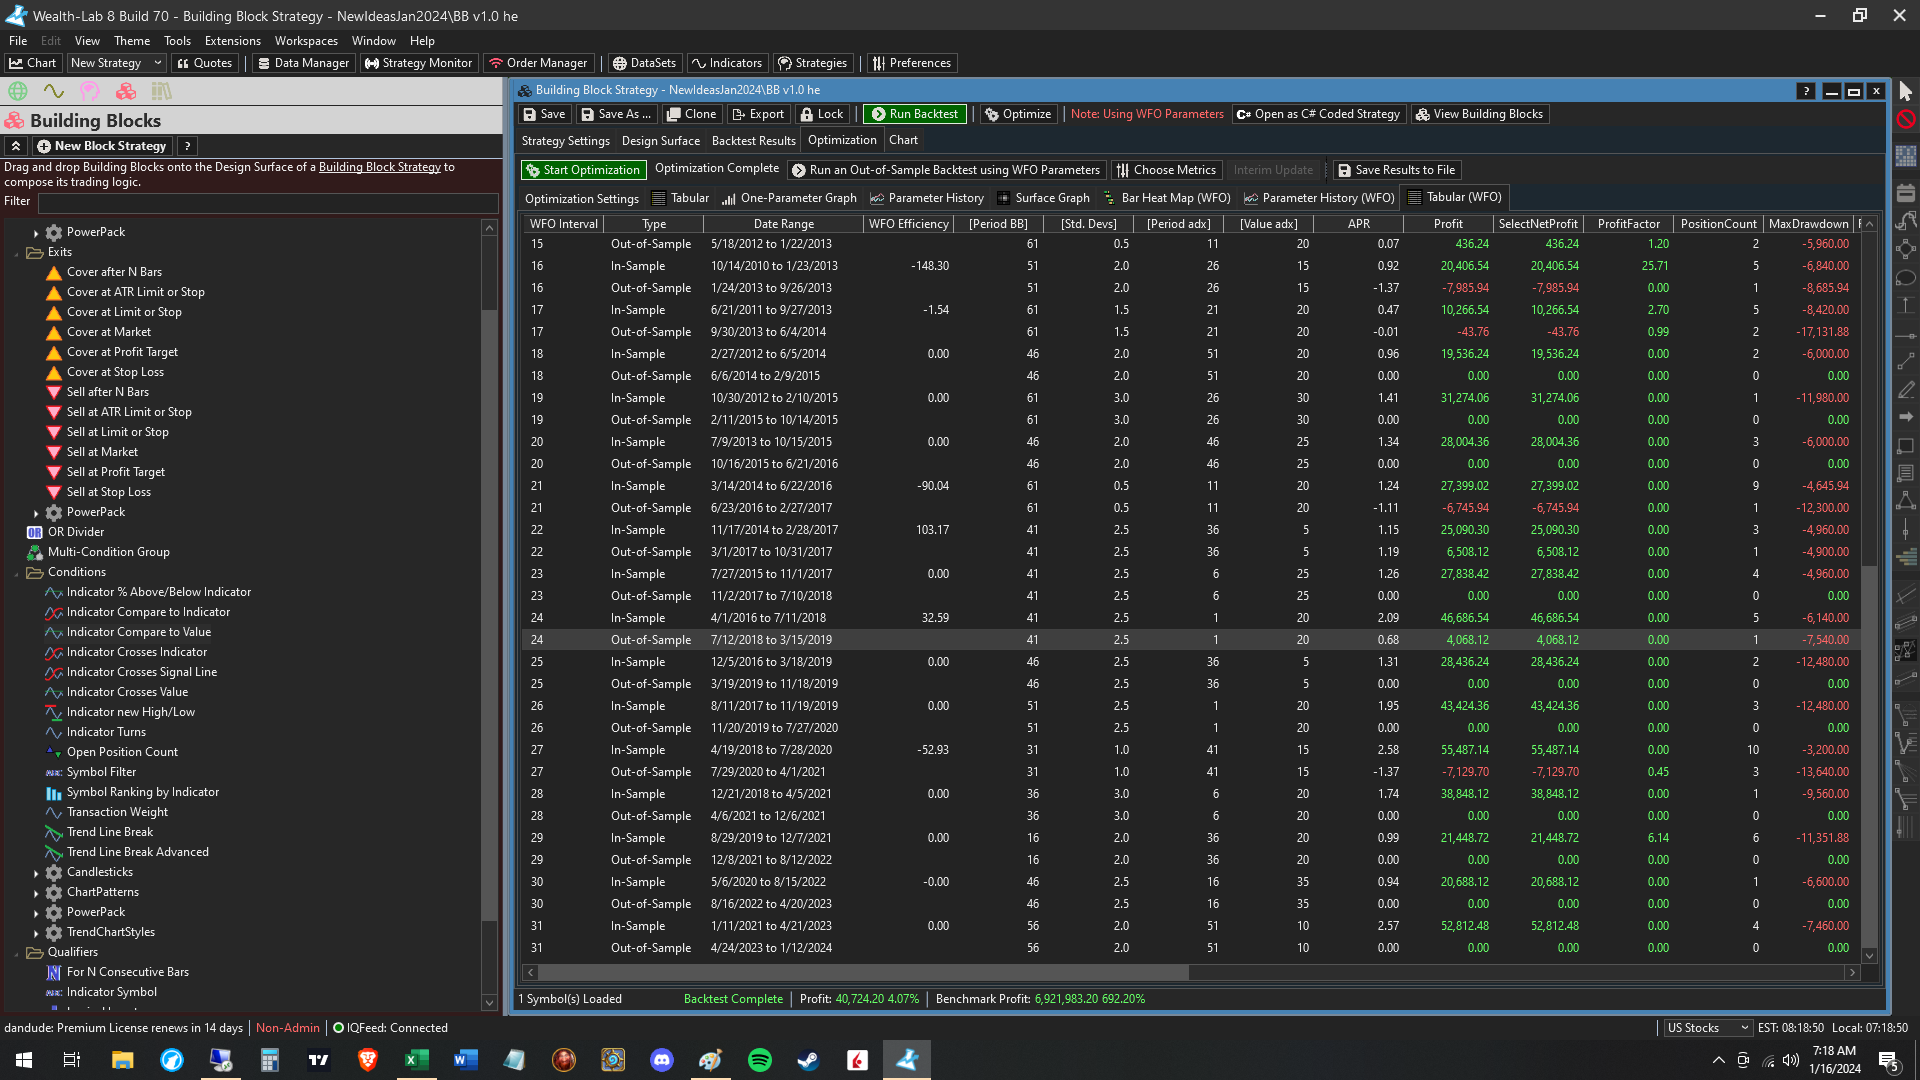
The position count of the tabular using excel:
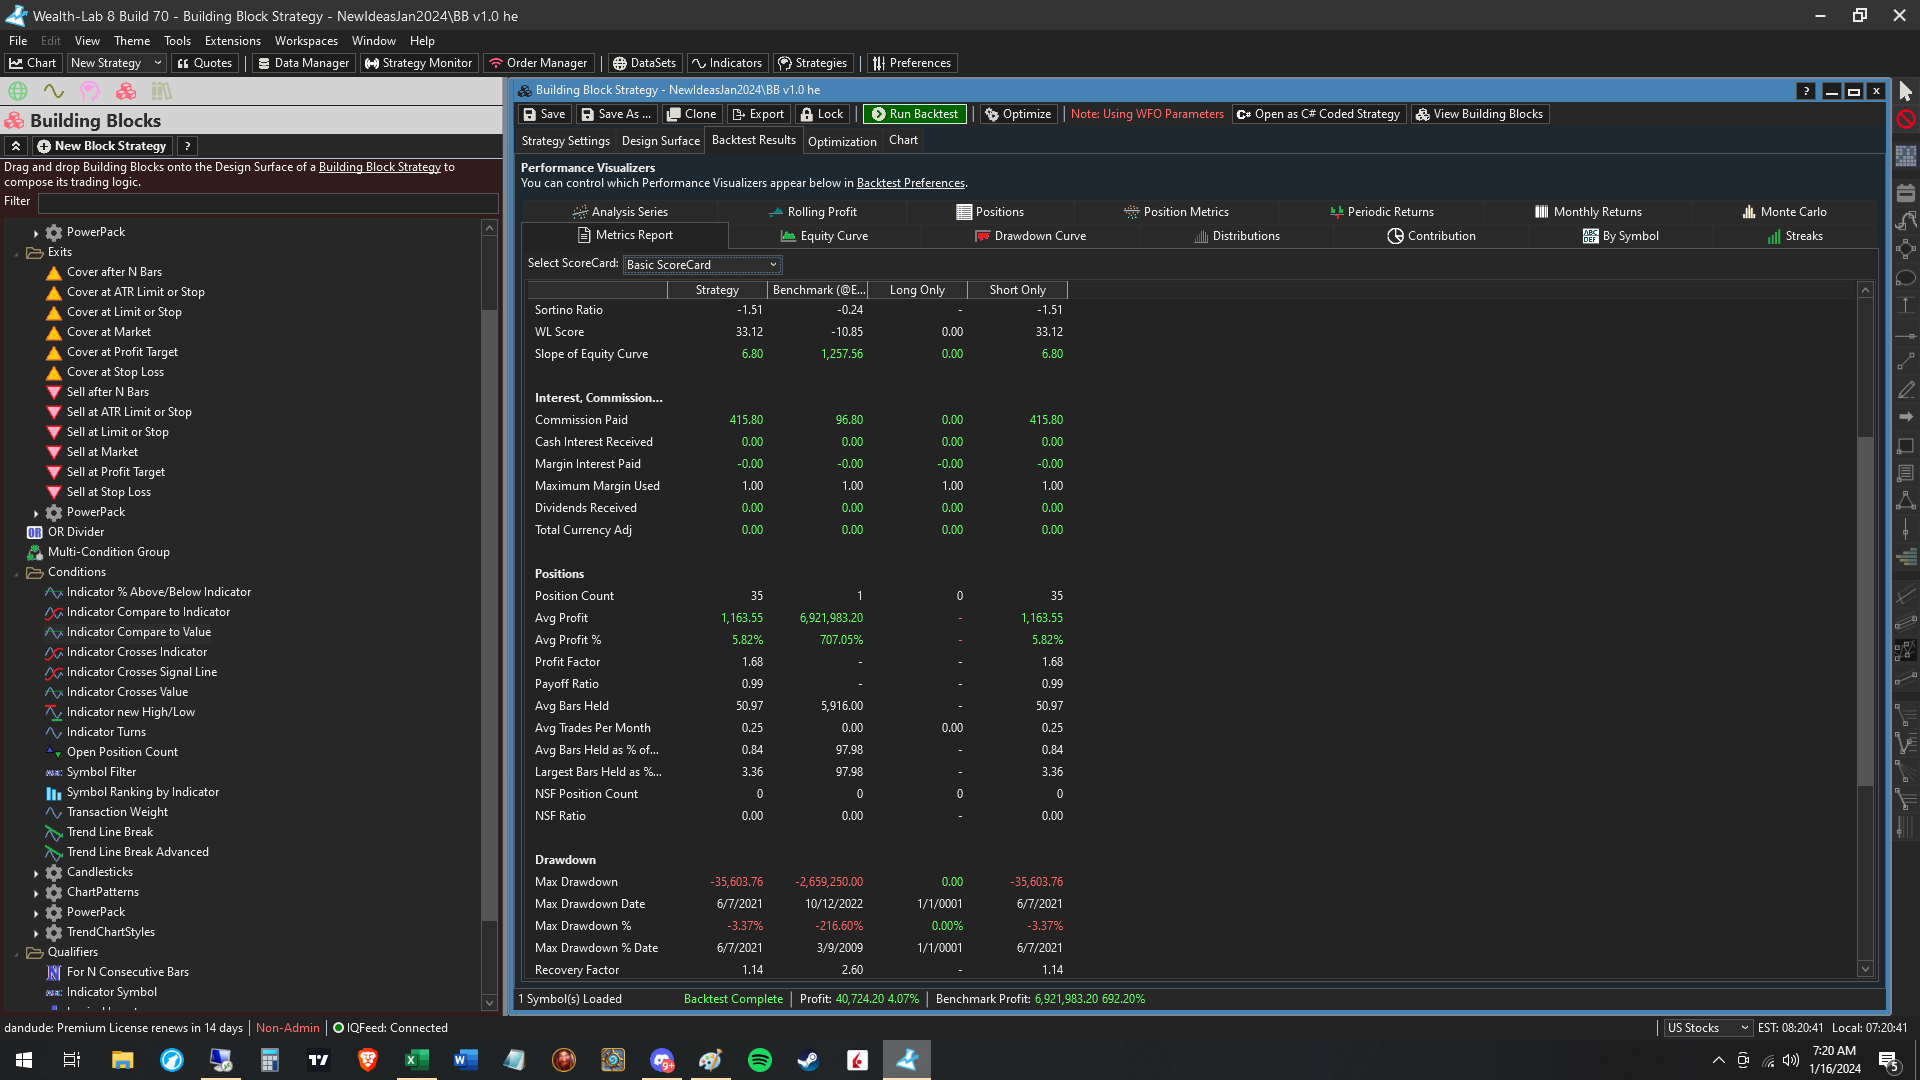
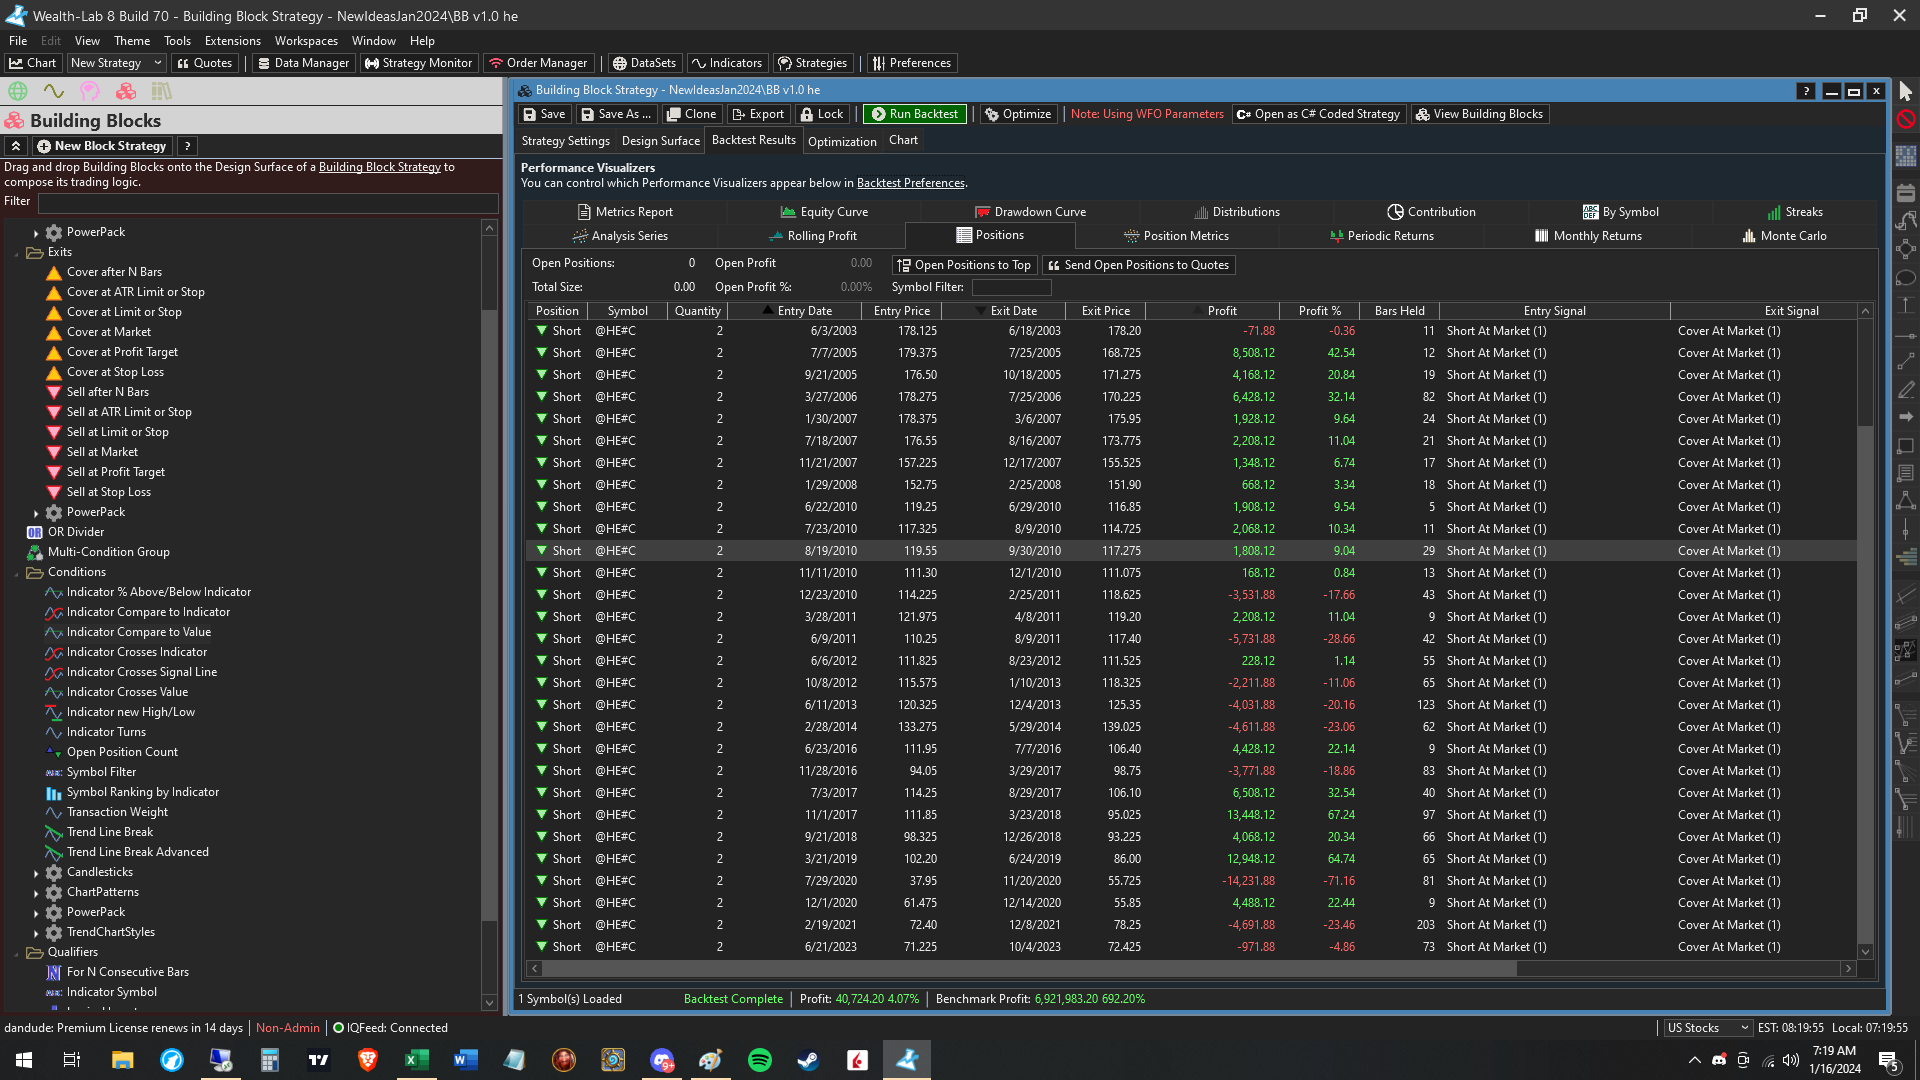
The position count in the backtest:
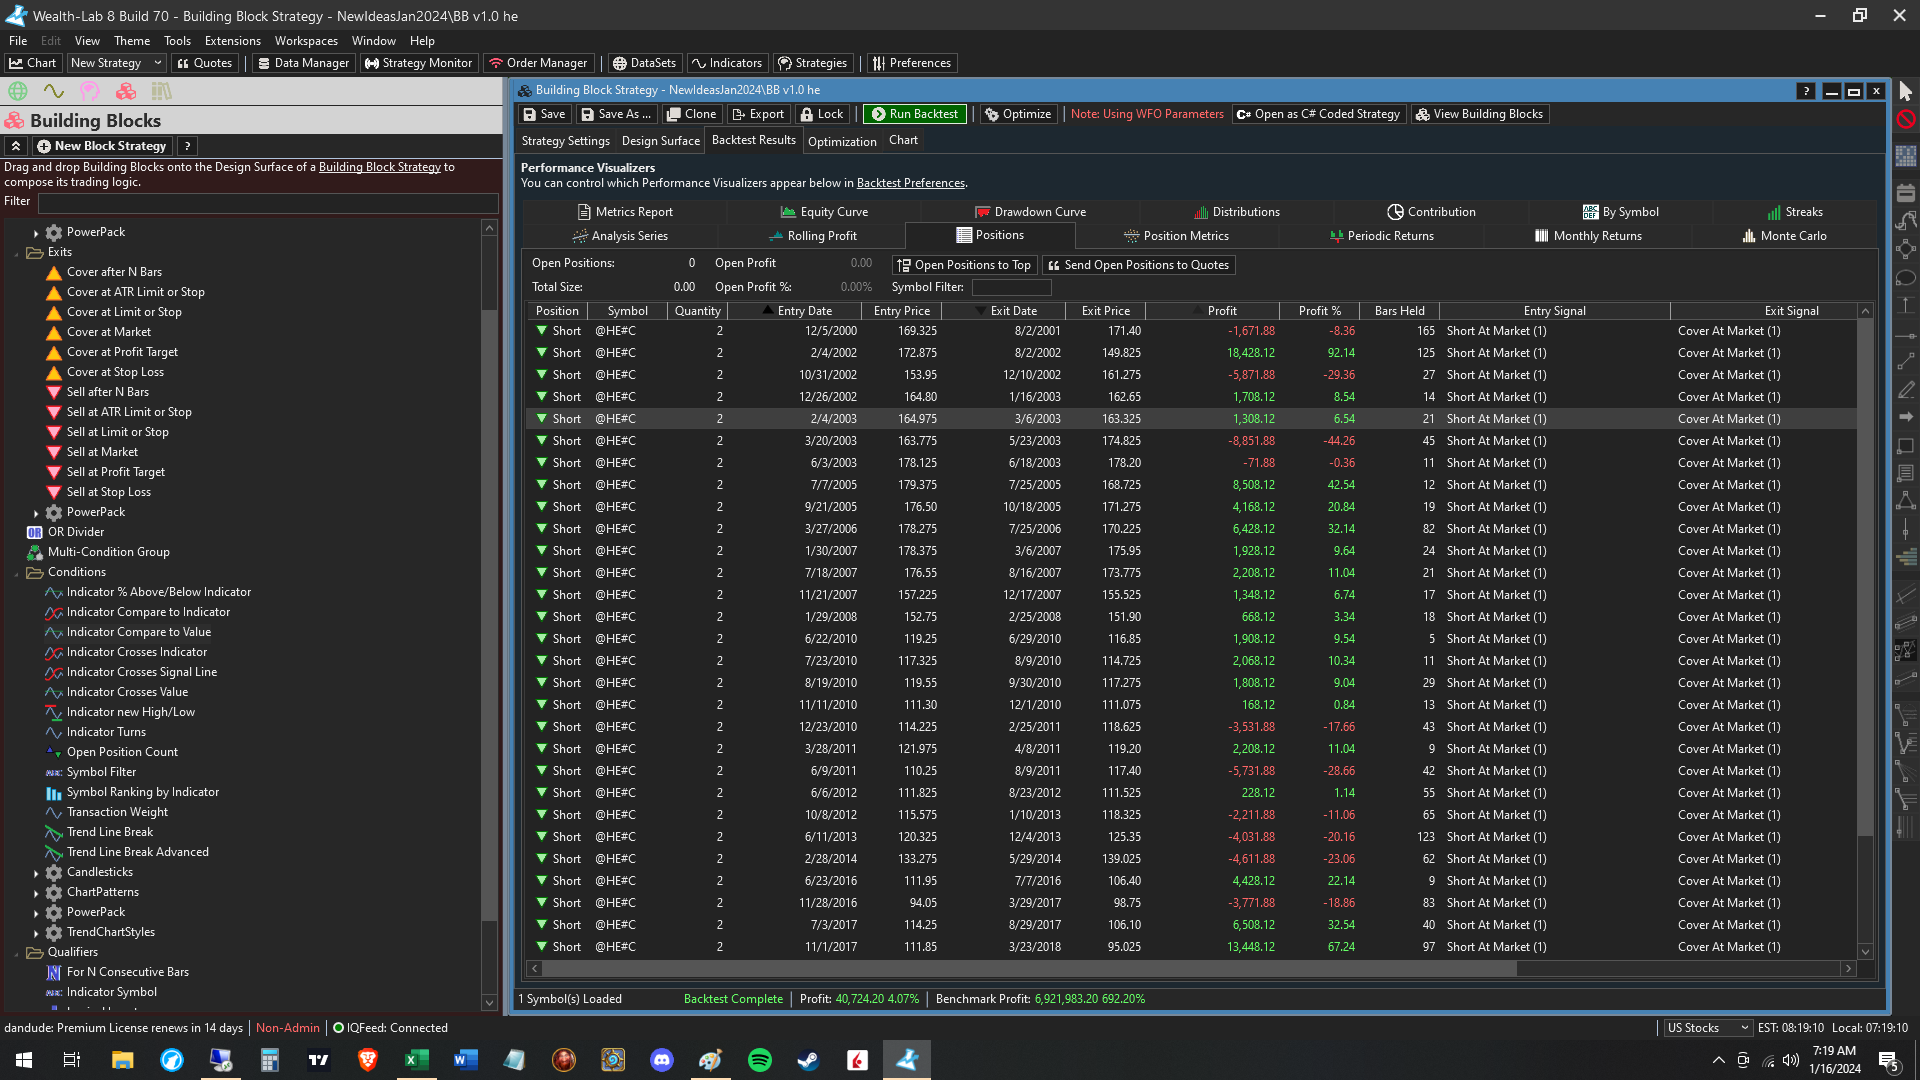
The extra position not shown in the tabular:
I am running into some weird issues when I am comparing my backtest results to the results displayed in the WFO tabular. I exported the tabular to an excel spreadsheet and it showed there should be only 27 positions in the OOS backtest. However, the backtest shows 35 positions.
I realized that the start date on the "Run an OOS backtest with the WFO parameters" button is at the beginning of the period of the entire data set (Asking this to be changed in another post/FeatureRequest). I then changed the start date to be the same as the beginning of the OOS data. However, I still got 31 positions. I found there was one position that did not show up in the Tabular at the end of the data. This still gives at least three positions that are showing up in the middle of the backtest but are not accounted for in the Tabular.
All of this discrepancy is making me wonder how accurate the OOS backtest actually is. Or is the tabular displaying incorrectly? Either way, it is concerning.
Here is a series of screenshots showing what I described above.
The position count of the tabular using excel:
The position count in the backtest:
The extra position not shown in the tabular:
Rename
Sorry here is the missing position in the backtest:
It’s not surprising at all that it will have different positions. What happens early in the backtest will impact what positions can be taken later on.
While that might be the case for many strategies, I don't believe that is the case here. This strategy is very simple and is overcapitalized. The only conditions are based on the price and the exits will occur at the same time regardless of the entry time.
I guess the question is how do I replicate what is shown in the tabular? The backtest button at the top does not do it, nor did changing the date to coincide with the OOS data start date.
I guess the question is how do I replicate what is shown in the tabular? The backtest button at the top does not do it, nor did changing the date to coincide with the OOS data start date.
You can right click on the row and select Run Backtest on this Period
Ok so the tabular is showing individual backtests of each OOS period, while the full backtest is just one test. This might explain the difference as the big test would be in a position but the individual periods might have to make another entry to get into the position. I would expect that that would give the large backtest fewer positions, but anything is possible. I will have to investigate a bit more.
QUOTE:That's the whole point of that test. Also keep in mind that a Position that starts a trade with one set of parameters may end the trade with a different set if it's still active on the date that the parameters change to the new optimized values. There is no 1-to-1 comparison here.
the full backtest is just one test.
In a WFO that generated (by chance) the same parameters for all intervals I detected that "Run an Out-of-Sample Backtest using WFO Parameters" did not get the sampe results as a backtest with these parameters as "Standard Opt Params".
Going deeper into that I found out that changing the Standard Opt Params altered result of "Run an Out-of-Sample Backtest using WFO Parameters". Checking the positions I suppose that for the out-of-sample intervals the "WFO Opt Params" are used, but for the first, for the in-sample period the parameters are the "Standard Opt Params", not, as I expected, the WFO Parameters of the in-sample period.
As a workaround I can enter the in-sample parameters of interval 1 als "Standard Opt Params" to get the result I expect in the backtest using WFO parameters.
But is using the "Standard Opt Params" for the in-sample period of interval 1 intended or is it to be expected that in future builds the WFO parameters of interval 1 are used for the backtest with WFO parameters?
The first window of the backtest will use Standard Opt Parameters, and the first WFO window parameters will only come into play at the start date of WFO window 1 out-of-sample date. This is because it wouldn't be fair to use the WFO window parameters during the in-sample period.
I can live with that, though the behaviour of the system is not intuitive to me.
When I use a button "Run an Out-of-Sample Backtest using WFO Parameters" I would expect that the WFO parameters are really used, not a mixture of standard opt parameters and WFO parameters.
In order to get consistent results, the handling for me is now:
1. Run the WFO
2. Copy the obained parameter results of the first interval of the WFO to the standard opt parameters
3. then make a backtest using WFO parameters.
Your Response
Post
Edit Post
Login is required