Hello!
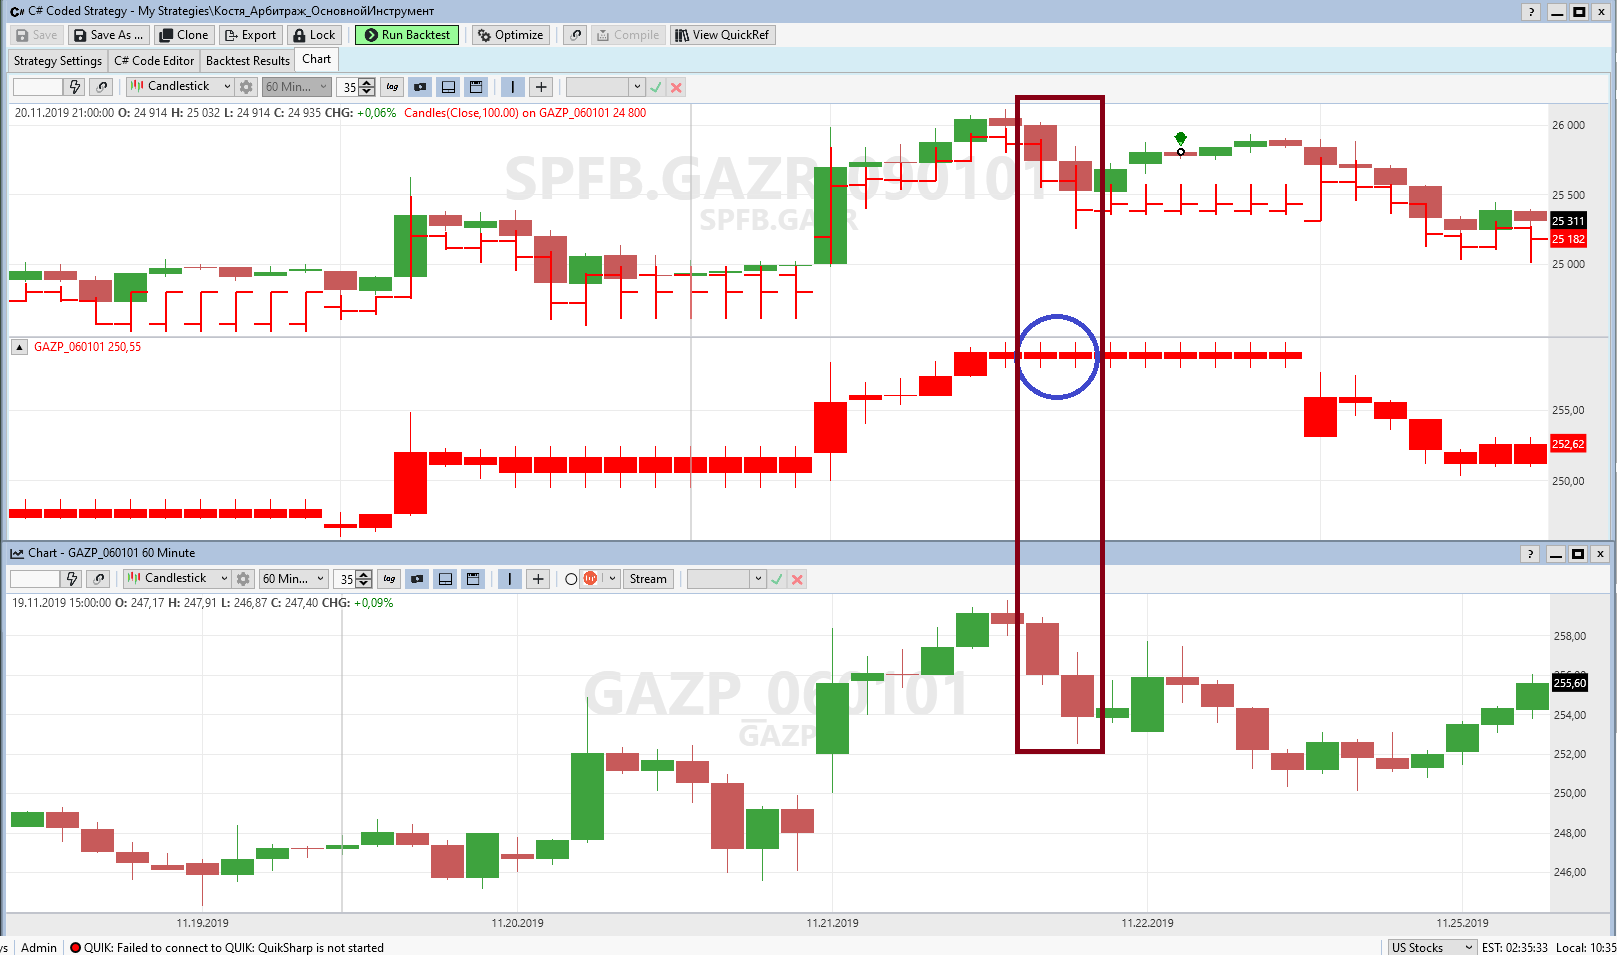
I'm trying to display some candles on a chart of other candles in this way:
qqq = GetHistory(bars, "GAZP_060101", "FinamFutures5Min");
PlotBarHistory(qqq, "GAZP_060101", WLColor.Red);
However, I see that there are no candles on the chart that should be there. I also made my own indicator that does not have this problem: red bars on the top chart.
Tell me, what’s wrong with the above method of obtaining and drawing candles?
Rename
We don't know the source of any data that you're showing.
We don't know if the 60-minute primary chart is unscaled.
We don't know if the 60-minute chart is scaled using the same 5-minute data that it appears you're accessing with "GetHistory".
In any case, you'll have to answer those questions and send us your data files to investigate it.
We don't know if the 60-minute primary chart is unscaled.
We don't know if the 60-minute chart is scaled using the same 5-minute data that it appears you're accessing with "GetHistory".
In any case, you'll have to answer those questions and send us your data files to investigate it.
Cone, hi!
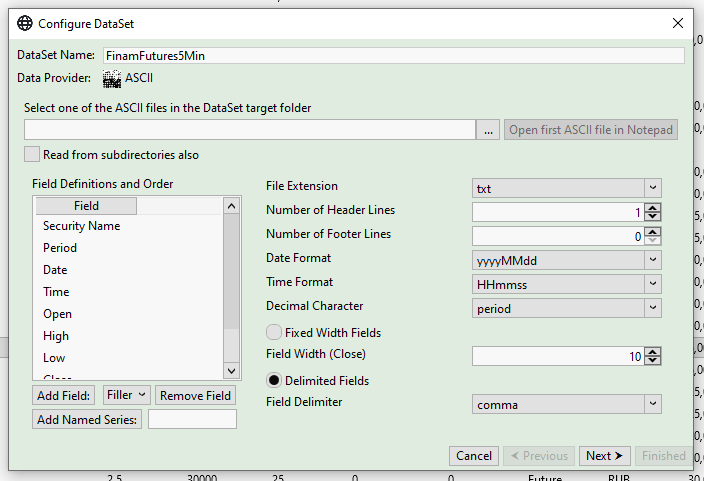
I am sending you the data for testing:
SPFB.GAZR_090101.txt
https://drive.google.com/file/d/1tOpcdEj54L2A0X-vfmZ9c3znv-wt3T18/view?usp=sharing
GAZP_060101.txt
https://drive.google.com/file/d/12xh3TERiQmIPqQu3JGfb5knOQda9ZpTd/view?usp=sharing
Strategy code:
Indicator code:
I am sending you the data for testing:
SPFB.GAZR_090101.txt
https://drive.google.com/file/d/1tOpcdEj54L2A0X-vfmZ9c3znv-wt3T18/view?usp=sharing
GAZP_060101.txt
https://drive.google.com/file/d/12xh3TERiQmIPqQu3JGfb5knOQda9ZpTd/view?usp=sharing
Strategy code:
CODE:

using WealthLab.Backtest;
using System;
using WealthLab.Core;
using WealthLab.Data;
using WealthLab.Indicators;
using System.Collections.Generic;


namespace WealthScript1
{
    public class MyStrategy : UserStrategyBase
    {
       public MyStrategy() : base()
        {
            StartIndex = 0;

         AddParameter("PeriodEMA", ParameterType.Int32, 30, 5, 150, 5);
         AddParameter("BarsToClose", ParameterType.Int32, 30, 20, 100, 5);
         AddParameter("Trashold", ParameterType.Double, 200, 30, 2000, 10);
        }

        public override void Initialize(BarHistory bars)
        {
         indicator = new MathIndOpInd(bars,new MathIndOpValue(bars, new SymbolInd(bars,new TimeSeriesIndicatorWrapper(bars.Close),"GAZP_060101"),MathOperation.Multiply,100),MathOperation.Subtract,new TimeSeriesIndicatorWrapper(bars.Close),1.00);

         indicator =new TimeSeriesIndicatorWrapper(indicator.Abs());

         indicatorSecondSymbol = new SymbolInd(bars,new Candles(bars,PriceComponent.Close,100.00),"GAZP_060101");

         indicatorEMA = new EMA(indicator, Parameters[0].AsInt);

         qqq = GetHistory(bars, "GAZP_060101", "FinamFutures5Min");

         PlotBarHistory(qqq, "GAZP_060101", WLColor.Red);

         //PlotIndicator(indicatorEMA,new WLColor(255,0,0),PlotStyle.Line,false,"Arbitrage");

         //PlotIndicator(indicator,new WLColor(0,0,0),PlotStyle.Line,false,"Arbitrage");

         PlotIndicator(indicatorSecondSymbol,new WLColor(255,0,0),PlotStyle.BarChart,false,"Price");

        }

        public override void Execute(BarHistory bars, int idx)
        {
         int index = idx;
         Position foundPosition0 = FindOpenPosition(transaction1Tag);

         bool condition0;

         if (idx == 0)
         {
            //qqq = GetHistory(bars, "SPFB.SI_090101");
         }

         if (foundPosition0 == null)
         {
            condition0 = false;
            {
               if (indicator[index] > indicatorEMA[index]+Parameters[2].AsDouble)
               {
                  condition0 = true;
               }
            }
            if (condition0)
            {
               _transaction1 = PlaceTrade(bars, TransactionType.Short, OrderType.Market, 0, 0, "Short At Market (1)");
               transaction1Tag =_transaction1.PositionTag;

               _transaction2 = PlaceTrade(qqq, TransactionType.Buy, OrderType.Market, 0, 0, "Buy At Market (1)");
               DrawDot(idx+1,qqq.Open[idx+1]*100,WLColor.Green, 5);

               string str ="";

               for (int i = 0; i < 10; i++)
               {
                  str = str + "  " + "Buy" + " " + qqq.Open[idx+1-i] * 100 + " " + qqq.DateTimes[idx + 1-i] + " " + qqq.Close[idx + 1-i] * 100+"\n";
               }

               //DrawText(str, idx+1, qqq.Open[idx+1]*100, WLColor.Black, 16);

               //DrawBarAnnotation("  "+"Buy"+" "+qqq.Open[idx+1]*100+" "+qqq.DateTimes[idx+1]+" "+qqq.Close[idx+1]*100, idx+1, true, WLColor.Black, 16);

               transaction2Tag =_transaction2.PositionTag;

               _transaction2.Quantity =100;
            }
         }
         else
         {
            condition0 = false;
            {
               condition0 = true;
            }

            Backtester.CancelationCode = 109;
            if (idx - foundPosition0.EntryBar + 1 >= Parameters[1].AsInt)
            {
               PlaceTrade(qqq, TransactionType.Sell, OrderType.MarketClose, 0, "Sell"+qqq);
               PlaceTrade(bars, TransactionType.Cover, OrderType.MarketClose, 0, "Cover" + bars);
               DrawDot(idx+1,qqq.Open[idx+1]*100,WLColor.Yellow, 5);
            }
         }
        }

        public override void NewWFOInterval(BarHistory bars)
        {
         //indicator = new MathIndOpInd(bars,new SymbolInd(bars,new TimeSeriesIndicatorWrapper(bars.Close),"SPFB.GAZR_090101"),MathOperation.Subtract,new MathIndOpValue(bars,new TimeSeriesIndicatorWrapper(bars.Close),MathOperation.Multiply,100),1.00);

         //indicatorEMA = new EMA(indicator, Parameters[0].AsInt);

        }

      private IndicatorBase indicator;

      private IndicatorBase indicatorEMA;

      private IndicatorBase indicatorSecondSymbol;

      private Transaction _transaction1;

      private Transaction _transaction2;

      int transaction1Tag;

      int transaction2Tag;

      BarHistory qqq;
    }
}
Indicator code:
CODE:

using WealthLab.Core;
using System;
using System.Drawing;
using WealthLab.Indicators;

namespace WealthLab.Indicators
{

   //the VChart indicator
   public class Candles : IndicatorBase
   {
      //parameterless constructor
      public Candles() : base()
      {
      }

      //for code based construction
      public Candles(BarHistory source, PriceComponent pc, double PriceMultiplyer)
         : base()
      {
         Parameters[0].Value = source;
         Parameters[1].Value = pc;
         Parameters[2].Value = PriceMultiplyer;
         Populate();
      }

      //static method
      public static Candles Series(BarHistory source, PriceComponent pc, double PriceMultiplyer)
      {
         string key = CacheKey("Candles", pc);
         if (source.Cache.ContainsKey(key))
            return (Candles)source.Cache[key];
         Candles vchart = new Candles(source, pc, PriceMultiplyer);
         source.Cache[key] = vchart;
         return vchart;
      }

      //Name
      public override string Name => "Value Chart";

      //Abbreviation
      public override string Abbreviation => "Candles";

      //description
      public override string HelpDescription => "The Value Charts indicator developed by Mark W. Helweg. Applies a volatility based detrending to the source price component.";

      //pane
      public override string PaneTag => "Candles";

      //access price component used
      public PriceComponent PriceComponent1 => Parameters[1].AsPriceComponent;

      //default color
      public override WLColor DefaultColor => WLColor.Red;

      //default plot style
      public override PlotStyle DefaultPlotStyle => PlotStyle.BarChart;

      //populate
      public override void Populate()
      {
         //get parameter values
         BarHistory source = Parameters[0].AsBarHistory;

         //BarHistory bh = new BarHistory("RI.RVI_1MIN_150505", Frequency.Minute);

         //BarHistory bh = GetHistory(bars, "RI.RVI_1MIN_150505");

         if (source == null)
            return;
         PriceComponent pc = Parameters[1].AsPriceComponent;

         //set datetimes
         DateTimes = source.DateTimes;

         switch (pc)
         {
            case PriceComponent.Open:
               for (int n = 0; n < source.Close.Count; n++)
               {
                  Values[n] = source.Open[n]*Parameters[2].AsDouble;
               }
               break;

            case PriceComponent.High:
               for (int n = 0; n < source.Close.Count; n++)
               {
                  Values[n] = source.High[n] *Parameters[2].AsDouble;
               }
               break;

            case PriceComponent.Low:
               for (int n = 0; n < source.Close.Count; n++)
               {
                  Values[n] = source.Low[n]*Parameters[2].AsDouble;
               }
               break;

            case PriceComponent.Close:
               for (int n = 0; n < source.Close.Count; n++)
               {
                  Values[n] = source.Close[n]*Parameters[2].AsDouble;
               }
               break;

            case PriceComponent.Volume:
               for (int n = 0; n < source.Close.Count; n++)
               {
                  Values[n] = source.Volume[n];
               }
               break;

            default:

               break;
         }
      }

      //generate parameters
      protected override void GenerateParameters()
      {
         AddParameter("Source", ParameterType.BarHistory, null);
         AddParameter("Price Component", ParameterType.PriceComponent, PriceComponent.Close);
         AddParameter("Price Multiplyer", ParameterType.Double, 1);
      }

      //get corresponding bar chart companion indicator
      public override IndicatorBase GetBarChartCompanion(PriceComponent pc)
      {
         if (PriceComponent1 == pc)
            return this;
         return new Candles(Parameters[0].AsBarHistory, pc, Parameters[2].AsDouble);
      }
   }
}
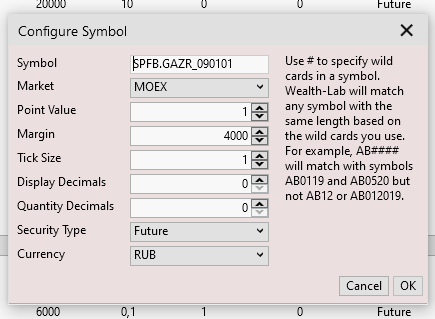
I think you must have not set up the [MOEX] market correctly for the external symbol.
If you do this should be the result -
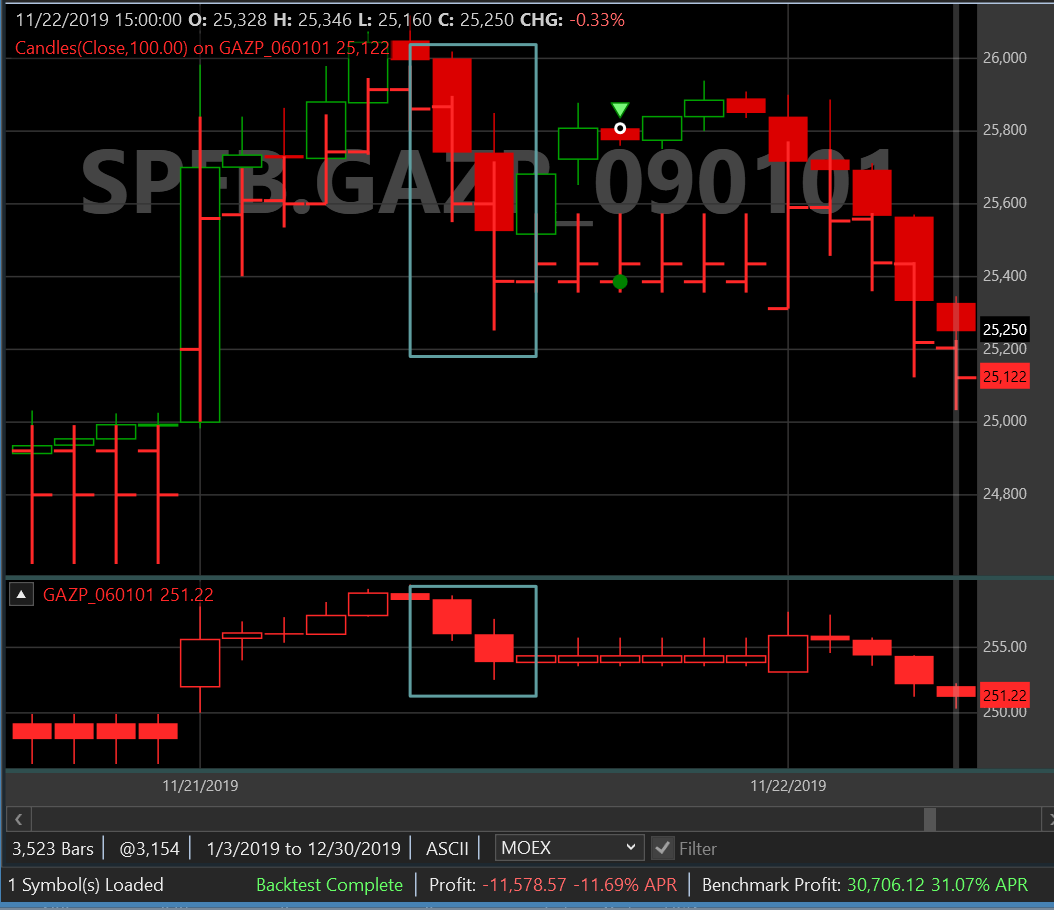
If you do this should be the result -
Cone, hi!
Please tell me exactly what settings need to be changed for everything to work.
Please tell me exactly what settings need to be changed for everything to work.
If the data provider does not specify the market, the market defaults to "US Stocks". The ASCII provider does not specify a symbol's market (but that would be a good option to include when setting up the DataSet).
You need add your symbols in Market & Symbols so that WL knows which market to apply.
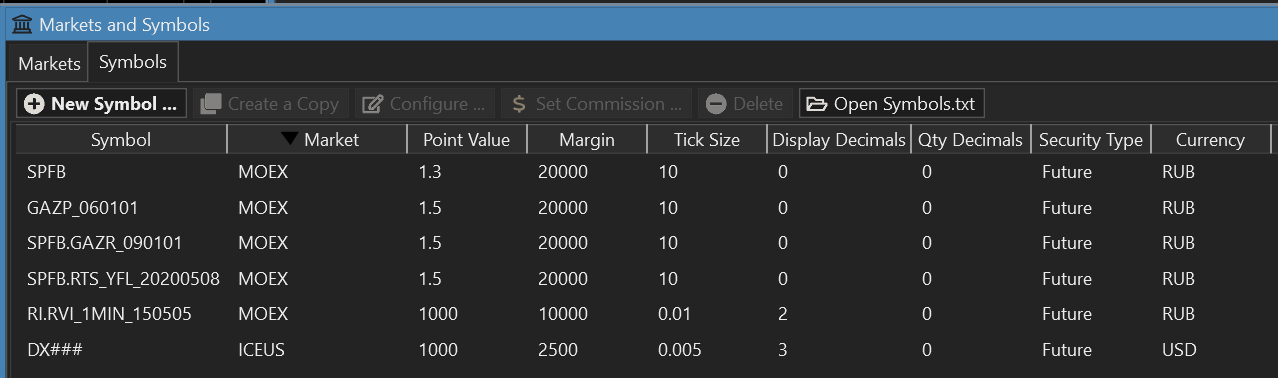
Note:
# is a wildcard that that matches any single character.
You need add your symbols in Market & Symbols so that WL knows which market to apply.
Note:
# is a wildcard that that matches any single character.
Cone, hi!
Here are the settings.
Please tell me what is wrong with them?
Here are the settings.
Please tell me what is wrong with them?
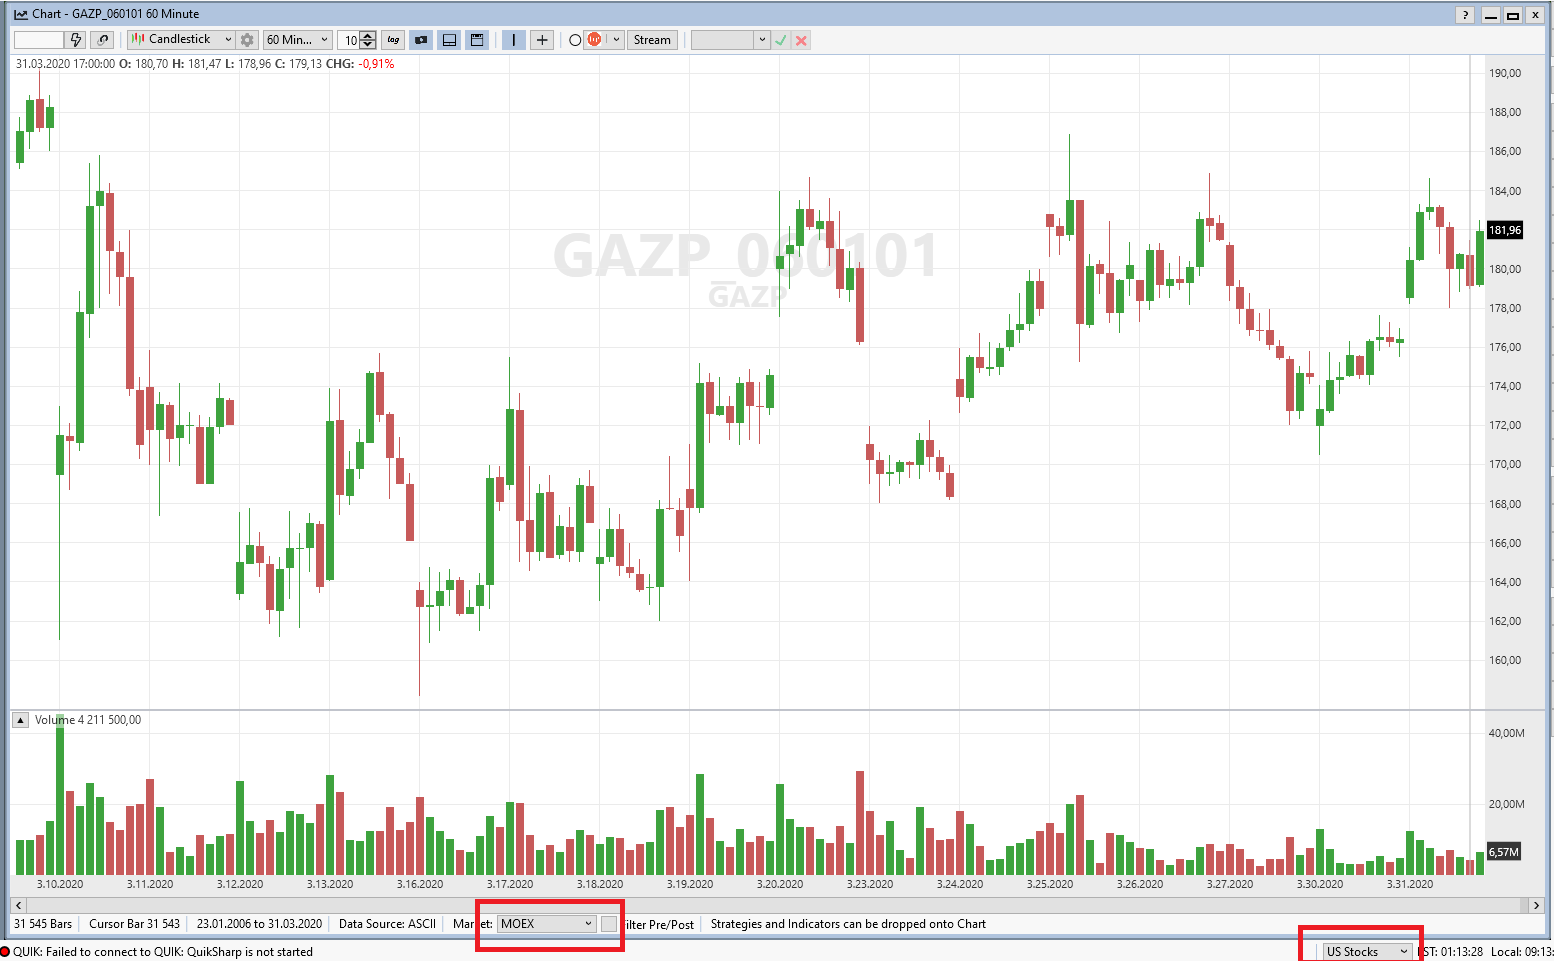
The first problem is that the bottom of your chart in Post #1 shows "US Stocks" for SPFB.GAZR...
So at that time it was not assigned to MOEX. If you didn't have to change anything, make sure that there's not a whitespace at the end of SPFB.GAZR... in the Symbols manager.
Several days ago I noticed that we don't Trim() symbols in that dialog (we will now), so if there's a whitespace at the end of the symbol, it won't match.
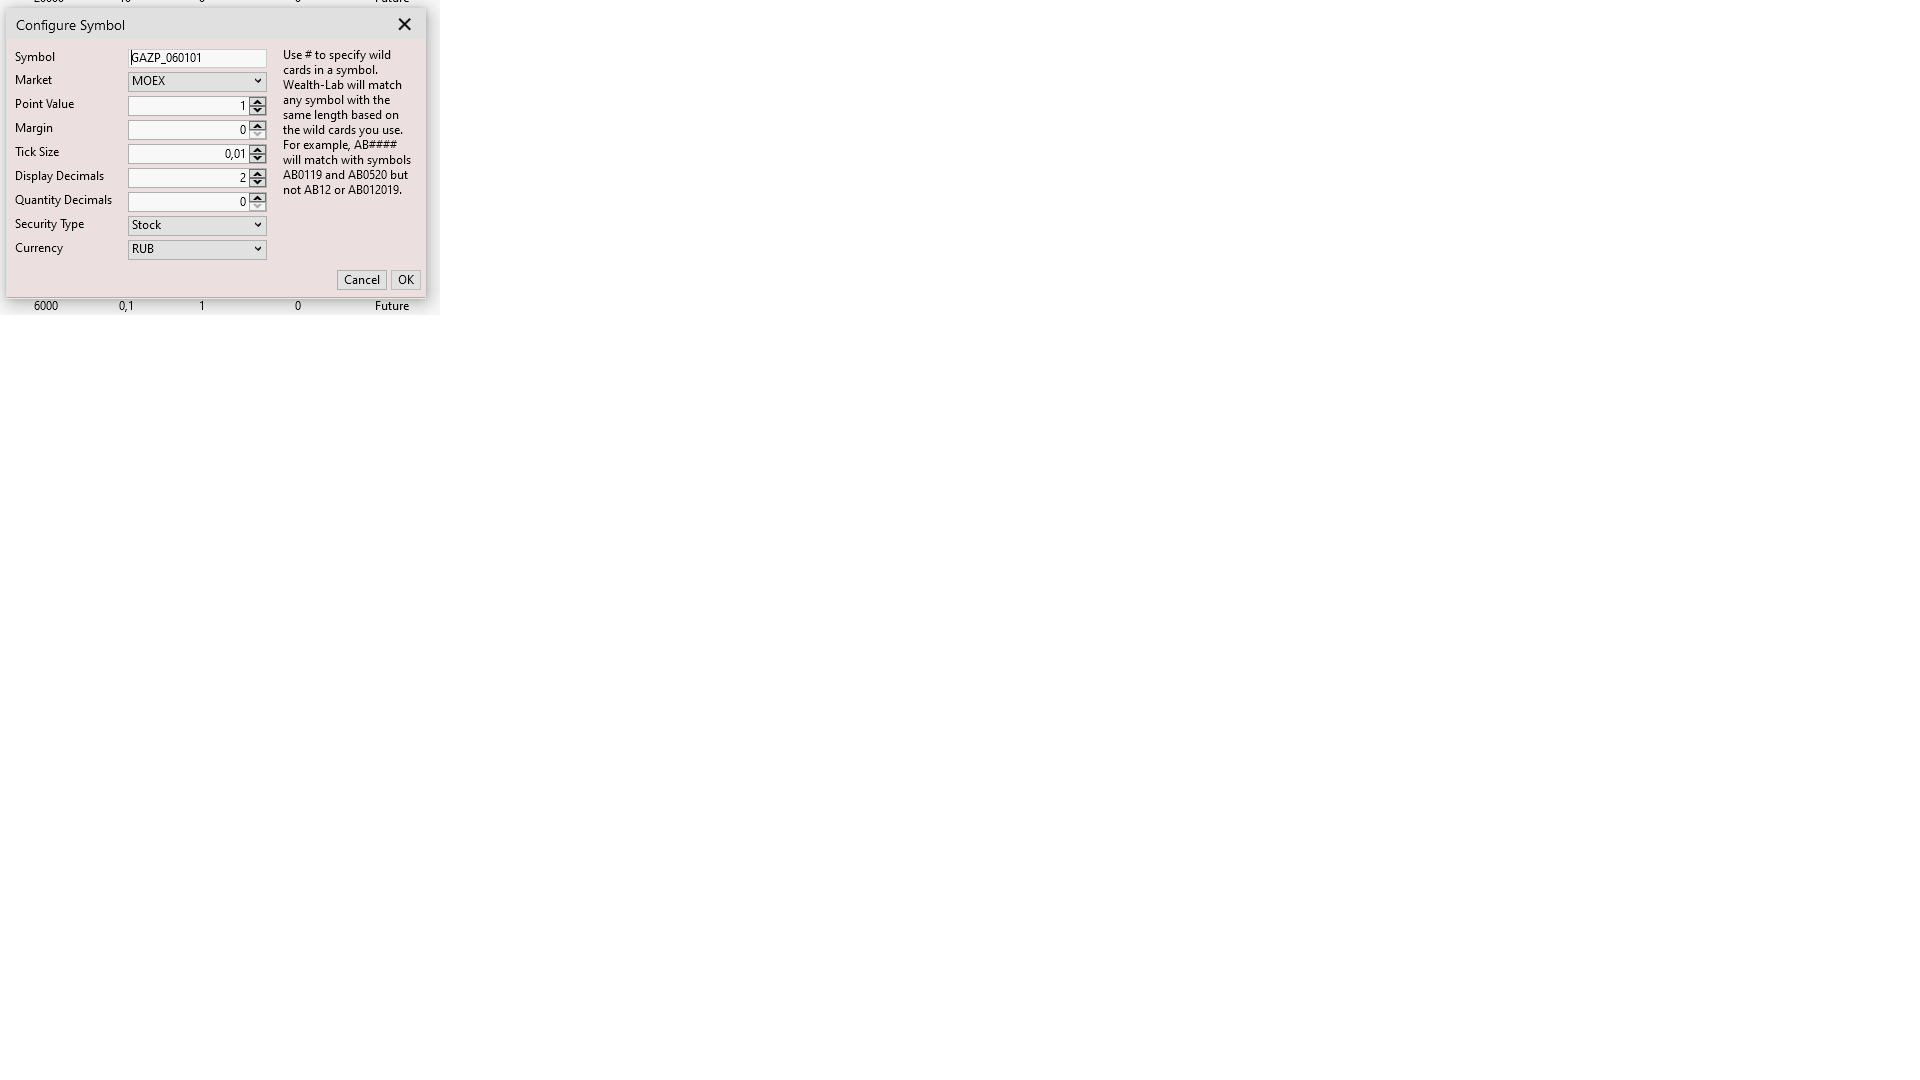
The GAZP_.. symbol also needs to be assigned to MOEX.
So at that time it was not assigned to MOEX. If you didn't have to change anything, make sure that there's not a whitespace at the end of SPFB.GAZR... in the Symbols manager.
Several days ago I noticed that we don't Trim() symbols in that dialog (we will now), so if there's a whitespace at the end of the symbol, it won't match.
The GAZP_.. symbol also needs to be assigned to MOEX.
Cone, hi!
You can't see it in the first screenshot, but GAZP_060101 is set to MOEX. Also the SPFB.GAZR_090101 tool is configured for MOEX too.
I didn't change the settings.
You can't see it in the first screenshot, but GAZP_060101 is set to MOEX. Also the SPFB.GAZR_090101 tool is configured for MOEX too.
I didn't change the settings.
This symbol won't match because there's a whitespace at the end of it.
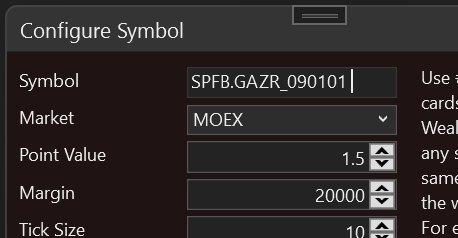
Did you check for white spaces?
fwiw, white spaces will be trimmed off starting at build 62.
Did you check for white spaces?
fwiw, white spaces will be trimmed off starting at build 62.
I checked it again. There are no spaces.
I mistook the market in the first image as if it were in the status bar of the chart - it's just the market for the WealthLab clock.
I cannot explain how we can have different results with the same settings and data.
You're using Build 61?
I cannot explain how we can have different results with the same settings and data.
You're using Build 61?
QUOTE:
You're using Build 61?
Yes he is.
Hi all!
Eugene is right, I use build 61.
Eugene is right, I use build 61.
Your Response
Post
Edit Post
Login is required