Hello everyone,
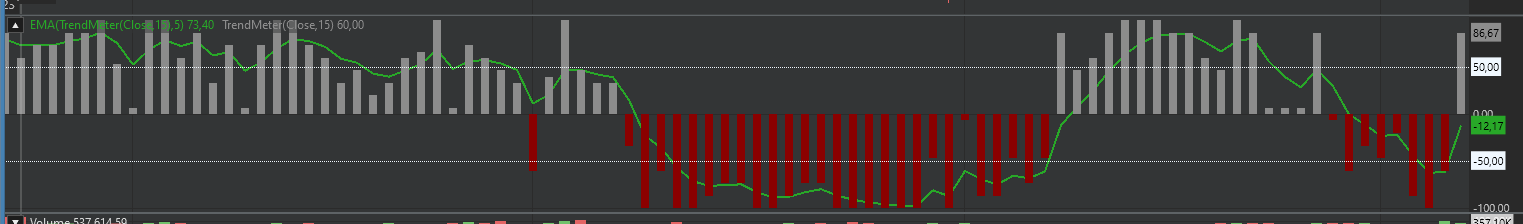
I've recently come across the TrendMeter indicator, a tool that seems quite useful for gauging market trends over a specified period. From what I understand, the TrendMeter provides a percentage that represents the proportion of bullish or bearish bars within a given timeframe, helping to indicate whether the market trend is up or down.
However, I'm curious about the specifics of its calculations and functionality. For example, if the TrendMeter shows a value of 30% in an uptrend scenario, does this mean that, within the considered period, only 30% of the bars were bullish? My question is, how does it determine if the bar should be above or below zero?
Rename
I realized that the description provided for the indicator might be incomplete. I discovered that the reference basis for the positive or negative bars is the SMA of the considered period, and not just a direct comparison with previous closings, as initially assumed.
The height of each bar represents the percentage of periods that close in the direction of the trend relative to the total in the considered period.
I am exploring the use of different types of smoothers other than the SMA for constructing this indicator.
The height of each bar represents the percentage of periods that close in the direction of the trend relative to the total in the considered period.
I am exploring the use of different types of smoothers other than the SMA for constructing this indicator.
Here's the Description:
To measure the strength of a trend, calculates the percentage of times the value was greater than (for an uptrend) or less than (for a down trend). Returns a value in the range of 100 (for the strongest possible uptrend) to -100 (for the strongest downtrend).
It's completely accurate, but it would be clearer if it said, ".. percentage of times the current value was greater than.."
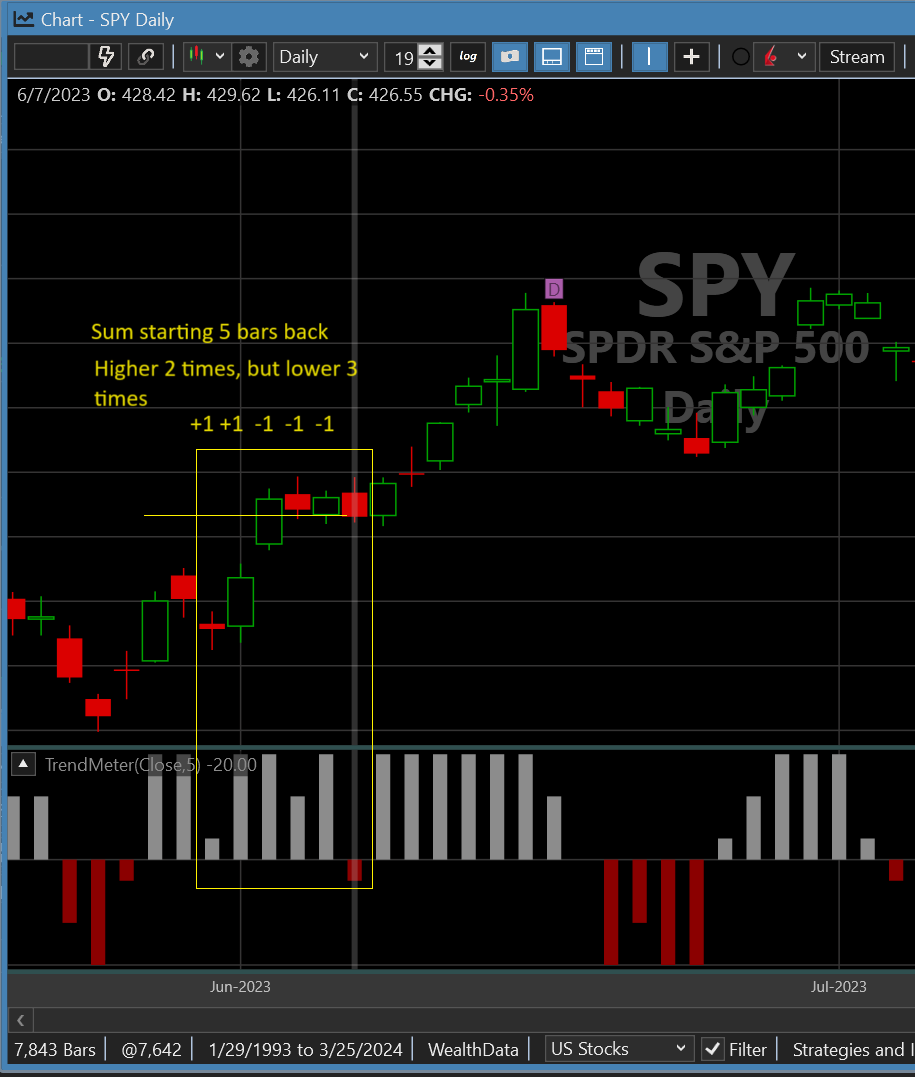
Example: Here's a 5-period TrendMeter for the Close series. Concentrating on the yellow box, visually SPY is in an uptrend, but the TrendMeter is at -20%. That's because the current Close is lower than 3 bars, but higher than 2. That's -1/5 x 100 = -20%.
To measure the strength of a trend, calculates the percentage of times the value was greater than (for an uptrend) or less than (for a down trend). Returns a value in the range of 100 (for the strongest possible uptrend) to -100 (for the strongest downtrend).
It's completely accurate, but it would be clearer if it said, ".. percentage of times the current value was greater than.."
Example: Here's a 5-period TrendMeter for the Close series. Concentrating on the yellow box, visually SPY is in an uptrend, but the TrendMeter is at -20%. That's because the current Close is lower than 3 bars, but higher than 2. That's -1/5 x 100 = -20%.
Updated description:
To measure the strength of a trend, TrendMeter calculates the percentage of times the current value is greater than or less than the previous values in the lookback period. Returns a value in the range of +100 (for the strongest possible uptrend) to -100 (for the strongest downtrend).
To measure the strength of a trend, TrendMeter calculates the percentage of times the current value is greater than or less than the previous values in the lookback period. Returns a value in the range of +100 (for the strongest possible uptrend) to -100 (for the strongest downtrend).
Thank you! Now I have understood.🙏🙏🙏
Your Response
Post
Edit Post
Login is required