It seems that plotting a Time Series is different in WL7 compared to WL6. I have a TimeSeries and want to change Plot colors depending on the TimeSeries[bar] value. The PlotStyles is Line. I don't see anything written on this.
Rename
In both WL6 and WL7 you accomplish this with the same method:
Code example will pop up upon clicking "Open example code" in the WL7 QuickRef.
CODE:
SetSeriesBarColor
Code example will pop up upon clicking "Open example code" in the WL7 QuickRef.
SetSeriesBarColor is for an indicator and not for a TimeSeries.
This works for an Indicator
This works very good. But for a TimeSeries I just get a black line using
It would seem that this should work for a TimeSeries
But now I just get a Blue line.
This works for an Indicator
CODE:
Plot(dso);
         for (int bar = 1; bar < bars.Count; bar++)
         {
            SetSeriesBarColor(dso, bar, dso[bar] > 0 ? Color.Green : dso[bar] < 0 ? Color.Red : Color.Black);
         }
This works very good. But for a TimeSeries I just get a black line using
CODE:
PlotTimeSeries(GainLoss, "Gain_Loss", "GainLosspane", Color.Green, PlotStyles.Line);
         for (int bar = 1; bar < bars.Count; bar++)
         {
            SetSeriesBarColor(GainLoss, bar, GainLoss[bar] > 0 ? Color.Green : GainLoss[bar] < 0 ? Color.Red : Color.Black);
         }
It would seem that this should work for a TimeSeries
CODE:
PlotTimeSeries(GainLoss, "Gain_Loss", "GainLosspane");
         for (int bar = 1; bar < bars.Count; bar++)
         {
            if (GainLoss[bar] > 0)
            {
               SetSeriesBarColor(GainLoss, bar, Color.Green);
            }
            else if (GainLoss[bar] < 0)
            {
               SetSeriesBarColor(GainLoss, bar, Color.Red);
            }
         }
But now I just get a Blue line.
No it works correctly:
CODE:
//create indicators and other objects here, this is executed prior to the main trading loop
        public override void Initialize(BarHistory bars)
        {
         var GainLoss = RSI.Series(bars.Close, 14);
         PlotTimeSeries(GainLoss, "Gain_Loss", "GainLosspane", Color.Green, PlotStyles.Line);
         for (int bar = 1; bar < bars.Count; bar++)
         {
            SetSeriesBarColor(GainLoss, bar, GainLoss[bar] > 50 ? Color.Green : GainLoss[bar] < 50 ? Color.Red : Color.Black);
         }
        }
Eugene,
I have shown to myself that that code works for an Indicator data stream, but in my case I need to plot a Time Series data stream and using the same code
on my Time Series I get a black line. So it seems there is an issue when trying to plot a multi-color Time Series data stream.
I have shown to myself that that code works for an Indicator data stream, but in my case I need to plot a Time Series data stream and using the same code
CODE:
PlotTimeSeries(GainLoss, "Gain_Loss", "GainLosspane",Color.Green, PlotStyles.Line);
         for (int bar = 1; bar < bars.Count; bar++)
         {
            SetSeriesBarColor(GainLoss, bar, GainLoss[bar] > 0 ? Color.Green : GainLoss[bar] < 0 ? Color.Red : Color.Black);
         }
on my Time Series I get a black line. So it seems there is an issue when trying to plot a multi-color Time Series data stream.
As my code demonstrates with PlotTimeSeries in it and a screenshot, it works correctly. There could be an issue in your code.
Eugene,
You are plotting RSI, an Indicator. I'm plotting a TimeSeries I put together from data generated bar by bar.
You are plotting RSI, an Indicator. I'm plotting a TimeSeries I put together from data generated bar by bar.
Can't see why this should make difference?
CODE:
//create indicators and other objects here, this is executed prior to the main trading loop
        public override void Initialize(BarHistory bars)
        {
         TimeSeries ts = new TimeSeries(bars.DateTimes, 0);
         Random rnd = new Random();

         for (int i = 0; i < ts.Count; i++)
         {
            ts[i] = rnd.Next(-3, 3);
         }
         PlotTimeSeries(ts, "Gain_Loss", "GainLosspane", Color.Green, PlotStyles.Line);
         for (int bar = 1; bar < bars.Count; bar++)
         {
            SetSeriesBarColor(ts, bar, ts[bar] > 0 ? Color.Green : ts[bar] < 0 ? Color.Red : Color.Black);
         }
        }
I agree, I can't why it should matter. My GainLoss TimeSeries is the gain and or loss of the stock bar by bar. The code

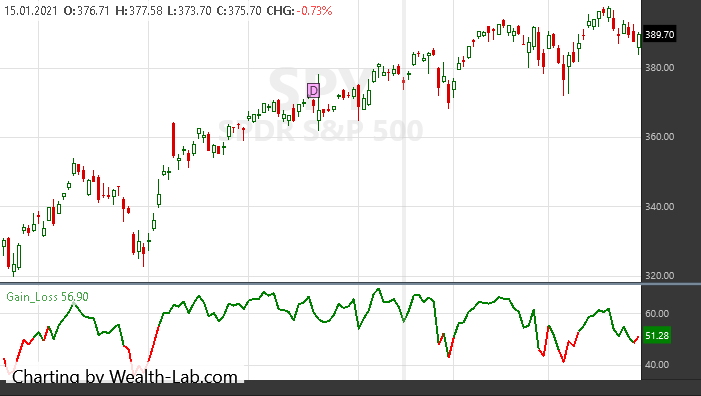
The black line is the GainLoss plotted with the code above. The lowest point is -16. To develop the TimeSeries I just add 2 numbers at each bar. Very simple. I did the same thing in WL6 and used the if () statement in one of my responses above and it worked. But in WL7 I get a blue line. Strange?
CODE:
PlotTimeSeries(GainLoss, "Gain_Loss", "GainLosspane",Color.Green, PlotStyles.Line);
         for (int bar = 1; bar < bars.Count; bar++)
         {
            SetSeriesBarColor(GainLoss, bar, GainLoss[bar] > 0 ? Color.Green : GainLoss[bar] < 0 ? Color.Red : Color.Black);
         }
The black line is the GainLoss plotted with the code above. The lowest point is -16. To develop the TimeSeries I just add 2 numbers at each bar. Very simple. I did the same thing in WL6 and used the if () statement in one of my responses above and it worked. But in WL7 I get a blue line. Strange?
Not strange if you modify the TimeSeries later in your code, for example. Hard to tell without seeing the respective code
I just repeated plotting my dso Indicator using the if statement method and it plots with green and red lines. The code I use to generate GainLoss is
This is done bar by bar, the same as I did in WL6, except where WL7 required new format, i.e., bars.Close[bar] instead of Close[bar].
CODE:
dblGain = bars.Close[bar] - BuyPrice[bar];
            GainLoss[bar] = 100 * (dblGain / bars.Close[bar]);
This is done bar by bar, the same as I did in WL6, except where WL7 required new format, i.e., bars.Close[bar] instead of Close[bar].
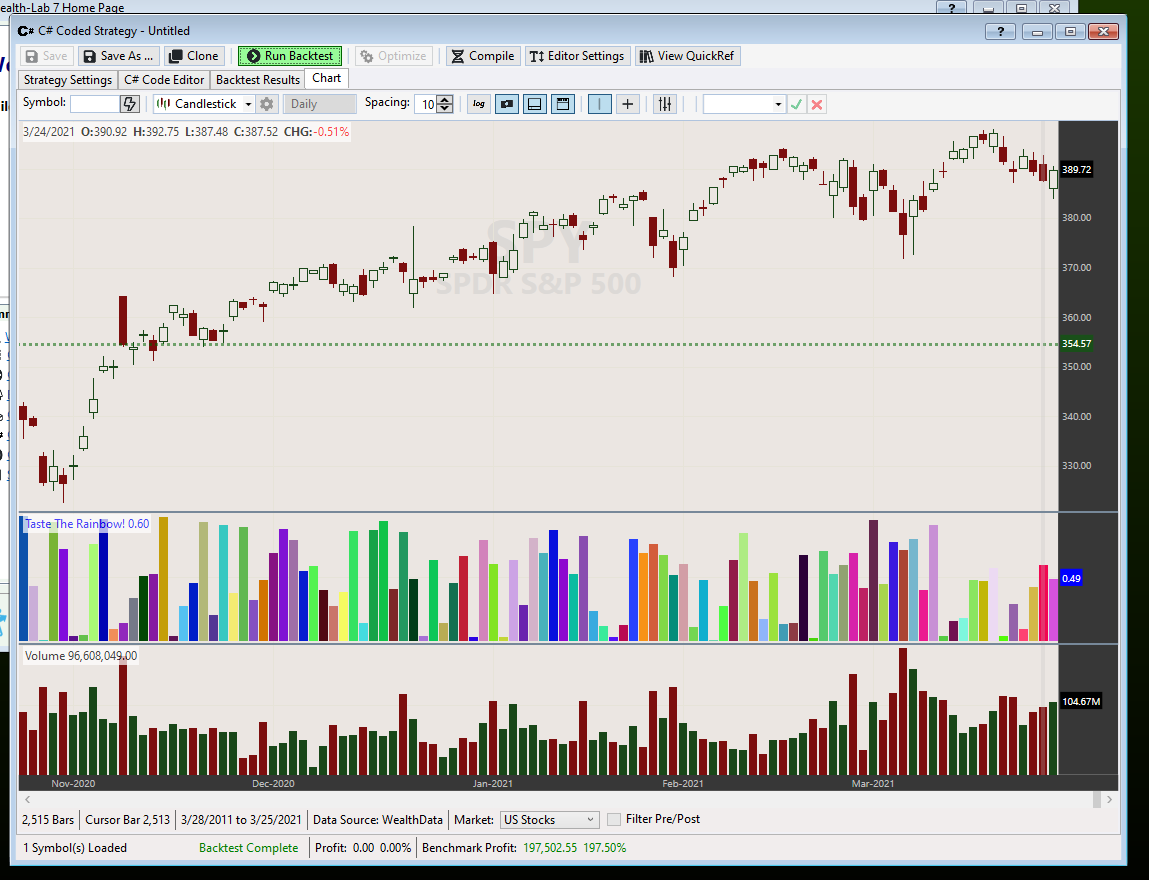
Here is a minimal proof of concept that proves setting series bar color works for TimeSeries.
CODE:

using WealthLab.Backtest;
using System;
using WealthLab.Core;
using System.Drawing;
using WealthLab.Indicators;

namespace WealthScript1
{
    public class MyStrategy : UserStrategyBase
    {
        //Initialize
        public override void Initialize(BarHistory bars)
        {
         ts = new TimeSeries(bars.DateTimes);
         PlotTimeSeries(ts, "Taste The Rainbow!", "Random", default(Color), PlotStyles.ThickHistogram);
        }

        //Execute
        public override void Execute(BarHistory bars, int idx)
        {
         ts[idx] = rnd.NextDouble();
         Color c = Color.FromArgb(rnd.Next(255), rnd.Next(255), rnd.Next(255));
         SetSeriesBarColor(ts, idx, c);
        }

      //private members
      TimeSeries ts;
      Random rnd = new Random();
    }
}
Glitch,
The issue seems that when I build a TimeSeries by adding a couple numbers together and then try plotting it must create a problem. All of the examples Eugene and you have shown use direct indicators and not manipulated numbers to create a TimeSeries.
The issue seems that when I build a TimeSeries by adding a couple numbers together and then try plotting it must create a problem. All of the examples Eugene and you have shown use direct indicators and not manipulated numbers to create a TimeSeries.
Here is an example where the TimeSeries is calculated from mathematical operations, and it still allows by-bar coloring no problem.
CODE:

using System;
using WealthLab.Core;
using System.Drawing;
using WealthLab.Indicators;

namespace WealthScript1
{
   public class MyStrategy : UserStrategyBase
   {
      //Initialize
      public override void Initialize(BarHistory bars)
      {
         ts = bars.Close + bars.Open / 2;
         PlotTimeSeries(ts, "Taste The Rainbow!", "Random", default(Color), PlotStyles.ThickHistogram);
      }

      //Execute
      public override void Execute(BarHistory bars, int idx)
      {
         Color c = Color.FromArgb(rnd.Next(255), rnd.Next(255), rnd.Next(255));
         SetSeriesBarColor(ts, idx, c);
      }

      //private members
      TimeSeries ts;
      Random rnd = new Random();
   }
}
Well then, what have I done wrong? Try adding a couple Indicators together to generate a TimeSeries and plot that. Thank you for all your attention, it is much appreciated.
Maybe instead of going in circles it'd be easier if you show only the relevant code?
Here is how I get GainLoss see
Then to plot see
The plot is a black line that is shown above.
I have another TimeSeries I plot PctDrop and I changed to code just like above and get a black too.
CODE:
dblGain = bars.Close[bar] - BuyPrice[bar];
            GainLoss[bar] = 100 * (dblGain / bars.Close[bar]);
Then to plot see
CODE:
PlotTimeSeries(GainLoss, "Gain_Loss", "GainLosspane",Color.Green, PlotStyles.Line);
         for (int bar = 1; bar < bars.Count; bar++)
         {
            SetSeriesBarColor(GainLoss, bar, GainLoss[bar] > 0 ? Color.Green : GainLoss[bar] < 0 ? Color.Red : Color.Black);
         }
The plot is a black line that is shown above.
I have another TimeSeries I plot PctDrop and I changed to code just like above and get a black too.
QUOTE:And are you making all those TimeSeries changes/writes in the Initialize{} block, and not the Execute{} block?
The issue seems that when I build a TimeSeries by adding a couple numbers together and then try plotting it must create a problem.
You don't want to use the Execute{} block for any TimeSeries "writes". Do all your TimeSeries writes (and plotting, if possible, for WL speed) in the Initialize{} block where time (i.e. bars) is the fastest moving variable.
Please post a complete, minimal, strategy code. Not just segments. There's no way to tell what you did wrong any other way. You can strip out any non-relevant code. Just include the bare minimum COMPLETE strategy code to illustrate the problem.
And here is the latest circle, adding a few indicators together and plotting that :D
And here is the latest circle, adding a few indicators together and plotting that :D
CODE:

using System;
using WealthLab.Core;
using WealthLab.Backtest;
using System.Drawing;
using WealthLab.Indicators;

namespace WealthScript1
{
   public class MyStrategy : UserStrategyBase
   {
      //Initialize
      public override void Initialize(BarHistory bars)
      {
         RSI rsi20 = RSI.Series(bars.Close, 20);
         RSI rsi10 = RSI.Series(bars.Close, 10);
         ts = (rsi20 + rsi10) / 2;
         PlotTimeSeries(ts, "Taste The Rainbow!", "Random", default(Color), PlotStyles.ThickHistogram);
      }

      //Execute
      public override void Execute(BarHistory bars, int idx)
      {
         Color c = Color.FromArgb(rnd.Next(255), rnd.Next(255), rnd.Next(255));
         SetSeriesBarColor(ts, idx, c);
      }

      //private members
      TimeSeries ts;
      Random rnd = new Random();
   }
}
This is the part where I develop the GainLoss TimeSeries
This is in the Execute section. The plotting is in the Initialize section.
CODE:
if (OwnStock[bar - 1] == 1 & OwnStock[bar - 2] == 0)
         {
            WriteToDebugLog("Buy");
            BuyPrice[bar] = bars.Open[bar];
            strNewBuy = BuyPrice[bar].ToString("0.00");
            WriteToDebugLog("buy");
            OwnStock[bar] = 1;
         }
         if (OwnStock[bar - 1] == 1 & OwnStock[bar - 2] == 1) //own stock and have owned for more than 1 bar
         {
            OwnStock[bar] = 1;
            BuyPrice[bar] = BuyPrice[bar - 1];
            strBuyPrice = BuyPrice[bar].ToString("0.00");
            strOwn = OwnStock[bar].ToString("0");
            strOwn = "1";
            WriteToDebugLog(strBuyPrice);
         }
         if (OwnStock[bar - 1] == 0) //don't own stock
         {
            //BuyPrice[bar] = 0;  //quotes should be removed
            OwnStock[bar] = 0;

         }
         if (OwnStock[bar - 1] == 2) //sold stock at previous bar
         {
            OwnStock[bar] = 0;
            BuyPrice[bar] = 0;
            //PrintDebug("Sell Stock", OwnStock[bar -1], bar);
            //PrintDebug("Buy Price", dblBuyPrice[bar]);
         }
         if (OwnStock[bar] == 1) //we own stock
         {
            dblGain = bars.Close[bar] - BuyPrice[bar];
            GainLoss[bar] = 100 * (dblGain / bars.Close[bar]);
            WriteToDebugLog("Gain");
            WriteToDebugLog(GainLoss[bar]);
            //tempGainLoss[bar] = GainLoss[bar];
            //PrintDebug("Gain", dblGainLoss[bar]);
            //strGain = dblGain.ToString("0.00");
This is in the Execute section. The plotting is in the Initialize section.
Superticker,
There is no problem with speed, the result takes only a second or so.
There is no problem with speed, the result takes only a second or so.
As I said earlier, please post the complete code so I can copy and paste the whole thing.
I'm sending it to support@wealth-lab.com
Thanks, with the full code I was able to troubleshoot the problem in less than a minute. Reply sent.
FYI: The problem was that OP had coded a loop in Initialize, right after creating their TimeSeries, and calling SetSeriesLineColor there. Before any values were assigned into the TimeSeries. OP was only assigning values to their TimeSeries in Execute.
FYI: The problem was that OP had coded a loop in Initialize, right after creating their TimeSeries, and calling SetSeriesLineColor there. Before any values were assigned into the TimeSeries. OP was only assigning values to their TimeSeries in Execute.
Glitch,
Thank you very much. In this area WL7 is different from WL6. Can we use this same tool to display 3 colors for a line display. Do we just continue the same format?
Thank you very much. In this area WL7 is different from WL6. Can we use this same tool to display 3 colors for a line display. Do we just continue the same format?
Just to conclude with WL7, you need to set the colors of the TimeSeries to be displayed in the Execute section. The plot command in the Initialize section can not do changes to the color of the line. Those colors must be all set in Execute section.
Correction! You could do it in Initialize. The area you missed was assigning any values to the TimeSeries in the Initialize method before you call SetSerieineColor.
Remember, Initialize gets called first, followed by Execute which gets called once for each bar of data.
Remember, Initialize gets called first, followed by Execute which gets called once for each bar of data.
You mean like setting it to all zeros?
I mean, you ...
1. Created the TimeSeries in Initialize
2. Then, coded a for loop in Initialize to examine its values. At this point, all its values are Double.NaN
3. Use an if statement to assign different colors to it based on the values. But all the values are NaN at this point so your line comes out black.
4. Then, after all this, in Execute you finally have some code that assigns values to your TimeSeries
Your Response
Post
Edit Post
Login is required