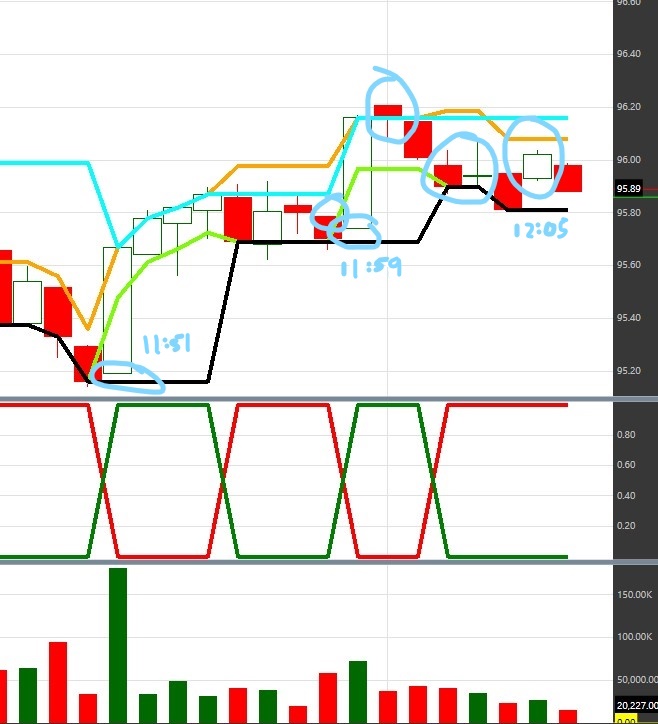
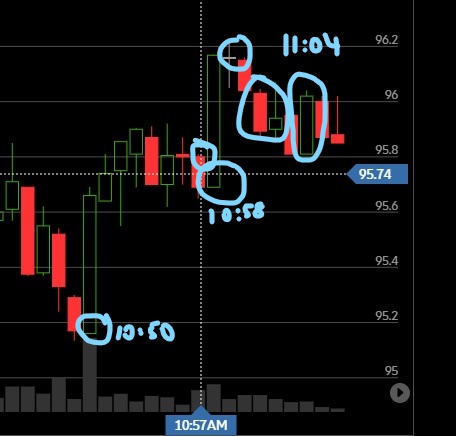
WL7 streaming chart shows different open-close prices of some bars than seen on ThinkorSwim platform and historical chart.
For ARKK 12/17/2021 1-minute TD streaming chart, there are several bars which are different than seen on ThinkorSwim.
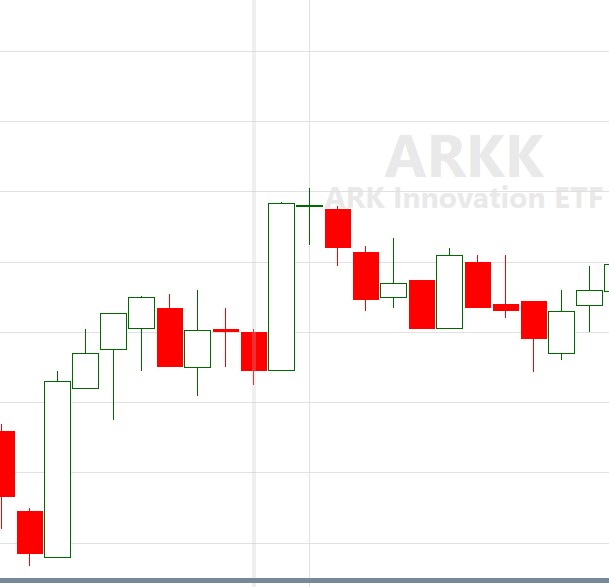
ThinkorSwim chart:
Historical 1-minute chart from TD matches ThinkorSwim chart
For ARKK 12/17/2021 1-minute TD streaming chart, there are several bars which are different than seen on ThinkorSwim.
ThinkorSwim chart:
Historical 1-minute chart from TD matches ThinkorSwim chart
Rename
Think or Swim displays the data in your local time zone with a start-of-bar timestamp convention.
Wealth-Lab uses the market's time zone for data and uses a end-of-bar timestamp convention. This consistency is important for all intraday providers when synchronizing data from different intraday scales.
Wealth-Lab uses the market's time zone for data and uses a end-of-bar timestamp convention. This consistency is important for all intraday providers when synchronizing data from different intraday scales.
ThinkorSwim chart is local time zone and start-of-bar timestamp but historical chart data shown in WL7 is in market time zone and has end-of-bar timestamp same as real-time streaming data. Historical and ThinkorSwim data both match exactly.
My concern is that since optimized strategy parameters are based on historical bars and it may not be well optimized to work with real-time streaming bars as real-time streaming bars are different than historical bars. If I disable streaming in between and enable it back the whole chart and optimized indicator signals change the trading results. The closing price differences of the bar can really skew the results as my strategy use Bars.Close[idx] to calculate signals.
Below is a log showing some trades on ARKK that happened in real-time streaming (order status retrieved from TD) but didn't show up in historical data backtest results and vice-versa.
Action Real-time trades Backtest trades Reported
Buy 92.0399 NA '15:27:10 12/16/21
Buy to Cover 92.03 NA '15:27:07 12/16/21
Sell Short 91.7745 NA '15:23:11 12/16/21
Sell 91.7701 NA '15:23:07 12/16/21
Buy 91.8999 91.92 '15:21:10 12/16/21
Buy to Cover 91.88 91.92 '15:21:06 12/16/21
Sell Short 91.4904 91.48 '15:19:09 12/16/21
Sell 91.4901 91.48 '15:19:05 12/16/21
Buy NA 91.59 15:15:00
Buy to Cover NA 91.59 15:15:00
Buy 91.6499 NA '15:14:09 12/16/21
Buy to Cover 91.649 NA '15:14:05 12/16/21
Sell Short 91.8701 NA '12:59:10 12/16/21
Sell 91.8701 NA '12:59:06 12/16/21
Sell Short NA 91.91 12:57:00
Sell NA 91.91 12:57:00
Buy NA 91.99 12:51:00
Buy to Cover NA 91.99 12:51:00
Buy 91.93 NA '12:46:09 12/16/21
Buy to Cover 91.9399 NA '12:46:05 12/16/21
Is there a way to have n-1 bar closing price in real-time streaming mode be same as n-1 historical bar closing price? That way optimized strategy indicators can generate expected trading alerts based on n-1 bar.
QUOTE:What are you talking about? The data is [should be] the same. Only the timestamp convention is different. If the strategy requires it, add the data interval to any parameter that requires it to match the timestamp in Wealth-Lab. The timestamp convention will not change (I explained why in my last post).
My concern is that since optimized strategy parameters ....
If the data are actually different, we'll have to see why that's occurring. If it's because TDA isn't supplying all of the ticks (or at least conflated data that includes the high, low, and close of the interval) to build the same bar they're building with all of the ticks on the back end, then that's why.
This is what I tried to show in original post. Streaming bars are different than historical bars. Look at the circles drawn in the bar charts. I'm not concerned about their timestamps.
If I disable streaming in between then all the indicators shift and lead to slightly different trades. I showed difference in trades in Post #2. My indicators are based on Bars.Close[idx] and since Bars.Close are different for several bars the indicators change when viewing streaming vs historical data.
If I disable streaming in between then all the indicators shift and lead to slightly different trades. I showed difference in trades in Post #2. My indicators are based on Bars.Close[idx] and since Bars.Close are different for several bars the indicators change when viewing streaming vs historical data.
Gotcha, sometimes it takes me a few times to catch on ;)
We see it too and we're looking into it.
We see it too and we're looking into it.
We've got a good handle on this one now, and it will be improved in the next build.
Issues -
1. It won't be possible to match a historical chart exactly because TD Streaming data are conflated, i.e., this is not a tick-by-tick stream like IQFeed. Updates are about every 750ms. Generally, we see that the price of the last trade in a 1-sec interval is the price we get. This works well to close the bar at the correct price, however the opening trade of the next bar will often be wrong if many trades occur at the beginning of the next interval during the first 1 second.
2. Streaming bar volume is somewhat inflated because the total day's volume appears to be including all the odd lots too. Historical charts generally include only full-lot trades (100 shares or more).
3. Sometimes trade reporting can be missed for an extended period of time - once I saw a gap of 9 seconds that had many trades that were not reported at all.
If you need streaming intraday charts to match historical data "exactly", then IQFeed is probably the only option right now.
fwiw, we've got an improvement for IB Streaming coming too. Although the data are conflated as well, updates are faster (about 250ms) and trade volume is very close. However, bar closes can be slightly off for active instruments due to the conflation.
Your Response
Post
Edit Post
Login is required