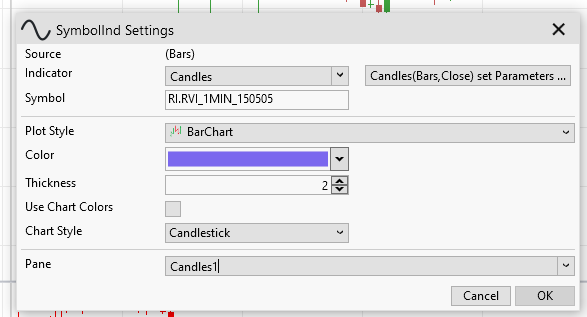
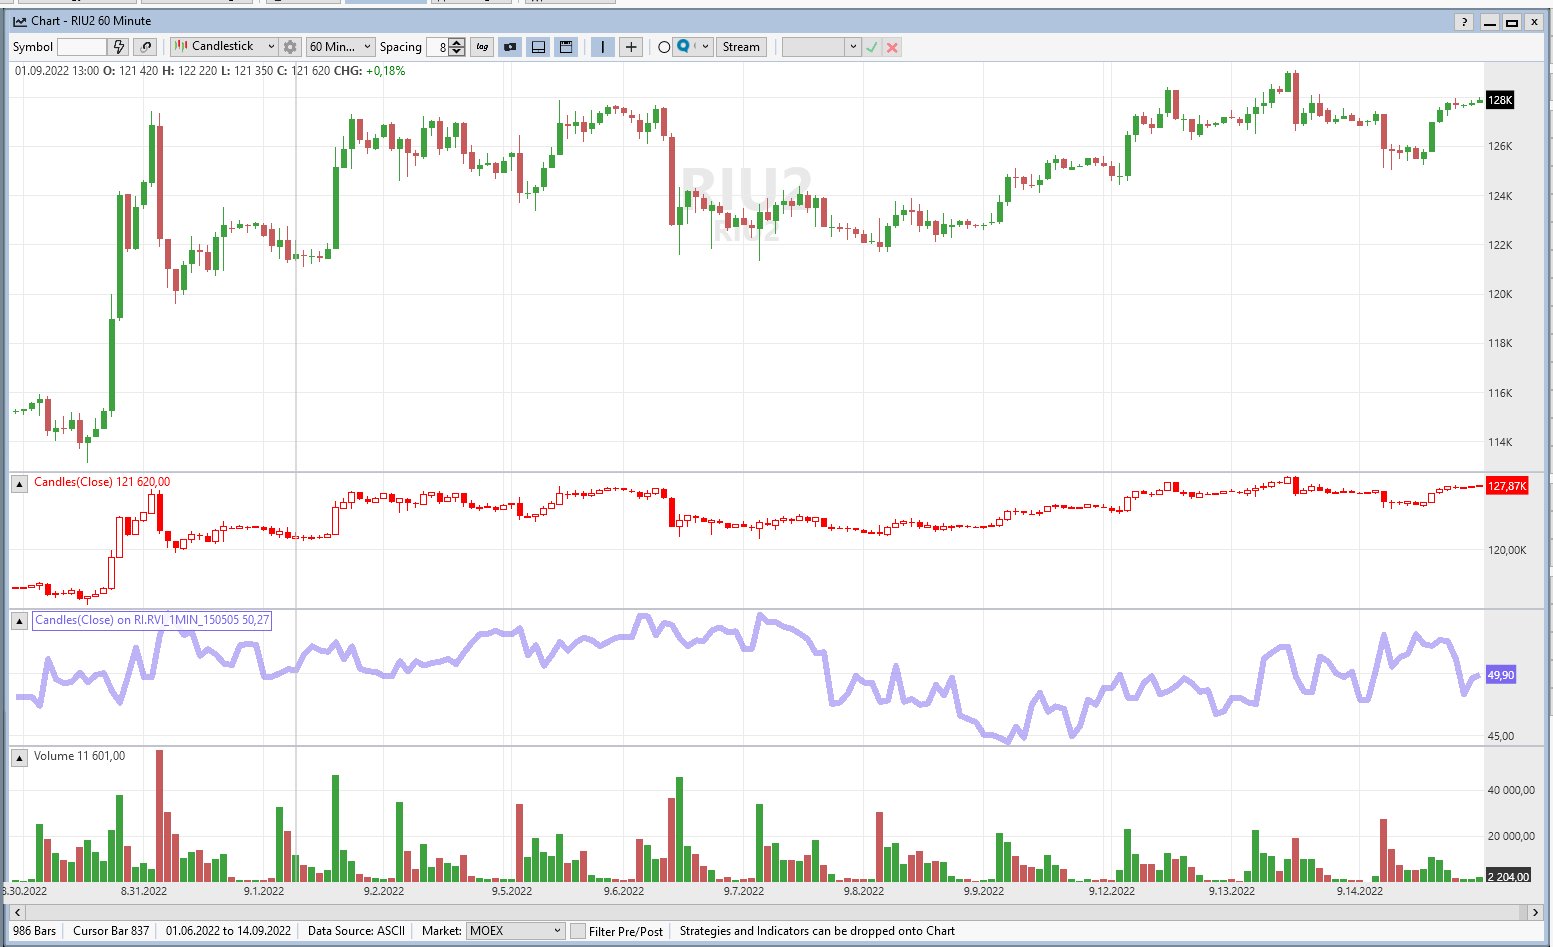
I want to see two symbols on the same chart window. For this purpose, I wrote the Candles indicator, which displays the candles of the source symbol. By itself, the Candles indicator works well. However, paired with the SymbolInd indicator, it should have provided the desired. However, when working with a different symbol than the main chart symbol, SymbolInd does not display candles.
Below is the indicator code.
Please let me know how I can achieve what I want and display two symbols on one chart. Perhaps there is a problem with the SymbolInd indicator that needs to be fixed.
Below is the indicator code.
CODE:

using WealthLab.Core;
using System;
using System.Drawing;
using WealthLab.Indicators;

namespace WealthLab.Indicators
{

   //the VChart indicator
   public class Candles : IndicatorBase
   {
      //parameterless constructor
      public Candles() : base()
      {
      }

      //for code based construction
      public Candles(BarHistory source, PriceComponent pc)
         : base()
      {
         Parameters[0].Value = source;
         Parameters[1].Value = pc;
         Populate();
      }

      //static method
      public static Candles Series(BarHistory source, PriceComponent pc)
      {
         string key = CacheKey("Candles", pc);
         if (source.Cache.ContainsKey(key))
            return (Candles)source.Cache[key];
         Candles vchart = new Candles(source, pc);
         source.Cache[key] = vchart;
         return vchart;
      }

      //Name
      public override string Name => "Value Chart";

      //Abbreviation
      public override string Abbreviation => "Candles";

      //description
      public override string HelpDescription => "The Value Charts indicator developed by Mark W. Helweg. Applies a volatility based detrending to the source price component.";

      //pane
      public override string PaneTag => "Candles";

      //access price component used
      public PriceComponent PriceComponent1 => Parameters[1].AsPriceComponent;

      //default color
      public override WLColor DefaultColor => WLColor.Red;

      //default plot style
      public override PlotStyle DefaultPlotStyle => PlotStyle.BarChart;

      //populate
      public override void Populate()
      {
         //get parameter values
         BarHistory source = Parameters[0].AsBarHistory;
         if (source == null)
            return;
         PriceComponent pc = Parameters[1].AsPriceComponent;

         //set datetimes
         DateTimes = source.DateTimes;

         switch (pc)
         {
            case PriceComponent.Open:
               for (int n = 0; n < source.Close.Count; n++)
               {
                  Values[n] = source.Open[n];
               }
               break;

            case PriceComponent.High:
               for (int n = 0; n < source.Close.Count; n++)
               {
                  Values[n] = source.High[n];
               }
               break;

            case PriceComponent.Low:
               for (int n = 0; n < source.Close.Count; n++)
               {
                  Values[n] = source.Low[n];
               }
               break;

            case PriceComponent.Close:
               for (int n = 0; n < source.Close.Count; n++)
               {
                  Values[n] = source.Close[n];
               }
               break;

            case PriceComponent.Volume:
               for (int n = 0; n < source.Close.Count; n++)
               {
                  Values[n] = source.Volume[n];
               }
               break;

            default:

               break;
         }
      }

      //generate parameters
      protected override void GenerateParameters()
      {
         AddParameter("Source", ParameterType.BarHistory, null);
         AddParameter("Price Component", ParameterType.PriceComponent, PriceComponent.Close);
      }

      //get corresponding bar chart companion indicator
      public override IndicatorBase GetBarChartCompanion(PriceComponent pc)
      {
         if (PriceComponent1 == pc)
            return this;
         return new Candles(Parameters[0].AsBarHistory, pc);
      }
   }
}
Please let me know how I can achieve what I want and display two symbols on one chart. Perhaps there is a problem with the SymbolInd indicator that needs to be fixed.
Rename
That's right, it cannot plot them because the BarChart Plot Style requires that an indicator define the various OHLC components. SymbolInd does not define these so it defaults to a line plot.
That said, I made a small enhancement to SymbolInd so this will work in Build 27.
That said, I made a small enhancement to SymbolInd so this will work in Build 27.
Your Response
Post
Edit Post
Login is required