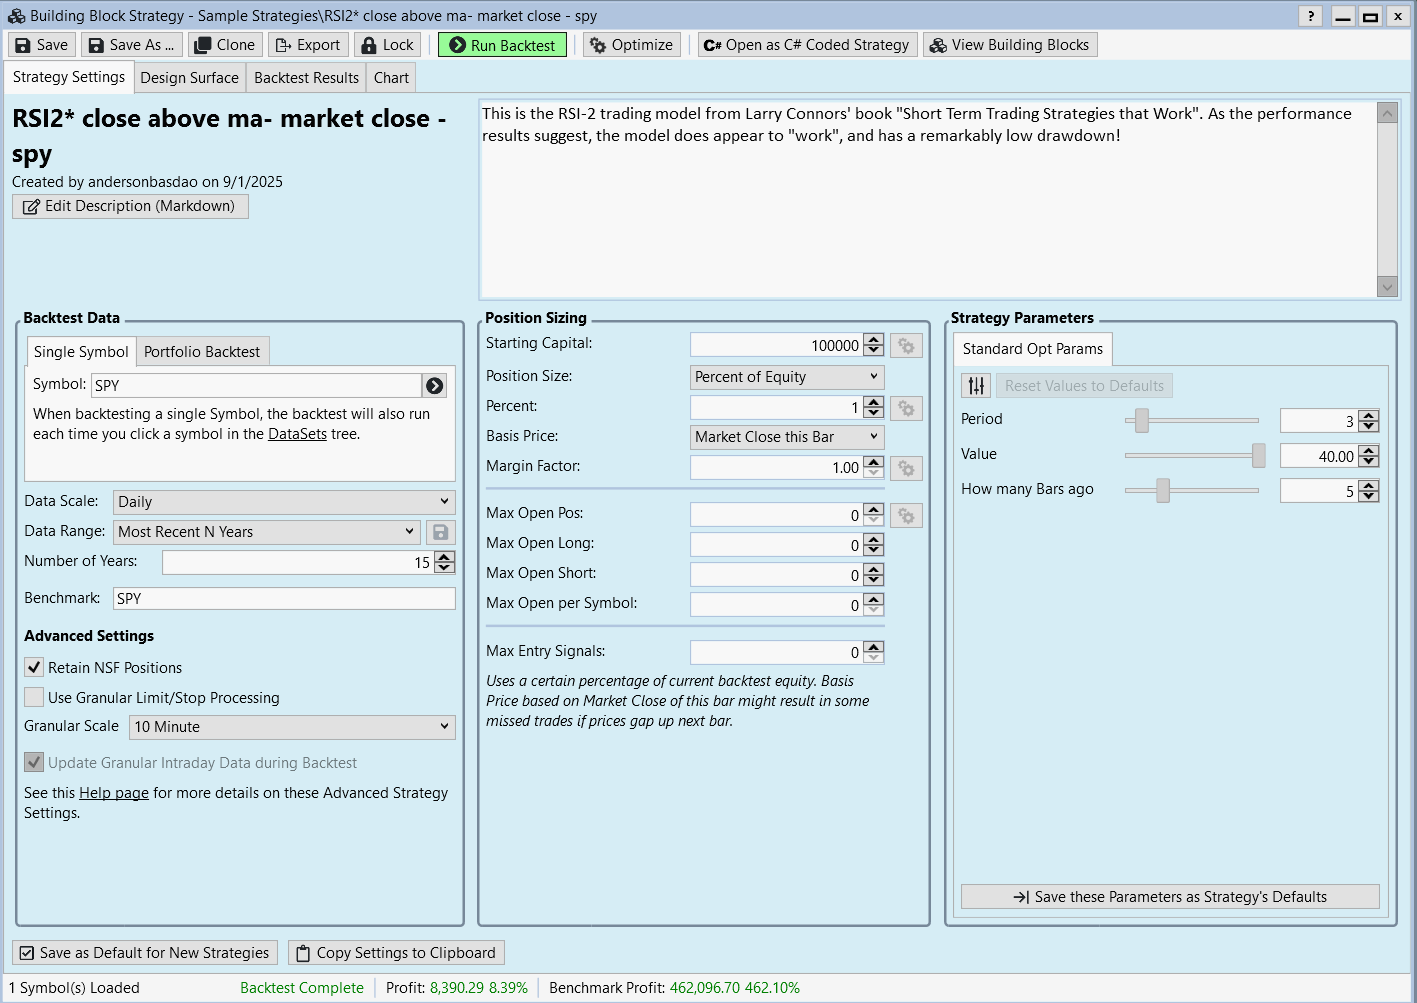
Can a more experienced trader take a look at this block strategy and make sure everything is right? I'd like to buy SPY at a pull back a few minutes before market close and sell it once price reaches the high of 5 candles back, also a few minutes before close. Got this idea from the One Percent a Week thread. If everything is right, planning to backtest this with options, since the the strategy seems to have a high win %.
Thanks

Thanks
Rename
I haven't looked at the strategy, but setting the Percent of Equity to 1% is bad. I would set it to at least 10% (so you carry 10 positions) or 33% (so you carry 3 positions) would make more sense. You want to set it high enough so you have at least a few NSF counts.
I set at 1% because I wouldn't use equities. I'm just concerned at first with the winning % and average % winners.
QUOTE:
... concerned ... with the winning % and average % winners.
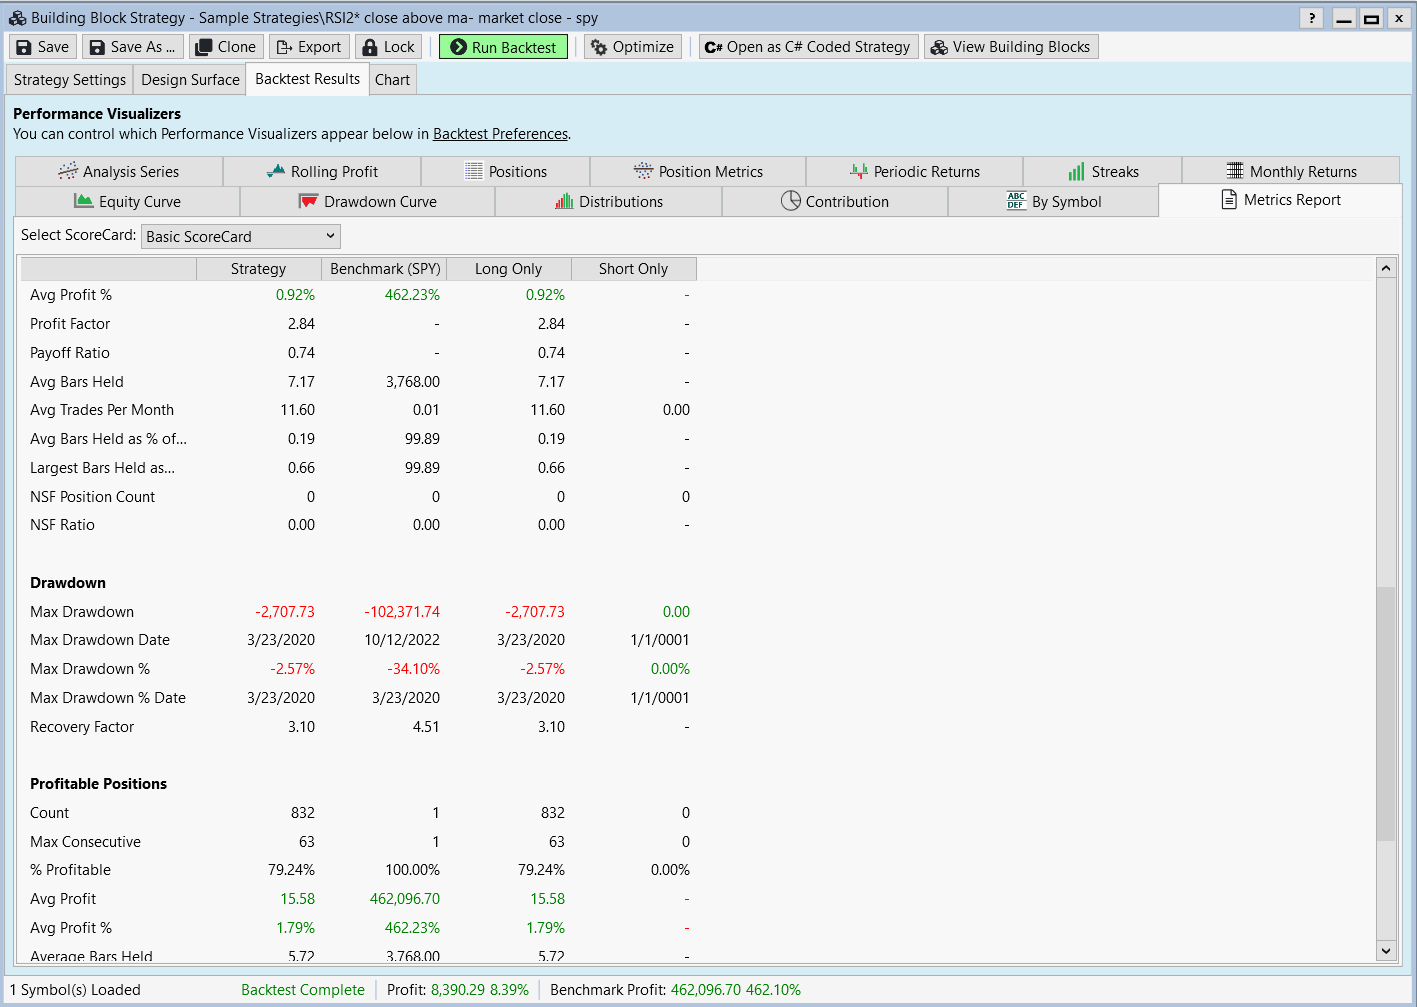
Looking at just the Metrics Report, the Average Profit % of 0.92 is low because you are only holding positions for 5.5 bars. If your strategy was more predictive so you could hold positions for more bars, you would have a higher Average Profit %.
The winning rate of 79% is very good. I get less than that, and I'm running a very cherry picked dataset. If a stock isn't pulling its weight over the last five trades, it gets removed from my trading dataset. I use the Symbol Rankings tab of the Strategy Rankings tool to enforce that.
Holding the position longer would generate higher profits per trade indeed, but my idea is to get in and out within a week to reinvest that profit as quickly as possible using options and an anti martingale system. I just want to make sure the blocks are built correctly.
@andersonbasdao do you backtest your option strategies before live trading them? If so how/what platform do you use?
Yes, of course. I use "One" (optionnetexplorer).
Can someone please tell me if I set the blocks up correctly? I need to know if this strategy is somewhat reliable before a dig into it deeper. I never used the 1 bar in future option before.
QUOTE:
Can someone please tell me if I set the blocks up correctly?
I think it does what you described.
@anderson, to fine tune your results, would you want to set up parameters for Wealthlab to optimize your parameters? I guess your set up is pretty simple (daily bars, RSI <40 buy SPY, sell after 5 days, though I think you need at least one more exit criterium in case your bullish thesis was incorrect), so not much to optimize, especially if you are planning on using options and don't want too much theta decay depending on your expiration choice. I think that's one way that WL8 excels.
Also, Cone posted a way that WL8 can access IBKR's method of providing historical IV via code (not block-coding, so potentially big learning curve), and calculating a synthetic option value using Black-Scholes and IV in WL8 is a pretty good estimate, especially for liquid options (like if you're looking at SPY). Unfortunately, not a good way (yet! I keep hoping there will be better options support in the future for tracking and optimization!) to track profits and gains with the built-in tools like equity trades, but can still be used in a hybrid manual fashion if that's your current workflow.
Also, Cone posted a way that WL8 can access IBKR's method of providing historical IV via code (not block-coding, so potentially big learning curve), and calculating a synthetic option value using Black-Scholes and IV in WL8 is a pretty good estimate, especially for liquid options (like if you're looking at SPY). Unfortunately, not a good way (yet! I keep hoping there will be better options support in the future for tracking and optimization!) to track profits and gains with the built-in tools like equity trades, but can still be used in a hybrid manual fashion if that's your current workflow.
@bcdxxx, I did optimize all the parameters to SPY.
As far as another exit in case my bullish thesis is wrong for a specific trade, I'm planning on "morphing" a call vertical spread (initial position) into a butterfly. Being able to do that and also eliminating the risk of a big drawdown (all you can lose is what you paid for the spread) is my main reasoning, I guess.
As far as another exit in case my bullish thesis is wrong for a specific trade, I'm planning on "morphing" a call vertical spread (initial position) into a butterfly. Being able to do that and also eliminating the risk of a big drawdown (all you can lose is what you paid for the spread) is my main reasoning, I guess.
Got it. Sorry, I see that now that I looked at your screenshots a little more carefully.
With your semi-manual process of sort of using WL as a fancy screener, to better model your idea, you might consider adding a second exit criteria as a "stop loss" so you can tell WL when you're pivoting and exiting into your butterfly.
Another idea I have to throw out at you for options trading, with code, you can have WL output for you via the debug log:
Current options data table (I've done for Schwab, which has the speediest data download), including IV, and expected theoretical options price at a certain price level (expected intra-day pullback) for a strike at a certain delta and minimum number of days to expiration. I sometimes use that to plan out my order going into the day.
If you get IB data, you can get a curve of historical IV data and can do a semblance of backtest via debug log (I haven't done that yet, but it's on my to-do list).
@anderson Current strategy does not guarantee exit after 5 bars after entry, but only when a bar closes higher than the high of the bar 5 bars ago, so the holding period could longer. I saw some trades held for 34 bars in my backtests with SPY. Not sure whether this is what you intended to have so calling it out.
I’m going to take a look at Cone’s code and see if we can’t wrap that into an indicator that is part of the IB extension so we could use it in drag & drop.
All good ideas guys. Thank you!
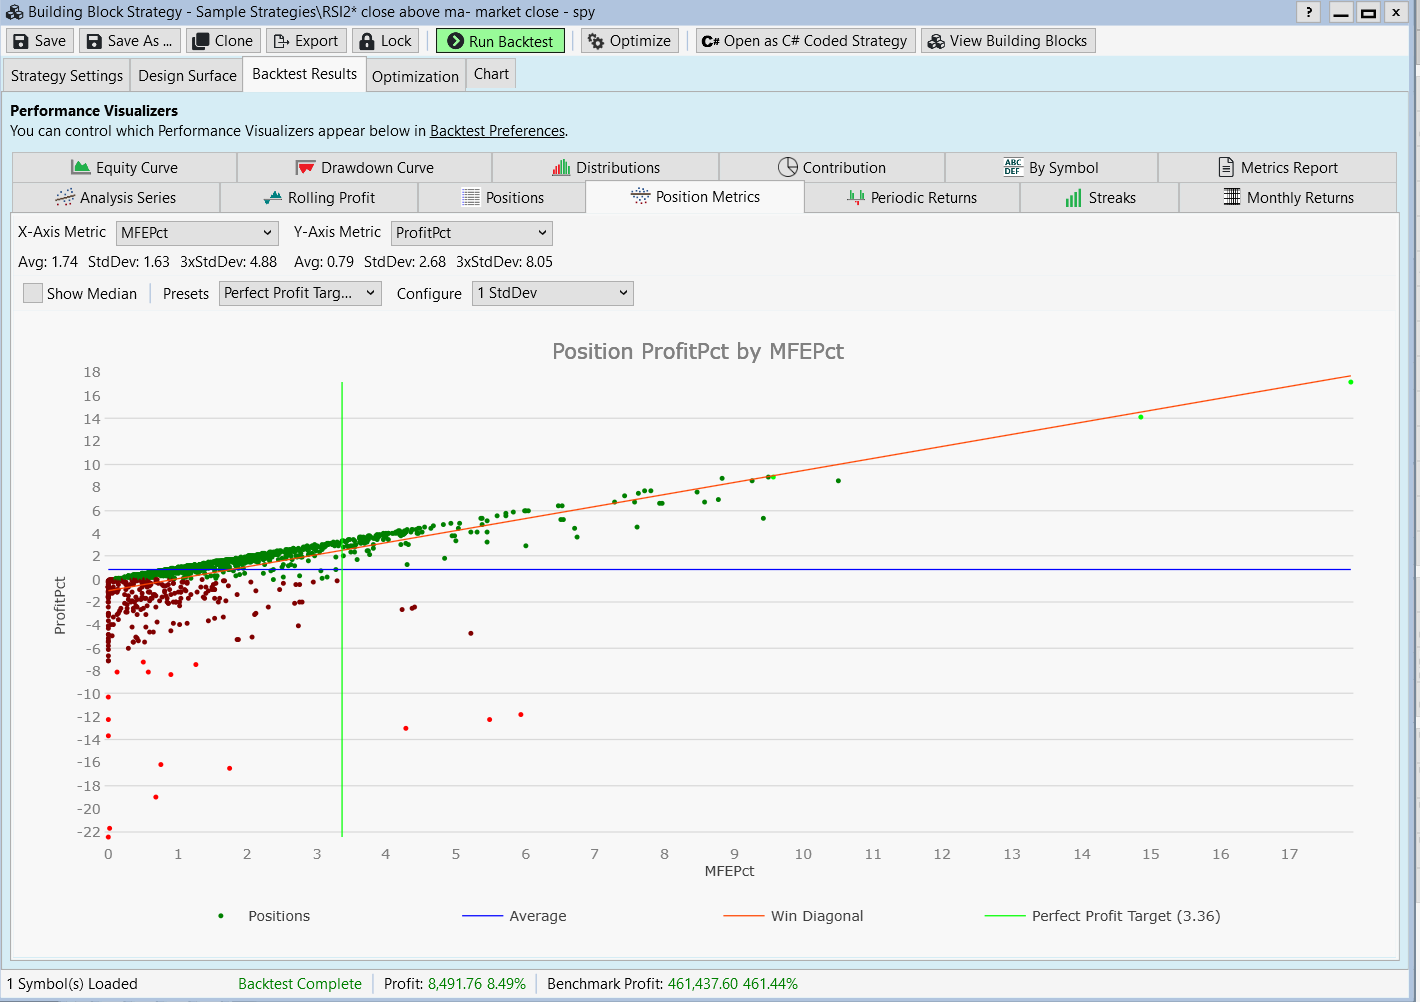
@rainfield Yes, 5 days is the average and as of today, I'm going to go with that (buying a 5 or 6 day out vertical spread atm, with the short call 3% out as shown in the "perfect profit target". I'll cap it at that).
If I limit that (Sell after 7 days, for example) the winning percentage drops by 10%.
Going with the averages here. If market doesn't move, ïll try to recoup my investment by implementing a butterfly.
Your Response
Post
Edit Post
Login is required