When I run an optimization, I will finally not choose the parameter set with the "best" performance metric value, but a parameter set from a "stable region".
To do the same during walk forward optimization I need one more "hook" in the ScoreCard API, which would be used during WFO. This method should be called at the end of a single optimization run (one interval in WFO) with the complete optimizer results, similar to the Optimizer Visualizer API. The method would then return the "best suited" parameter combination (or run-number) which should be used for the OOS interval backtest.
To do the same during walk forward optimization I need one more "hook" in the ScoreCard API, which would be used during WFO. This method should be called at the end of a single optimization run (one interval in WFO) with the complete optimizer results, similar to the Optimizer Visualizer API. The method would then return the "best suited" parameter combination (or run-number) which should be used for the OOS interval backtest.
Rename
Can you provide a detailed example of this, since I'm still having trouble grasping the request?
QUOTE:
I'm still having trouble grasping the request
Ok, let me elaborate a bit:
We are talking about a single optimization run here, but also about Insample (IS) vs. Out-of-Sample (OOS) results of this one optimizer run.
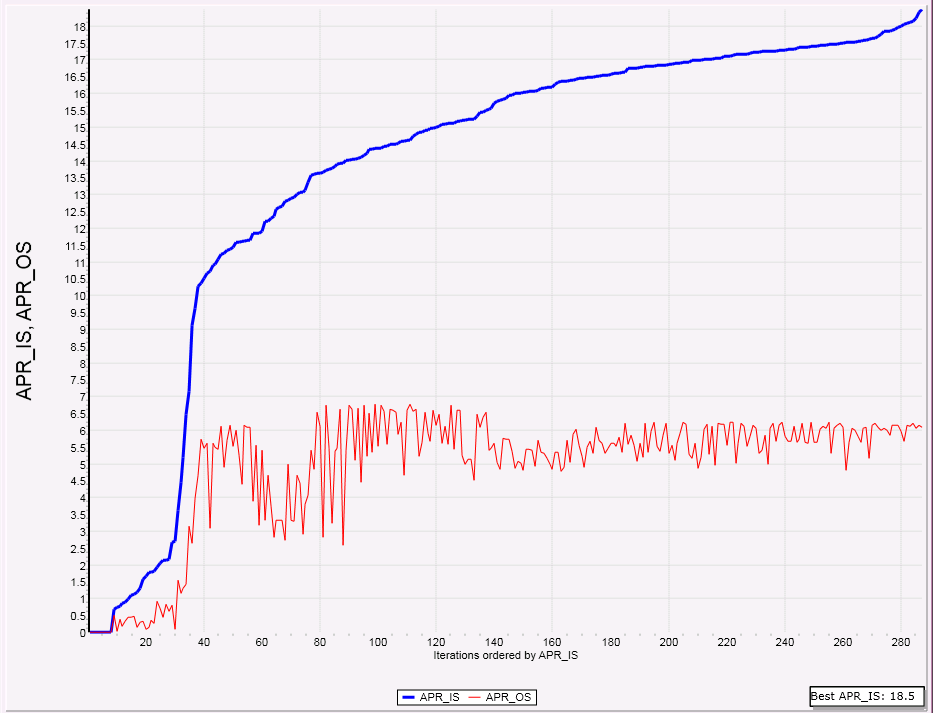
For the Graph below I run "Knife Juggler" and optimized it with the SMAC optimizer for the five years period 2010-2015. The target metric for the SMAC optimizer was "APR":
The results are ordered by increasing APR values (blue line), so we can imagine the optimizer finds better and better parameter sets going from left to right.
If we look at this results alone the "best" parameter set is found in run #300 (the rightmost in the chart) which results in an APR of 18.5 percent.
Next I plotted the APR results for the OOS Interval (2011-2021) with a red line.
For each data point the strategy is run with the same set of parameters as the blue line but on the following five years of data.
It is obvious that the best OOS result happens around run #50 and the OOS results get worse if we optimize further, a clear indication of "over-optimization".
When I see such results, I'd choose the parameter set of run #40 or run #50 for any future use of the strategy, because this parameter set promises more stable results than the "over-optimized" set from runs #60 and above. And run #300 is certainly not the choice I'd take.
In Walk-Forward-Optimization (WFO) the "best" parameter set is selected on the basis of the Insample APR result, so WFO would choose the parameter set of run #300.
Currently I can ask WFO to use the "best" APR_OS parameter set, this would be run #110 but this has proved to be an "unstable" parameter set.
What is required is some "smoothing" of the red curve and based on this curve the selection of the most appropriate parameter set also.
For finding the "best" OOS parameter set WFO should look at the complete red curve, do some smoothing, find the max of the smoothed curve, search a result close to the max of the smoothed curve and so forth.
My suggestion: Delegate this selection process to a ScoreCard. Add a method "return_ best_run_number" which can read the complete result set of an optimizer run and do its magic to return the run number it thinks is best.
In the case at hand it would return run #50 or close by.
This will result in much more stable and superior WFO results which in turn will result in much better real time trading results.
Ok, but Scorecards don’t have access to optimization runs. I’m nit sure what you’re asking belongs in a Scorecard.
QUOTE:
I’m not sure what you’re asking belongs in a Scorecard
I'm not sure either. Probably it is another kind of extension,
the "FindBestOptRun" extension ;)
Clearification: The IS and OOS intervals mentioned in the post above are
Optimization-IS and Optimization-OOS intervals.
The WFO-Is and WFO-OOS intervals are different things:
In fact the whole process described above happens during the WFO-IS interval.
It is Optimization-IS plus Optimization-OOS equals WFO-IS.
The parameter set found with this "Extended Optimization" is then used in the WFO-OOS interval.
I talked about this in a prior post researching WFO optimization seems best in a matrix type analysis. Below is pasted excerpt from my prior post on what another program did for WFO optimization.
A. A matrix or analysis result function to help find most optimal IS runs and OS timeframe. Similar to what strategyquant.com describes here https://strategyquant.com/doc/strategyquant/walk-forward-optimization/
B. A metric tab like standard optimization to display all OS results together if one were re-optimizing their strategy every IS timeframe to compare with parameters from (A) and see how bad the drawdown and upside would be over the entire strategy duration
WFO Matrix example
https://strategyquant.com/doc/strategyquant/walk-forward-matrix/
I find the large gap between the blue and red line in Reply# 3 very troubling. I had no idea OoS results were so different. Obviously, we need to be adding more orthogonal variables to our strategies. And that's why WL comes with IndexLab. But none of my strategies use it. And none of my strategies include the $VIX as part of the strategy model either. :(
Clearly, our strategies need to be built for a more robust trading climate--over time--with more orthogonal variables included besides price and volume. Adding a price trend line helps.
One can only do so much with two orthogonal variables. And we all kind of knew that. But the gap between the blue and red line now underscores this. Very interesting and well presented.
QUOTE:
I’m not sure what you’re asking belongs in a Scorecard
Probably it is better to extend OptimizationVisualizer
(https://www.wealth-lab.com/Support/ExtensionApi/OptimizationVisualizer)
One could have an OptimizationVisualizer which implements the (say) IBestRun interface and returns the best run number.
In WFO one would choose one of these Visualizers which "has" the interface.
The OptimizationVisualizers already have access to all the runs, they can already determine the best run, I’m still not grasping what is really needed from our end 🤷🏼♂️
QUOTE:
... have an OptimizationVisualizer which implements the (say) IBestRun interface and returns the best run number. In WFO one would choose one of these Visualizers which "has" the interface.
But C# allows one to "inherit" multiple interfaces.
CODE:So just define an IBestRun interface in your VS optimizer solution that both the MyOptimizer and MyOptimizerVisualizer will share between their separate project builds. (IBestRun may need to be its own project in the VS optimizer solution.)
public class MyOptimizer : IBestRun, OptimizerBase public class MyOptimizerVisualizer : IBestRun, OptimizerVisualizerBase
There's the issue about what the IBestRun interface will look like, but that's for the developer to decide for now. Perhaps WL may adopt that interface definition in the future if it works out.
QUOTE:
I’m still not grasping what is really needed from our end
So let me describe what is required to make this wonder happen and bring WL and its customers a big step forward...
let me describe the outcome from two perspectives, customer and developer.
(I'll use "magic present" to make this happen quicker...)
The customer's view - User manual
------------------------------------------
in Strategy->Optimize->Optimization Settings->Walk-Forward
There is a ComboBox for the selection of an OptResultViewer and a second ComboBox for the selection of a "mode". Here we can Select the OptResultViewer "MaxOfMetric" with the mode "APR" or "Sharpe Ratio" etc. (This resembles the "old" behaviour")
- or -
we could selcet the "BestOssRun" OptResultViewer with the modes "APR_IS/APR_OS" or "Sharpe_IS/Sharpe_OS" etc.
After each WFO-IS Interval these OptResultViewers will search for the "best" parameter set and return it to WFO which will then run the WFO-OSS Interval with this "best" parameter set.
The developer's view - Implementation
------------------------------------------
OptResultsViewers can (optionally) implement the "IBestRun" Interface.
This interface will return a list of modes and after an optimization run it can return "the best run number".
In WFO the first ComboBox will show the names of all OptResultViewers which implement the "IBestRun" interface.
If one of these is selected it is queried for available modes. These modes are available in the second ComboBox.
After a WFO-IS interval has finished, the selected OptResultviewer is called with the selected mode and all available optimization results for the current interval. The OptResultViewer will return the "best run number" the parameter set of which is used for the WFO-OSS interval.
Example: The "MaxOfMetric" OptResultViewer returns the list of metrics used in optimizations as its list of available modes.
After a WFO Interval has finished it is called with the selceted mode (one of the metrics).
It will search through all optimization results (all parameter sets) for the run with the best value for the selected metric.
(This results in exactly the behavior we have today)
Ok let’s take a step back. The OptResultViewer cannot determine a best run for the wfo, that’s not it’s job.
Why can’t someone just create their own ScoreCard that calculates the “BestRun”? Why do we need this whole new complex architecture to do something a ScoreCard can do anyway.
I’m clearly missing something. Explain how it would work with this data:
Wfo run 1 IS
Parameter value = 1, Profit 100, sharpe 1.0
Parameter value = 2, Profit 120, sharpe 0.9
wfo run 2 IS
Parameter value = 1. Profit 300, sharpe 0.7
Parameter value = 2, Profit 200, sharpe 0.8
There currently is not an optimizer for determining best IS OS timeframe for WFO. It's all manually adjust and re-run and save results and compare to previous run. We need an ISOS timeframe optimizer for WFO which does take a while to execute as it has to run all the WFO scenarios, but is the only way to find the most robust version of any strategy.
QUOTE:
Explain how it would work with this data:
Your example data is a bit too simple to make my point, let me extend it just a little bit to make the task more clear.
Let's assume a perfect optimizer which finds a better solution in every step.
The optimizer works with a Target Metric "APR_IS". The "Metric Columns" contain a metric "APR_OS". Both come form the IS/OS ScoreCard ( these are APR for the optimizer-IS and optimizer-OS intervals.)
We run WFO with this setup:
Wfo run 1 IS
run = 1 Parameter value = 1, APR_IS=10, APR_OS = 8
run = 2 Parameter value = 2, APR_IS=12, APR_OS = 10
run = 3 Parameter value = 3, APR_IS=14, APR_OS = 11
run = 4 Parameter value = 4, APR_IS=15, APR_OS = 10
run = 5 Parameter value = 5, APR_IS=16, APR_OS = 9
wfo run 2 IS
run = 1 Parameter value = 1, APR_IS=12, APR_OS = 10
run = 2 Parameter value = 2, APR_IS=14, APR_OS = 12
run = 3 Parameter value = 3, APR_IS=16, APR_OS = 11
run = 4 Parameter value = 4, APR_IS=18, APR_OS = 13
run = 5 Parameter value = 5, APR_IS=20, APR_OS = 9
If I set "APR_IS" as "Walk-Forward Target Metric" then the current implementation will choose parameter value 5 for the first run and parameter value 5 for the second run because these runs have the best APR_IS value.
The proposed "BestRunFinder" would choose run#3, parameter value 3 for WFO run 1
and probably run#2, parameter value 2 from WFO run #2 becuse this are the "best" APR_OS values.
Please Note: Even if I choose "APR_OS" as "Walk-Forward Target Metric" I come my goal closer but it is not quite what I want/need, because the "APR_OS" values are noisy and just taking the max is not the "best" possible value. That is why the "BestRunFinder" must work a bit more than just taking the max.
(I looked any many of these runs and this example is just a very condensed picture of my findings)
The whole point of the "Walk Forward" is that the Out of Sample information is, as labeled, "Out of Sample." How can you use it to determine which run was best? It defeats the purpose of WFO.
QUOTE:
Why can’t someone just create their own ScoreCard that calculates the “BestRun”? Why do we need this whole new complex architecture to do something a ScoreCard can do anyway?
I now understand the confusion.
So in a "normal" numerical analysis problem one has the same number of equations as they do unknowns. Those problems can be solved uniquely and somewhat directly. For example, it takes three points to define a plane (i.e. planer solution space), so if we have three linearly independent equations we can uniquely define our planer solution. In this circumstance, having the right ScoreCard will solve our system successfully.
Now let's consider a fuzzy numerical analysis problem where we want to fit a plane, but we only have two points (or two linearly independent equations). We can no longer fit our planer solution uniquely. The solution becomes a vector space of many possible planes. With this fuzzy problem, the ScoreCard approach is not enough. Does this make more sense?
Dr Koch and I are approaching this fuzzy problem differently.
1) Dr Koch is saying, let's take the fuzzy system as it is and try to find the "best" possible parameters that produce somewhat usable results over time.
2) My approach is to make the system less fuzzy in the first place by adding additional orthogonal variables ($VIX, McClellan Oscillator from IndexLab, etc) to the system (or strategy).
3) A hedge fund manager's approach is to derive additional equations based on statistical inferences of "current market climate". An example of this is "regularized" regression (if you know what that is). WL has a regularized EMA indicator, which is a similar idea based on statistical inferences. (And what happens to this approach when the market climate suddenly shifts?)
All three methods above can be combined (and they should be), but the numerical system will still remain a fuzzy one. There's no way to remove all the fuzzyness and find the ideal solution. I hope this clarifies this problem better for those trying to follow this.
QUOTE:
The whole point of the "Walk Forward" is that the Out of Sample information is, as labeled, "Out of Sample."
Probably I was not clear enough about this:
With the IS/OS Scorecard it is possible to enahance the optimization process and look at a part of the data as "Optimization-Insample" and part of the data as "Optimization-Out-of-Sample" with the goal to produce graphs like above and make the whole optimization process much mode stable by using this "Overoptimization Detection".
Lets say the combination of an Advanced Optimizer (with Target Metric) and the IS/OS Scorecard allows optimization with overoptimization detection.
This whole process happens during the WFO-IS interval. With all the data of the WFO-IS interval and this "Optimization with overoptimization detection" we find a robust good parameter set.
This parameter set is then applied to the WFO-OOS interval (the data of which was *not* used during optimization)
I admit, it is a bit confusing, but it is correct and the results are spectacular.
I still don’t understand why it cannot be achieved now with the data currently available to a ScoreCard. In your example, you are using OOS values to determine the best run, which is off the table.
QUOTE:
why it cannot be achieved now with the data currently available to a ScoreCard
Because a Scorecard "sees" the result of just one optimizer run.
Do find the "best run" it is necessary to see several optimizer results, do some smoothing across run# compare local maxima with global maxima and so forth.
In the graph above you need to "see" the complete red curve to decide which point is probably the "best". A (current) ScoreCard can't do that.
OK, now that I can understand :) Let's see the best way to integrate something like this.
I'm thinking it will need to be completely new type of entity, like a WFOTargetSelector , that you'll be able to select, instead of selecting "Best/Metric".
I'm thinking it will need to be completely new type of entity, like a WFOTargetSelector , that you'll be able to select, instead of selecting "Best/Metric".
Yes, "WFOTargetSelector" sounds exactly right...
I think posts #7 and #14 by arflouro82 (WFO Matrix analysis) deserve their own #FeatureRequest thread.
(@eugene?)
(@eugene?)
Your Response
Post
Edit Post
Login is required