I'm trying to find the last bar of a point and figure column.
In WL6 I previously used
However in WL7 there is no Plotted property.
I tried to use Index however this sometimes returns the last bar of the column and sometimes a bar earlier in the column.
I also tried to use ColumnAt however this always returns Object reference not set to an instance of an object for Index and other properties.
Perhaps I am not looking in the right place for documentation because I'm also trying to understand point and figure events but so far unsuccessfully.
Thank you for the help.
In WL6 I previously used
CODE:

public int PreviousColumnBar(int bar, int deltaColumns)
        {
            var columnCount = 0;
            int n;
            for (n = bar - 1; n >= 0; n--)
            {
                var pnf = PnfChart.Columns[n];
                if (!pnf.Plotted) continue;
                columnCount++;
                if (columnCount == deltaColumns) return n;
            }
            return n;
        }
However in WL7 there is no Plotted property.
I tried to use Index however this sometimes returns the last bar of the column and sometimes a bar earlier in the column.
I also tried to use ColumnAt however this always returns Object reference not set to an instance of an object for Index and other properties.
Perhaps I am not looking in the right place for documentation because I'm also trying to understand point and figure events but so far unsuccessfully.
Thank you for the help.
Rename
The Index property always returns the last index of data that contributed to the column. Run this code for a visual depiction on the chart.
CODE:

using WealthLab.Backtest;
using System;
using WealthLab.Core;
using WealthLab.TrendChartStyles;
using System.Drawing;
using System.Collections.Generic;

namespace WealthScript1
{
    public class MyStrategy : UserStrategyBase
    {
        //Initialize
        public override void Initialize(BarHistory bars)
        {
         int x1 = 0;
         double y1 = bars.Close[x1];
         PointAndFigure pnf = new PointAndFigure(bars, SourceDataTypes.CloseOnly, PointAndFigureBoxTypes.Traditional, 5.0, 3);
         foreach (PointAndFigureColumn pfc in pnf.Columns)
         {
            int x2 = pfc.Index;
            double y2 = bars.Close[x2];
            DrawRectangle(x1, y1, x2, y2, Color.Navy, 2);
            int boxx1 = x1;
            foreach (PointAndFigureBox pfb in pfc.Boxes)
            {
               int boxx2 = pfb.Index;
               if (pfc.IsRisingX)
               {
                  DrawLine(boxx1, pfb.High, boxx2, pfb.Low, Color.Silver, 2);
                  DrawLine(boxx1, pfb.Low, boxx2, pfb.High, Color.Silver, 2);
               }
               else
                  DrawEllipse(boxx1, pfb.Low, boxx2, pfb.High, Color.Silver, 2);
               boxx1 = boxx2;
            }
            x1 = x2;
            y1 = y2;
         }
        }

        //Execute
        public override void Execute(BarHistory bars, int idx)
        {
            if (OpenPositions.Count == 0)
            {

            }
            else
            {

            }
        }

        //private members

    }
}
It looks like my issue is when using PointAndFigureBoxTypes of Fixed (vs your use of Traditional). BTW: I use HighsAndLows rather than CloseOnly, but that seems to work ok.
I use IQFeed. Example is AAPL. I find it easier to see by reducing the column count, and therefore a box size of 6.58 and rev boxes of 3 which gives me a column count of 11.
My unit test code is here:
Perhaps the issue is my understanding of Fixed vs Traditional Box Type but I go from Thomas Dorsey's book.
I use IQFeed. Example is AAPL. I find it easier to see by reducing the column count, and therefore a box size of 6.58 and rev boxes of 3 which gives me a column count of 11.
My unit test code is here:
CODE:

using System.Drawing;
using WealthLab.Backtest;
using WealthLab.Core;
using WealthLab.TrendChartStyles;

namespace WealthLabStrategies.UnitTests
{
   public class PointAndFigureUnitTests : UserStrategyBase
   {
      public override void Initialize(BarHistory bars)
      {
         //var targetColumnCount = 10;
         _boxSize = 6.58;
         _pnf = new PointAndFigure(bars, SourceDataTypes.HighsAndLows, PointAndFigureBoxTypes.Fixed, _boxSize, 3);
         ShowColumnProperties(bars);
         CheckIndex(bars);
      }
      private void CheckIndex(BarHistory bars)
      {
         if (_pnf.Columns[_pnf.Columns.Count - 1].Index != bars.Count - 1)
         {
            WriteToDebugLog($"{bars.Symbol} Index not bars count {_pnf.Columns[_pnf.Columns.Count - 1].Index}/{bars.Count - 1} (BoxSize: {_boxSize})");
         }
         else
         {
            WriteToDebugLog($"{bars.Symbol} Last Bar correct");
         }
      }
      private void ShowColumnProperties(BarHistory bars)
      {
         DrawHeaderText($"BoxSize: {_boxSize} Column Count: {_pnf.Columns.Count} Scale: {bars.Scale}", Color.Orange, 10);
         var x1 = 0;
         var y1 = bars.Close[x1];
         foreach (var column in _pnf.Columns)
         {
            SetBarColor(bars, column.Index, Color.Orange);
            DrawBarAnnotation($"{column.Index}", column.Index, false, Color.Orange, 9);
            var x2 = column.Index;
            var y2 = column.IsRisingX ? bars.High[x2] : bars.Low[x2];
            DrawRectangle(x1, y1, x2, y2, Color.Navy, 2);
            x1 = x2;
            y1 = y2;
         }
      }

      public override void Execute(BarHistory bars, int idx)
      {
      }

      private PointAndFigure _pnf;
      private double _boxSize;
   }
}
Perhaps the issue is my understanding of Fixed vs Traditional Box Type but I go from Thomas Dorsey's book.
I am certain there is an issue with Point and Figure when in Fixed mode that did not exist in WL6.
There are many occasions where the column after a rising column has a higher bar,
and the same for falling columns, where the column after a falling column has a lower bar.
The column index appears to be incorrect.
I have written code that shows good columns in green and error columns in red plus writes to the debug log on error to prove this.
Portfolio backtesting this on a dataset spits out many errors.
I have used fixed mode point and figure for many years as it provides in my opinion the best way to vectorize the dataset in order to perform machine learning,
and therefore I am unable to use traditional scaling.
My data is from IQFeed but I don't think that makes a difference.
Here is the code that proves the issue
CODE:

using System.Drawing;
using WealthLab.Backtest;
using WealthLab.Core;
using WealthLab.TrendChartStyles;

namespace WealthLabStrategies.UnitTests
{
    public class PnFUnitTests : UserStrategyBase
    {
        public override void Initialize(BarHistory bars)
        {
            var boxSize = 1;
            _pnf = new PointAndFigure(bars, SourceDataTypes.HighsAndLows, PointAndFigureBoxTypes.Fixed, boxSize, 3);
            DrawHeaderText($"column count {_pnf.Columns.Count}", Color.White, 11);
            ErrorProof(bars);
        }
        private void ErrorProof(BarHistory bars)
        {
            if (_pnf.Columns.Count < 2) return;
            for (var i = 0; i < _pnf.Columns.Count - 1; i++)
            {
                SetThisColumn(bars, i);
                SetNextColumn(bars, i);
                VerifyThisColumn(bars, i);
                ShowColumn(bars);
            }
        }
        private void SetThisColumn(BarHistory bars, int i)
        {
            _thisColumnStartBar = i == 0 ? 0 : _pnf.Columns[i - 1].Index + 1;
            _thisColumnEndBar = _pnf.Columns[i].Index;
            _thisColumnLookBack = _thisColumnStartBar == 0
                ? _thisColumnEndBar - _thisColumnStartBar
                : (_thisColumnEndBar - _thisColumnStartBar) + 1;
            if (_thisColumnEndBar == 0) _thisColumnLookBack = 1;
            _thisColumnHighestBar = bars.High.GetHighestBar(_thisColumnEndBar, _thisColumnLookBack);
            _thisColumnLowestBar = bars.Low.GetLowestBar(_thisColumnEndBar, _thisColumnLookBack);
        }
        private void SetNextColumn(BarHistory bars, int i)
        {
            _nextColumnStartBar = _pnf.Columns[i].Index + 1;
            _nextColumnEndBar = _pnf.Columns[i + 1].Index;
            _nextColumnLookBack = (_nextColumnEndBar - _nextColumnStartBar) + 1;
            if (_nextColumnEndBar == 0) _nextColumnLookBack = 1;
            _nextColumnHighestBar = bars.High.GetHighestBar(_nextColumnEndBar, _nextColumnLookBack);
            _nextColumnLowestBar = bars.Low.GetLowestBar(_nextColumnEndBar, _nextColumnLookBack);
        }
        private void VerifyThisColumn(BarHistory bars, int i)
        {
            _color = Color.LightGreen;
            if (_pnf.Columns[i].IsRisingX)
            {
                if (bars.High[_nextColumnHighestBar] > bars.High[_thisColumnHighestBar])
                {
                    ShowError(i, true);
                }
            }

            if (_pnf.Columns[i].IsFallingO)
            {
                if (bars.Low[_nextColumnLowestBar] < bars.Low[_thisColumnLowestBar])
                {
                    ShowError(i, false);
                }
            }
        }
        private void ShowError(int i, bool rising)
        {
            var direction = rising ? "Rising" : "Falling";
            var error = rising ? "higher high" : "lower low";
            var errorBar = rising ? _nextColumnHighestBar : _nextColumnLowestBar;
            _color = Color.Red;
            DrawHeaderText(
                $"Error: column {i} startbar {_thisColumnStartBar} endbar {_thisColumnEndBar} highestbar {_thisColumnHighestBar} lowestbar {_thisColumnLowestBar} lookback {_thisColumnLookBack}",
                Color.Orange, 11);
            WriteToDebugLog($"Error: {direction} column {i} of {_pnf.Columns.Count} at {_pnf.Columns[i].Index} error. Column {i + 1} has a {error} at {errorBar}");
        }
        private void ShowColumn(BarHistory bars)
        {
            var x1 = _thisColumnStartBar;
            var y1 = bars.Low[_thisColumnLowestBar];
            var x2 = _thisColumnEndBar;
            var y2 = bars.High[_thisColumnHighestBar];
            DrawRectangle(x1, y1, x2, y2, _color, 2);
        }
        public override void Execute(BarHistory bars, int idx) {}

        private PointAndFigure _pnf;
        private int _thisColumnStartBar;
        private int _thisColumnEndBar;
        private int _thisColumnLookBack;
        private int _thisColumnHighestBar;
        private int _thisColumnLowestBar;
        private int _nextColumnStartBar;
        private int _nextColumnEndBar;
        private int _nextColumnLookBack;
        private int _nextColumnHighestBar;
        private int _nextColumnLowestBar;
        private Color _color;
    }
}
Here is a chart that shows the columns with issues in Red
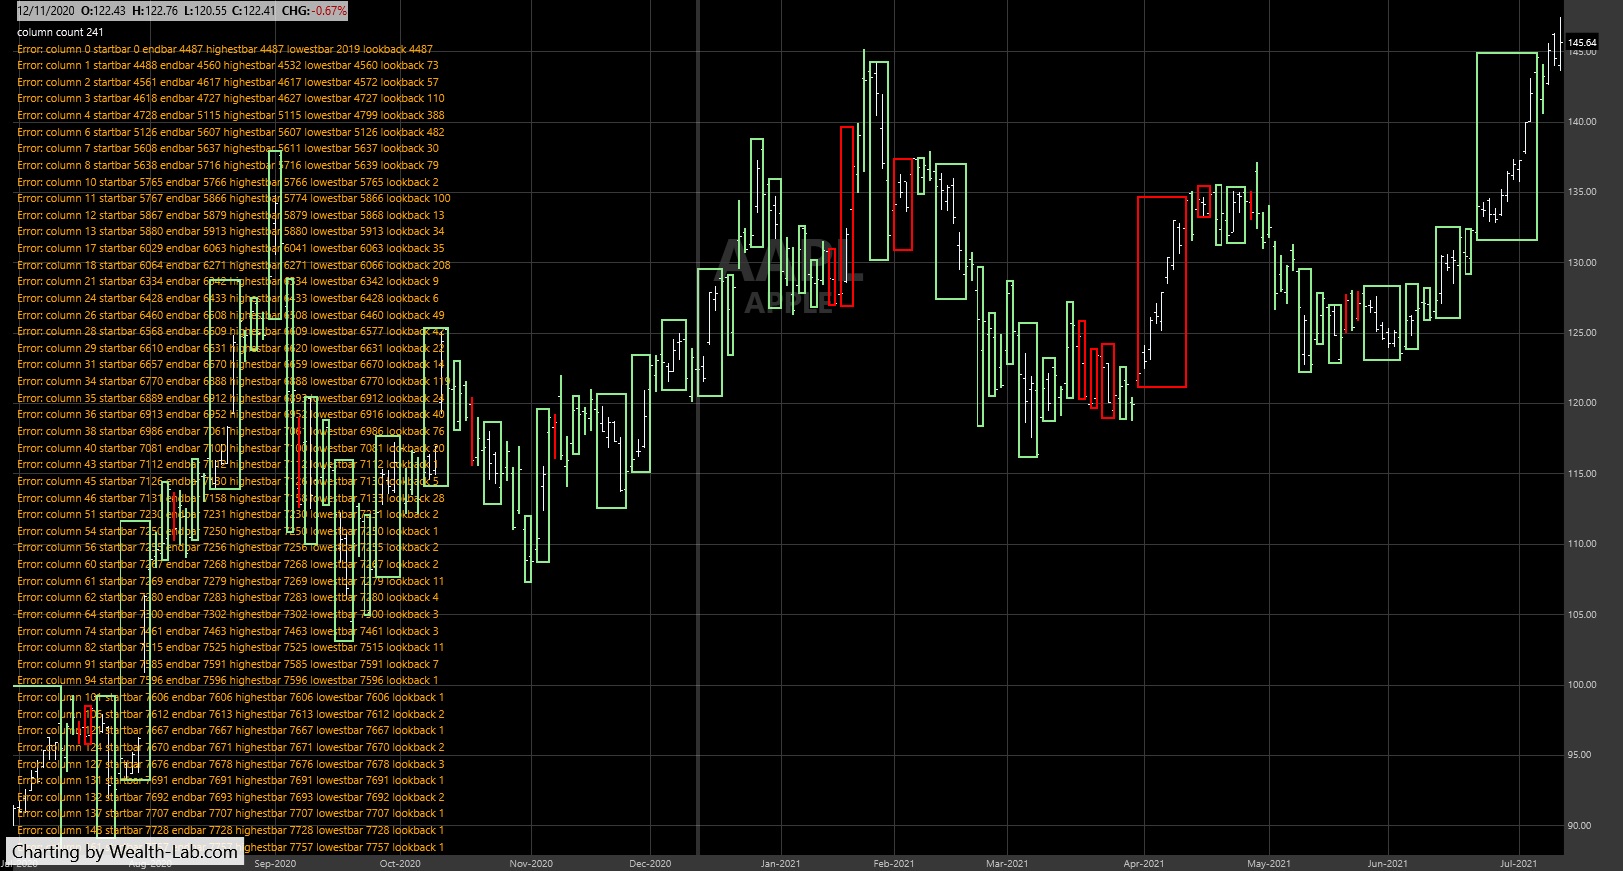
A column after a rising column can have a higher high, as long as it does not exceed the boxsize. Does this make sense? If not, let's isolate a single problematic column for detailed analysis.
Thanks for looking into this, however I don't believe it is correct, and it would mean that point and figure does not achieve its operational function correctly.
I am going from Richard Wyckoff's writing in 1934 and Thomas Dorsey's writing in 1995. I gave away my du Plessis book and I don't have the AW Cohen's text from his work at Chartcraft, but I am certain both say the same.
Both texts I have do not explicitly mention the end of the column, but both refer to the start of the column.
"To change columns requires at least a 3-point[boxSize*revBoxes] move in the opposite direction. Anything less is considered noise"
"you pay no attention to any fluctuations except those of a full [boxSize*revBoxes] or more from that figure", i.e. you stay in the same column.
The flow chart on page 10 of the Dorsey book is definitive to me. Let me know if you need a picture of this.
So the start bar for a new column is the bar on which the boxSize reversal has triggered.
The other case you might be referring to where there is an initial column (move A), and then a downwards reversal is triggered (move B), followed by a higher high than the initial column (move C) then by definition move C must be greater than the boxSize * revBoxes and this should result in a down column followed by another up column.
WL6 does this functionality correctly (well almost all the time, with a couple of exceptions that I have worked around).
I converted the previously posted code to WL6 and proved this functions correctly. I can provide this code if you need it.
But WL7 is has different behavior and I believe is incorrect, plus it breaks my algorithms.
The reason why having the exact start/end bar is important is because it is functionally necessary in order to do calculations for a number of methodologies.
These include finding the lowest point of a formation in order to calculate targets, and comparing multiple columns in specific formations that have the same box extremity to understand the formation type, and finding accurate volume for a column.
To look at a column explicitly:
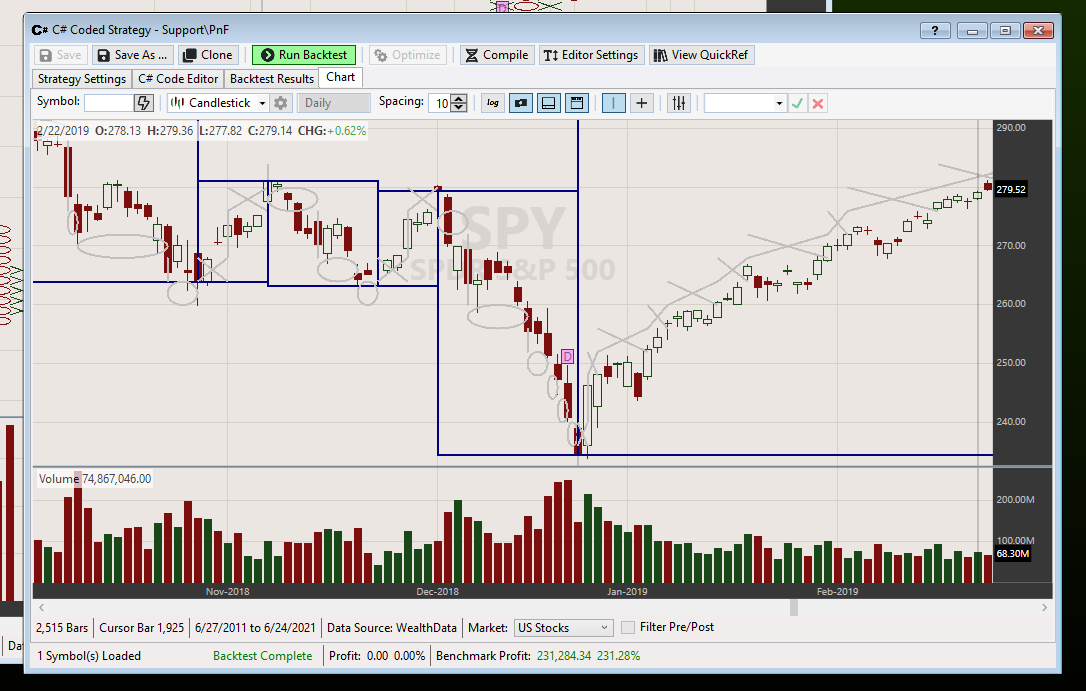
I am looking at IQFeed SPX.XO.
It is easiest to look at with a very large boxSize. I use 150. I am using the code I last posted previously but with line number 12 changed to 150.
Column 0 index is bar 5051 which is also the highest bar of the column, 11 boxes.
Column 1 index is bar 5694.
In 3 box reversal, Column 1 should only trigger (i.e. start bar) when a down move (revBoxes * boxSize, i.e. 3 * 150) from the previous column (150 * (11-1) = 1500) so the trigger is 1050.
which should be bar 5483 (i.e. the start bar), so the end bar for column 0 should 5482.
This would then mean that the previous all time high on bar 5114 would be in column 0 and not column 1.
Let me know if you need images. Thanks again. Phil
I am going from Richard Wyckoff's writing in 1934 and Thomas Dorsey's writing in 1995. I gave away my du Plessis book and I don't have the AW Cohen's text from his work at Chartcraft, but I am certain both say the same.
Both texts I have do not explicitly mention the end of the column, but both refer to the start of the column.
"To change columns requires at least a 3-point[boxSize*revBoxes] move in the opposite direction. Anything less is considered noise"
"you pay no attention to any fluctuations except those of a full [boxSize*revBoxes] or more from that figure", i.e. you stay in the same column.
The flow chart on page 10 of the Dorsey book is definitive to me. Let me know if you need a picture of this.
So the start bar for a new column is the bar on which the boxSize reversal has triggered.
The other case you might be referring to where there is an initial column (move A), and then a downwards reversal is triggered (move B), followed by a higher high than the initial column (move C) then by definition move C must be greater than the boxSize * revBoxes and this should result in a down column followed by another up column.
WL6 does this functionality correctly (well almost all the time, with a couple of exceptions that I have worked around).
I converted the previously posted code to WL6 and proved this functions correctly. I can provide this code if you need it.
But WL7 is has different behavior and I believe is incorrect, plus it breaks my algorithms.
The reason why having the exact start/end bar is important is because it is functionally necessary in order to do calculations for a number of methodologies.
These include finding the lowest point of a formation in order to calculate targets, and comparing multiple columns in specific formations that have the same box extremity to understand the formation type, and finding accurate volume for a column.
To look at a column explicitly:
I am looking at IQFeed SPX.XO.
It is easiest to look at with a very large boxSize. I use 150. I am using the code I last posted previously but with line number 12 changed to 150.
Column 0 index is bar 5051 which is also the highest bar of the column, 11 boxes.
Column 1 index is bar 5694.
In 3 box reversal, Column 1 should only trigger (i.e. start bar) when a down move (revBoxes * boxSize, i.e. 3 * 150) from the previous column (150 * (11-1) = 1500) so the trigger is 1050.
which should be bar 5483 (i.e. the start bar), so the end bar for column 0 should 5482.
This would then mean that the previous all time high on bar 5114 would be in column 0 and not column 1.
Let me know if you need images. Thanks again. Phil
Can we select a non index symbol, a US stock? We don’t have index data in our IQFeed subscription.
The key point I read here is “ you pay no attention to any fluctuations except those of a full [boxSize*revBoxes]”
That’s why if a price goes higher, but does not exceed box size, it’s just considered noise.
Plus in every point and figure chart I’ve seen the X’s and O’s are perfectly aligned to box size.
Are you saying the X column should have added a new box if the high penetrated the last box high but not by a margin of box size?
That seems to go against the principle to me, but let’s select a single stock column and dissect it 🙂
QUOTE:
The key point I read here is “ you pay no attention to any fluctuations except those of a full [boxSize*revBoxes]”
agreed
QUOTE:
That’s why if a price goes higher, but does not exceed box size, it’s just considered noise.
Yes agreed
QUOTE:
Plus in every point and figure chart I’ve seen the X’s and O’s are perfectly aligned to box size.
Yes thats all I've seen, but I do use fractional boxSize regularly for securities with low prices, and I do use large boxes all the time in order to control the column count.
In addition I only use traditional revBoxes (1 & 3) although I have seen other people use other sizes.
These conditions have always been perfectly aligned as you say.
QUOTE:No, the rendering of the rising X boxes as well as the falling O boxes appears correct to me,
Are you saying the X column should have added a new box if the high penetrated the last box high but not by a margin of box size?
Its just I believe the index (end bar) should reflect the bar immediately before the bar that triggers the starting of the downwards Os.
QUOTE:
That seems to go against the principle to me, but let’s select a single stock column and dissect it 🙂
Yes I believe you are correct that changing the display would go against the principle. I'm just looking for the index that marks the end bar. I will follow up with an example tomorrow.
Thanks
While trying to find a good example point and figure chart to work on, I believe I am seeing additional even more significant issues than just index being incorrect.
I looked for stocks with current price roughly 100 in order to make calculations easy, CVX, PM, LYB, SBUX
The column formations can be different when comparing WL7 with WL6. I checked into WL6 and examples I used were consistent with Stockcharts.com suggesting WL7 is in error. Manual inspection of bar by bar also suggested WL7 is in error.
This seems to apply to fixed mode scaling, but also traditional mode.
Briefly checking High/Low vs Close price usage suggested that Close mode was more consistent with WL6 and Stockcharts.com.
I don't understand what I am seeing so I will work on this further tomorrow, through code rather than visual inspection.
I've been wanting to dig back in to P&F Charts (there's a one-step back condition that's missing for 1-box charts), so let me free-up Glitch, who just got started on Monte Carlo-Lab for WL7.
I'm comparing charts for SPY, and I see big differences between WL6 and WL7. Like you say, WL6 appears to match StockCharts. I'll take on this bug!
I'm comparing charts for SPY, and I see big differences between WL6 and WL7. Like you say, WL6 appears to match StockCharts. I'll take on this bug!
Thanks, Robert!
All fixed. Please upgrade to Trend Chart Styles Build 4 now!
https://www.wealth-lab.com/extension/detail/TrendChartStyles
https://www.wealth-lab.com/extension/detail/TrendChartStyles
Thanks for the update. This is great. I now see formations that match WL6 and stockcharts.
I have only checked a few symbols and will check more.
I have not checked I step back yet.
However I still see the index (lastbar) of the column as being incorrect.
I am using code from post 5 above.
A good example to review is SPX.XO because there is no after hours (With IQFeed). Setting box size to 150 reduces the number of columns and makes it easier to see.
I get the following errors. Could you confirm that you see the same?
Error: Rising column 0 of 9 at 5112 error. Column 1 has a higher high at 5114
Error: Falling column 1 of 9 at 5690 error. Column 2 has a lower low at 5752
Error: Rising column 2 of 9 at 6899 error. Column 3 has a higher high at 7011
Error: Falling column 3 of 9 at 7292 error. Column 4 has a lower low at 7363
Error: Rising column 4 of 9 at 9600 error. Column 5 has a higher high at 9767
Error: Falling column 5 of 9 at 9831 error. Column 6 has a lower low at 9832
Error: Rising column 6 of 9 at 10098 error. Column 7 has a higher high at 10120
Thanks again.
I'll take a look.
QUOTE:
I get the following errors. Could you confirm that you see the same?
I see this when running your script, but they're only called "errors" because you are saying they are.
A "falling" O-column following a "rising" X-column can have a higher high in the source data, and likewise a "rising" X-column following a "falling" O-column can have a lower low. These are not errors!
If the higher high isn't sufficient to contribute a box to the column, it's ignored - like it never happened. Simple as that.
Robert,
I disagree. Time moving from oldest to newest bar, the new column only starts when the reversal is triggered. Hence if a column is rising with rising boxes being added as normal, and then a further higher high is experience that did not cause an additional rising box then this must by definition have occurred before the trigger of the next column that must be a falling column. And therefore the index of the last bar of the rising column is the bar immediately before the trigger, and therefore the bar for the higher high must be less than or equal to the index.
Yes I agree.
The current WL7 bahviour is not the same as WL6, because previously the "plotted" property signaled when the column change was triggered, and therefore signaled the first bar of a new column, and therefore I was able to determine the last bar of the previous column. Without this behaviour it makes it impossible for algorithms to find the highest or lowest point and value in a column, making it impossible to determine targets, impossible to determine the most extreme of two columns of the same direction, and makes point and figure unusable except for rough visual use.
QUOTE:
A "falling" O-column following a "rising" X-column can have a higher high in the source data, and likewise a "rising" X-column following a "falling" O-column can have a lower low. These are not errors!
I disagree. Time moving from oldest to newest bar, the new column only starts when the reversal is triggered. Hence if a column is rising with rising boxes being added as normal, and then a further higher high is experience that did not cause an additional rising box then this must by definition have occurred before the trigger of the next column that must be a falling column. And therefore the index of the last bar of the rising column is the bar immediately before the trigger, and therefore the bar for the higher high must be less than or equal to the index.
QUOTE:
If the higher high isn't sufficient to contribute a box to the column, it's ignored - like it never happened. Simple as that.
Yes I agree.
The current WL7 bahviour is not the same as WL6, because previously the "plotted" property signaled when the column change was triggered, and therefore signaled the first bar of a new column, and therefore I was able to determine the last bar of the previous column. Without this behaviour it makes it impossible for algorithms to find the highest or lowest point and value in a column, making it impossible to determine targets, impossible to determine the most extreme of two columns of the same direction, and makes point and figure unusable except for rough visual use.
Yes, it's different than WL6 - different authors ;) WL7's version is lighter, but likely has all the information required.
If you dig into the Boxes list for each column. The list contains PointAndFigureBox instances, and each has an Index property on the bar it was created. Using your variable name, pnfColumn.Boxes[0].Index, for example, will give you the first index of the column since this is when the first box was created. Of course, if it's a 3-box reversal, pnfColumn.Boxes[0].Index, pnfColumn.Boxes[1].Index, and, pnfColumn.Boxes[2].Index will be the same.
If you dig into the Boxes list for each column. The list contains PointAndFigureBox instances, and each has an Index property on the bar it was created. Using your variable name, pnfColumn.Boxes[0].Index, for example, will give you the first index of the column since this is when the first box was created. Of course, if it's a 3-box reversal, pnfColumn.Boxes[0].Index, pnfColumn.Boxes[1].Index, and, pnfColumn.Boxes[2].Index will be the same.
Tested (pnfColumn.Boxes[columnNumber + 1].Index - 1) and it works great and provides me with the last bar of the column.
Thank you for the support.
Thank you for the support.
I'm glad that works for you, but be mindful not to "peek".
If you're doing Point and Figure analysis, by its nature you can't know what the last bar of a column is until the next column has been created.
This is why you have the index of the events that occur, specifically when boxes are formed in columns and also a list of Events - List<PointAndFigureEvent>
The PointAndFigureEvent class has these members:
If you're accessing an index that is after the one being passed to Execute(), that would be peeking.
If you're doing Point and Figure analysis, by its nature you can't know what the last bar of a column is until the next column has been created.
This is why you have the index of the events that occur, specifically when boxes are formed in columns and also a list of Events - List<PointAndFigureEvent>
The PointAndFigureEvent class has these members:
CODE:
        public int Index { get; set; }
        public bool IsUpsideReversal { get; set; }
        public bool IsDownsideReversal (boolean opposite of IsUpsideReversal)
        public bool OneStepBackReversal { get; set; }
If you're accessing an index that is after the one being passed to Execute(), that would be peeking.
Your Response
Post
Edit Post
Login is required