I've been doing (Close - Close) to plot a 0 line in an indicator pane using MathInOpInd, But how can I plot a horizontal line easily at any arbitrary value, e.g. at 8.5 ?
Rename
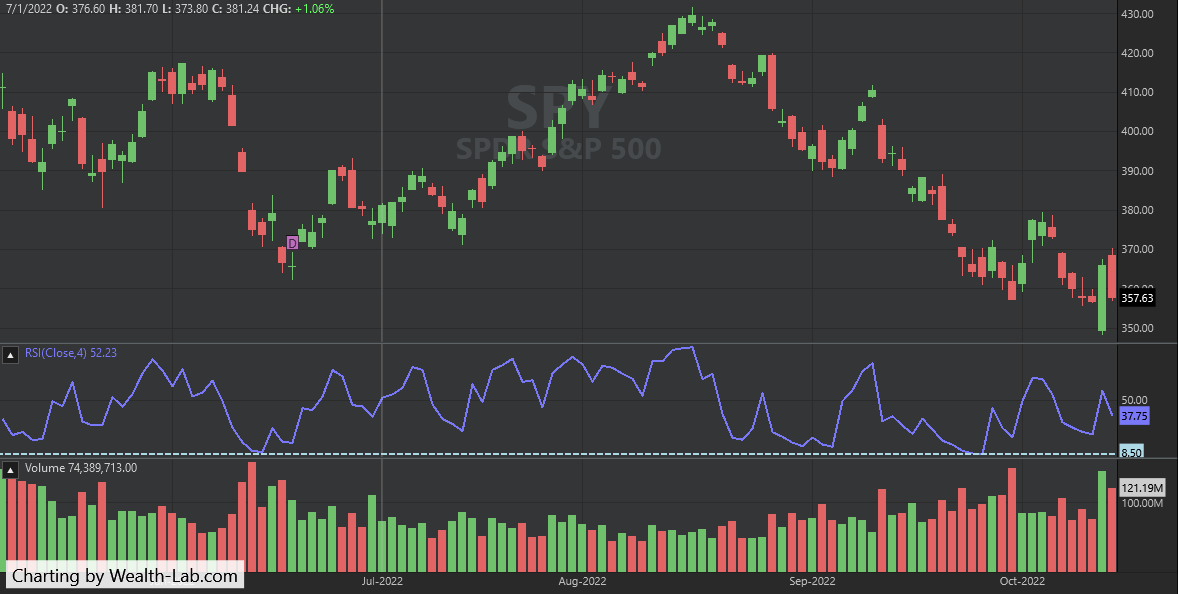
The idea is that you'd use a coded strategy that contains a DrawHorzLine statement for this level of control:
CODE:

using WealthLab.Backtest;
using System;
using WealthLab.Core;
using WealthLab.Indicators;
using System.Collections.Generic;

namespace WealthScript1
{
    public class MyStrategy : UserStrategyBase
    {
        //create indicators and other objects here, this is executed prior to the main trading loop
        public override void Initialize(BarHistory bars)
        {
         rsi4 = RSI.Series(bars.Close, 4);
         rsi4.MassageColors = true;
         PlotIndicator(rsi4);
         DrawHorzLine(8.5, WLColor.LightBlue, 2, LineStyle.Dashed, rsi4.PaneTag);
        }

        //execute the strategy rules here, this is executed once for each bar in the backtest history
        public override void Execute(BarHistory bars, int idx)
        {
        }

      //declare private variables below
      private RSI rsi4;
    }
}
CODE:So the VS Object Browser tells me the MassageColors property is part of IndicatorBase, but the QuickRef docs don't know about this property. What does this property do?
rsi4.MassageColors = true; PlotIndicator(rsi4);
And is there a way to get documentation from the QuickRef without using the VS Object Browser to locate it?
It allows the indicator color to lighten or darken automatically so it can be better seen in the selected Theme. We missed documenting it in the QuickRef but will do so for next build.
Your Response
Post
Edit Post
Login is required