Please make the line plot(s) on the chart for Limit & Stop order Signals generated by the strategy optional. This can easily be done under Preferences.
Thank you.
Thank you.
Rename
This is an example of an imperfect idea that leads to support incidents later. Such as the infamous button that hid the chart's status bar in WL6. Clicked inadvertently, it kills two birds with one stone - disables Optimization and makes Streaming look broken. And leads me to create FAQs that just should not be there!
https://wl6.wealth-lab.com/Forum/Posts/How-do-I-activate-streaming-quote-mode-40646
http://www2.wealth-lab.com/WL5WIKI/kbFAQStrategy.ashx
Although this item in the Preferences would be less visible and so allow less room for a user to shoot himself in the foot, still there were people who made it there in WL6 to disable "Fundamental items" (Lord only knows why) and then wondering why their fundamental data was broken.
If a WealthScript method is expected to produce plots I believe the plot should not be decoupled this way via a preference hard to find. Dixi.
Eugene, we’re not talking about the stop and limit plots. We’re talking about the trade signal lines that Marcel requested.
I needed a visual too, so here's what we're talking about (I think) ...
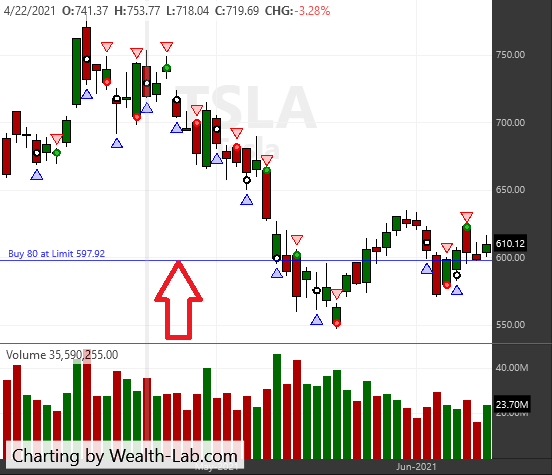
I love the signal line, but I can understand that you may want to share a chart without it.
I love the signal line, but I can understand that you may want to share a chart without it.
QUOTE:
Eugene, we’re not talking about the stop and limit plots. We’re talking about the trade signal lines that Marcel requested.
I know, the lines is what I meant by "plots" - which includes both the dots and the lines.
The lines are independent of the dots.
The dots are controlled by the PlotStopsLimits in Strategy code.
The lines are always plotted.
The dots are controlled by the PlotStopsLimits in Strategy code.
The lines are always plotted.
Now I see. Makes sense.
Your Response
Post
Edit Post
Login is required