I've been working on a new optimizer wrapper to see if I can squeeze a little more out of WL7
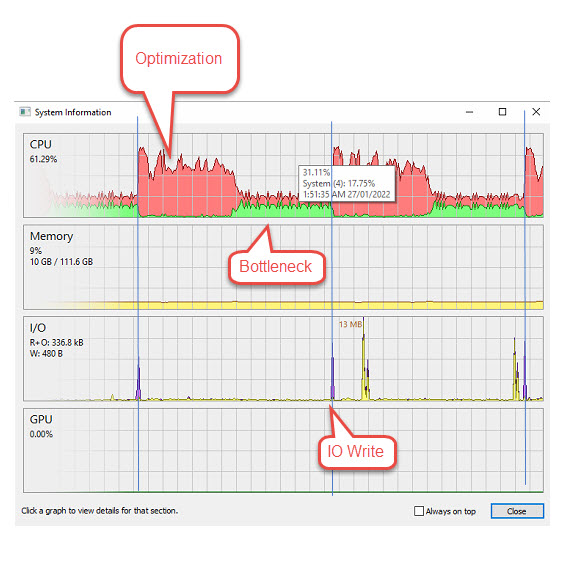
It seems there is a resource bottle neck which I think is the AutoSave (shot in the dark) because it appears to end with an IO Write event. Once that happens the CPU usage skyrockets again. Its a clear pattern.
The bottle neck starts to surface around 3500 runs deep and progressively gets longer as the number of runs increase. It gets quite noticable at the 5000-6000 mark. By the time it reaches 9000, the bottleneck is about equal in time to each burst from the processor.
It seems to occur evenly at about every 60-90 seconds - perhaps timer based?
Are you "appending" your Autosave data or re-creating it entirely prior to dump? Is there a global I can set to disable and test? Like Optimizer.AutoSave = false
I'm a total advocate for the autosave feature, but if I can switch it on and off as needed the performance payoff might be worth the risk of loosing a little extra data. For example, I might set it to save at 5 minutes intervals instead of 60 seconds.
Note: The only file write I use in my entire optimizer is a timer based run speed perfrmance metric once every 5 minutes. It's not overly complex and takes miliseconds to calculate.
Example below of my stats output every 5 minutes:
CODE:
Strategy Name:       EasyMoney
Optimization Method: ProSuite Exhaustive Parallel (Boosted)
Data Set:            DOW 30
Data Range Type:     RecentYears
Most Recent:         30
Data Start Date:     RecentYears
Data End Date:       RecentYears
Optimizer StartTime: 27/01/2022 00:55
Optimizer EndTime:   27/01/2022 02:01
Runs Started:        9260
Runs Completed:      9260
Assigned CPU Cores:  32
Current Threads:     67
Total Duration       0 days, 1 hours, 6 minutes, 15 seconds
Average Run Time (last 60 seconds):    359 milliseconds
# Run's (last 60 seconds):    167
Rename
For sure, it's a performance hit doing the auto-save.
If you want to submit a feature request we can log the enhancement to add an option to disable it.
If you want to submit a feature request we can log the enhancement to add an option to disable it.
ok, I'll set up a feature request:
It looks like the cause is either the autosave or the something else in the "addtoResults" (Duplicate checker?).
Setting addToResults to False appears to solve the performance hit issue. I also noted that the autosave file modified timestamp still changes, but no contents are added with this switch off.
with the switch OFF it shaved 13 minutes off the optimization....
Interesting side note... hitting the INTERIM UPDATES button during this optimization still populates the tabular list... however there are no run numbers and the list is cleared at the end of the optimization :(
It looks like the cause is either the autosave or the something else in the "addtoResults" (Duplicate checker?).
Setting addToResults to False appears to solve the performance hit issue. I also noted that the autosave file modified timestamp still changes, but no contents are added with this switch off.
CODE:
Public Function ExecuteOptimizationRun(pl As ParameterList, Optional bmBacktester As Backtester = Nothing, Optional addToResults As Boolean = True) As OptimizationResult
with the switch OFF it shaved 13 minutes off the optimization....
CODE:
Total Duration       0 days, 0 hours, 53 minutes, 2 seconds
Average Run Time (last 60 seconds):    303.03030303030303030303030303 milliseconds
# Run's (last 60 seconds):    198
---------------END RUN--------------------
Interesting side note... hitting the INTERIM UPDATES button during this optimization still populates the tabular list... however there are no run numbers and the list is cleared at the end of the optimization :(
QUOTE:
For sure, it's a performance hit doing the auto-save.
Just a thought, but if you "dribble out" the records (rather than batch them) to the StreamWriter class, it will block them and write them to disk in the background one cluster at a time without creating a blocking I/O. If you batch them, then it will write multiple clusters at a time, which will create an I/O wait state you want to avoid.
I would avoid using asynchronous I/O to solve this problem. It's not worth the grief in debugging it creates. The exception is when the reader and writer are executing on separate machines, then asynchronous I/O is worth the grief. :(
Feature Request for AutoSave boolean switch added.
However, I've asumed the preparation of the AutoSave data is the issue based on the breif IO Write event that occurs immediately before the CPU fires up again. It may be another section of code that runs when "addToResults=true" .
Whatever it is, it appears to block all other StrategyOptimizer threads. It could be a syncLock on an object that is used across all instances while updating results.
Yes there is a lock in place to avoid exceptions that were occurring!
QUOTE:
Yes there is a lock in place to avoid exceptions that were occurring!
I noticed they weren't in the tabular reults! Nice work finding the cause. I wonder if that is the issue. I might roll back to a previous WL7 and run the same test to compare. this will give us a clue as to whether its the synclock or the AutoSave causing the bottleneck.
QUOTE:
... whether its the synclock or the AutoSave causing the bottleneck.
My "guess" is that it's both. The synclock kills CPU utilization and batching the summation report to disk creates a multiple disk cluster writes, which leads to I/O blocking.
The only solution would be to have the individual optimization threads report their trace output to another independent thread via a big FIFO queue (.NET datatype)--independent of the optimizer process--that would compile and write the summation report to disk. The only good thing about the big FIFO queue solution is you "may" be able to drop the synclocking if the FIFO queue is big enough. But I think it's impossible to make the FIFO queue big enough because the disk is just too slow. It's an impossible solution with a slow disk; the disk will remain the bottleneck regardless of the design. :(
Does Windows let you set thread priorities? If so, give the reader of the FIFO queue highest priority and pray that the disk keeps up.
@superticker I believe @Glitch is referring to the syncLock introduced to eliminate the error when the results collection is modified. Discussed here: https://www.wealth-lab.com/Discussion/Optimization-File-Collection-was-modified-enumeration-operation-may-not-execute-7145
I've just conducted a test on BUILD 43 - prior to SyncLock introducion in the addToResults routines.
The bottleneck is not present with Build 43. So i'm thinking SyncLock is more likely the culprit than AutoSave.
In Build 43 The overall average performance drops (average 150 runs per minute - down from ~180) during the first 2000 runs, but the lack of bottleneck and the consistency of the CPU utilizations over the next 7000 runs results in faster overall times. (57mins - down from 1hr 6mins ). Considering the increasing degredation of speed i have no doubt the difference would continue to grow over a longer period.
If a solution can be created to maintain the 180per minute rate then the overall time would drop by anther 16-20% - a considerable amount of time.
Build 43 ProcessorWatch (after 7000 runs) - no bottleneck
It's difficult to offer suggestions on solutions but there are several strategies that could be utilized to optimize the code.
I think a queueing system might work where the results from Backtesters are only added to the queue, no enumeration. You can then send the queue to a seperate thread for processing and updating of the queue item and results collection. This would be done with a for-i-loop not a for-each-loop to avoid error with a static pointer to lastprocessedQueueItem
I'd be happy to work on a solution. I just need to better understand what the SyncLocked section is trying to achieve.
I've just conducted a test on BUILD 43 - prior to SyncLock introducion in the addToResults routines.
The bottleneck is not present with Build 43. So i'm thinking SyncLock is more likely the culprit than AutoSave.
In Build 43 The overall average performance drops (average 150 runs per minute - down from ~180) during the first 2000 runs, but the lack of bottleneck and the consistency of the CPU utilizations over the next 7000 runs results in faster overall times. (57mins - down from 1hr 6mins ). Considering the increasing degredation of speed i have no doubt the difference would continue to grow over a longer period.
If a solution can be created to maintain the 180per minute rate then the overall time would drop by anther 16-20% - a considerable amount of time.
Build 43 ProcessorWatch (after 7000 runs) - no bottleneck
CODE:

WealthLab7 Build:   43
Strategy Name:       EasyMoney
Optimization Method: ProSuite Exhaustive Parallel (Boosted)
Data Set:            DOW 30
Data Range Type:     RecentYears
Most Recent:         30
Data Start Date:     RecentYears
Data End Date:       RecentYears
Optimizer StartTime: 27/01/2022 13:43
Optimizer EndTime:   27/01/2022 14:40
Runs Started:        9260
Runs Completed:      9260
Assigned CPU Cores:  32
Current Threads:     64
Total Duration       0 days, 0 hours, 57 minutes, 8 seconds
Average Run Time (last 60 seconds):    310.88082901554404145077720207 milliseconds
# Run's (last 60 seconds):    193
---------------END RUN--------------------
It's difficult to offer suggestions on solutions but there are several strategies that could be utilized to optimize the code.
I think a queueing system might work where the results from Backtesters are only added to the queue, no enumeration. You can then send the queue to a seperate thread for processing and updating of the queue item and results collection. This would be done with a for-i-loop not a for-each-loop to avoid error with a static pointer to lastprocessedQueueItem
I'd be happy to work on a solution. I just need to better understand what the SyncLocked section is trying to achieve.
So I just discovered the .Results.Add function. With this I can call the optimizer, then add the results manually to the results collection.
With this I should be able to create and test a queueing system that allows the threads to keep working while the resutls are added in the bakground....
Stay tuned....
CODE:
                Dim OptimizerResult = MyStrategyOptimizer.ExecuteOptimizationRun(Params,, False)
                MyStrategyOptimizer.Results.Add(OptimizerResult)
With this I should be able to create and test a queueing system that allows the threads to keep working while the resutls are added in the bakground....
Stay tuned....
So, I've created a queueing system for the OptimizationResults returned by each thread. I have another thread running contunally checking the queue for updates and processing (adding them to the results list) them when needed.
Unfortunately it looks like queueing the Results.add to a single thread manager doesn't improve the bottleneck.
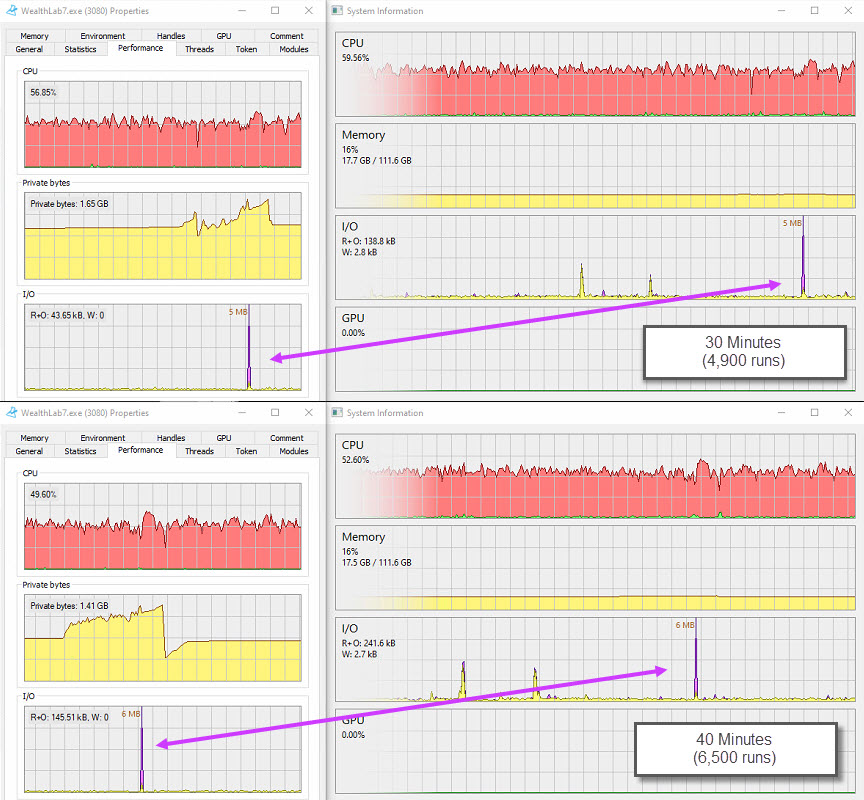
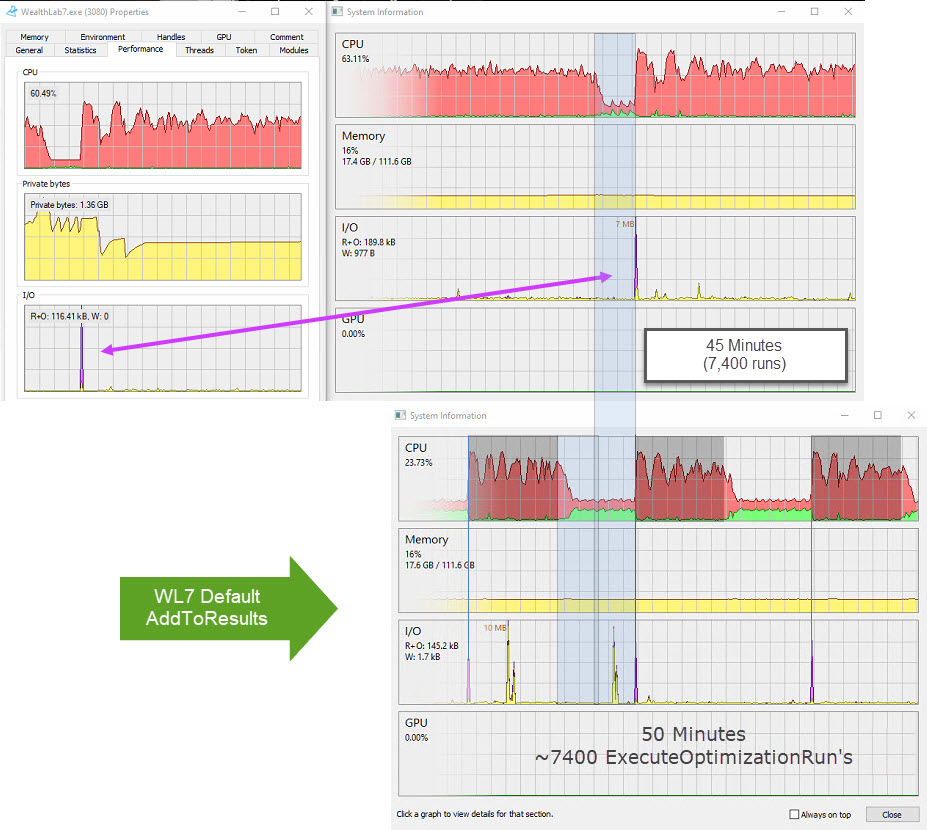
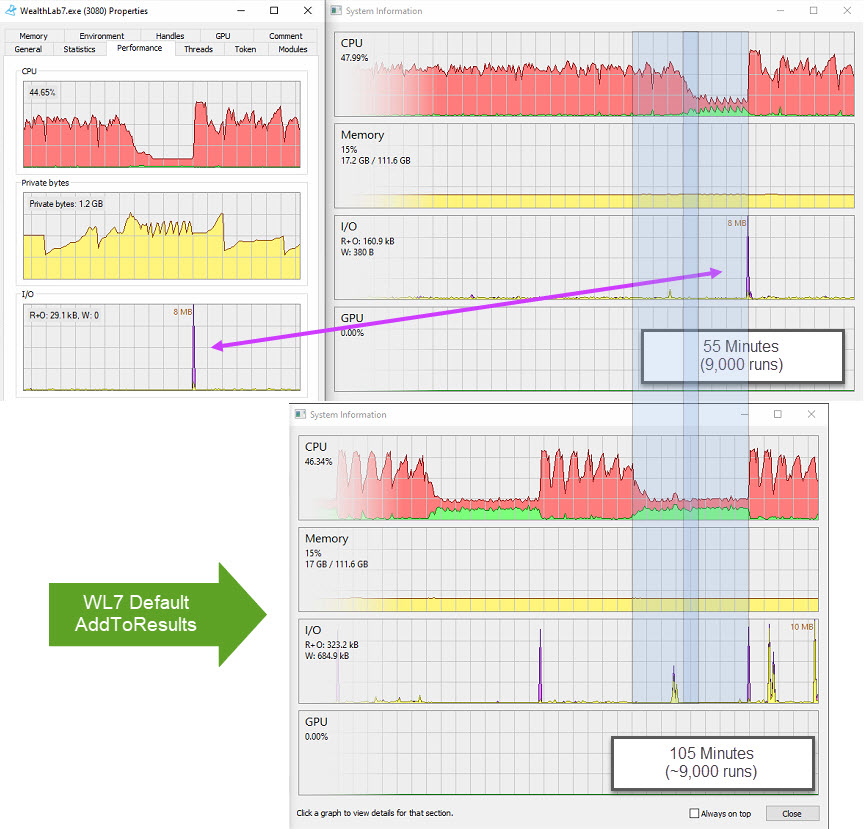
The below infographic shows a clear timed pattern that ends with an IO Write. Note the IO write itself is very small. In this case, it's less than 9mb after an hour (this matches the AutosaveFile size)
Whatever is happening before that write contains the blocking code.
(I assume looping through the ResultsList to create the Optimization Recovery File - as the resultsList grows, so does the blocking period)
We can see clearly that CPU utilization explodes immediately after the file write occurs, then, at about the 1 minute mark from the Write event the CPU utilization drops quickly.
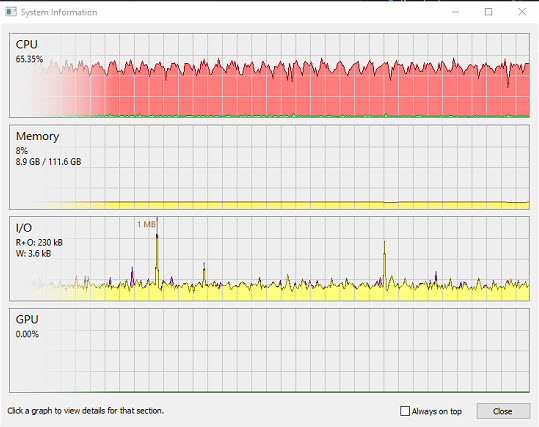
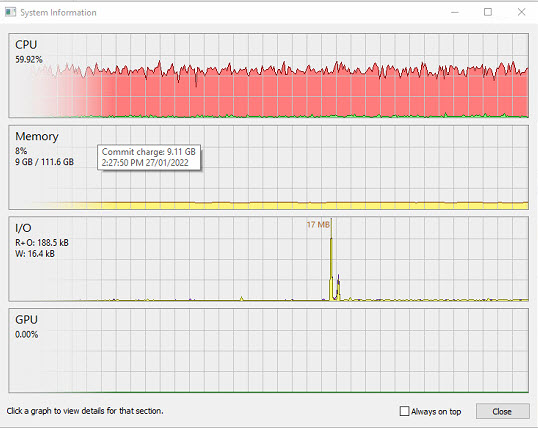
I've included screen grabs at 5 minute intervals to show the rate of performance degridation as the blocking duration grows (I assume this is due to the increasing size of the Results List and dumping the whole Resultlist on each pass rather than appending to the File).
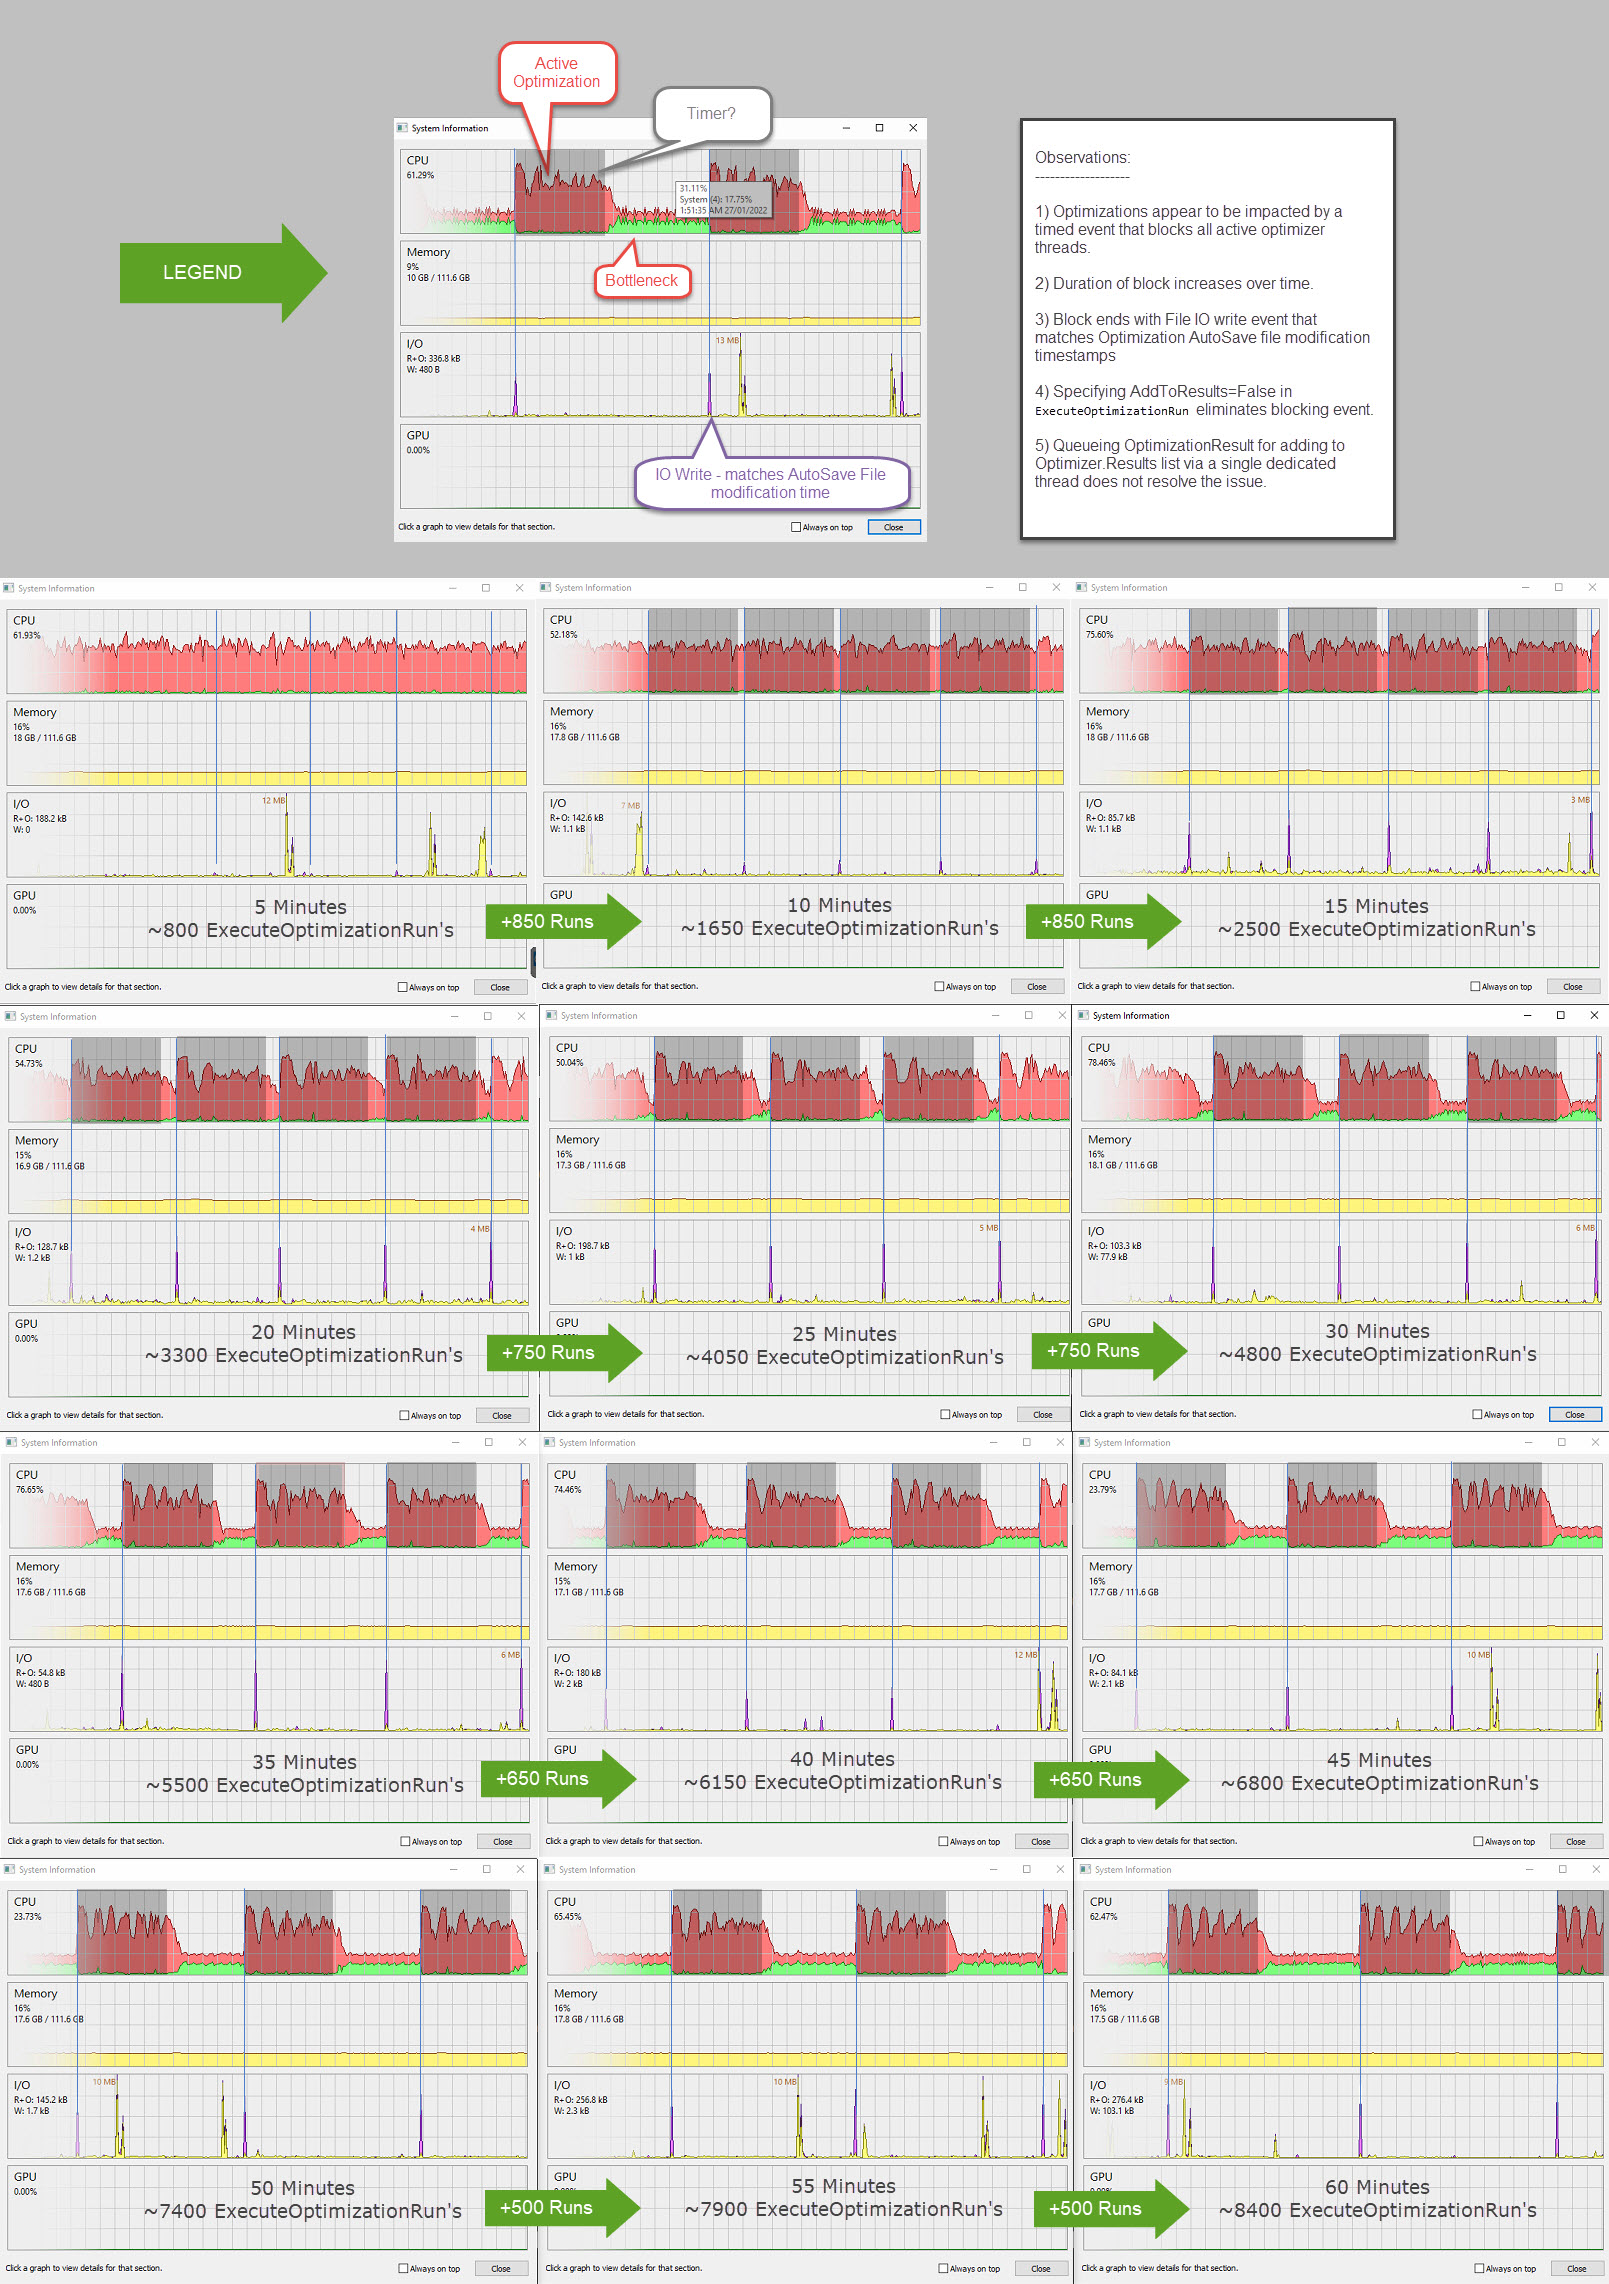
Based on what i am seeing here I have drawn the following conclusions:
1) The code containing the block is triggered by a timer or time-based event
2) The AutoSave loops through the entire ResultsList on each run and utilizes a SyncLock <-- which is perhaps to broad (Locking more than the results list)
My suggestions for improvement:
1) Allow user or coder to set timer interval for Autosave. Or disable completely.
2) Use an append mechanism for Saving data whereby Static Pointers hold the index of the last list item previously included in the AutoSave file. Start from the next ResultList item afte rthe pointer and append data to the AutoSaveFile. (Order of data in file may need to change - so import would need identify file export version type and choose import method to remain backwards compatible)
3) If not already, make sure the code causing the lock is using clone/copies of Lists(of T) (and any lists objects within them. ie: ResultsList, parameterList, metrics, etc). If the contents of a list are references to list objects (not clones) does cloning the List clone the referenced object or just the references? Alternatively, implement a threadsafe object from the System.Collections.Concurrent namespace. Most can be coppied to an array for ordering and iteration allowing other threads to continue adding/removing/updating.
A final question that might help diagnose: Are you locking the list object, or a codeblock that runs on multiple threads?
I think thats about all I can do to investigate this issue. In its current form the rate of performance degradation is significant. In a little over 1 hour performce dropped by half. From 850 runs per 5 minutes down to 400 per five minutes at the 1 hour 10 minute mark. At that rate, within 2 hours the optimzer speed is reduced to a snail's pace.
Unfortunately it looks like queueing the Results.add to a single thread manager doesn't improve the bottleneck.
The below infographic shows a clear timed pattern that ends with an IO Write. Note the IO write itself is very small. In this case, it's less than 9mb after an hour (this matches the AutosaveFile size)
Whatever is happening before that write contains the blocking code.
(I assume looping through the ResultsList to create the Optimization Recovery File - as the resultsList grows, so does the blocking period)
We can see clearly that CPU utilization explodes immediately after the file write occurs, then, at about the 1 minute mark from the Write event the CPU utilization drops quickly.
I've included screen grabs at 5 minute intervals to show the rate of performance degridation as the blocking duration grows (I assume this is due to the increasing size of the Results List and dumping the whole Resultlist on each pass rather than appending to the File).
Based on what i am seeing here I have drawn the following conclusions:
1) The code containing the block is triggered by a timer or time-based event
2) The AutoSave loops through the entire ResultsList on each run and utilizes a SyncLock <-- which is perhaps to broad (Locking more than the results list)
My suggestions for improvement:
1) Allow user or coder to set timer interval for Autosave. Or disable completely.
2) Use an append mechanism for Saving data whereby Static Pointers hold the index of the last list item previously included in the AutoSave file. Start from the next ResultList item afte rthe pointer and append data to the AutoSaveFile. (Order of data in file may need to change - so import would need identify file export version type and choose import method to remain backwards compatible)
3) If not already, make sure the code causing the lock is using clone/copies of Lists(of T) (and any lists objects within them. ie: ResultsList, parameterList, metrics, etc). If the contents of a list are references to list objects (not clones) does cloning the List clone the referenced object or just the references? Alternatively, implement a threadsafe object from the System.Collections.Concurrent namespace. Most can be coppied to an array for ordering and iteration allowing other threads to continue adding/removing/updating.
A final question that might help diagnose: Are you locking the list object, or a codeblock that runs on multiple threads?
CODE:
 Examples:

'lock list object application wide while enumerating
SyncLock(StrategyOptimizer)
   for each listItem in StrategyOptimizer.Results
     ' retrieve data for autosave
  next
End SyncLock

or

' lock code block  <-- avoid race conditions
Private ListLock as new object
SyncLock(ListLock)
  ' add something to a list
End SyncLock

'helps avoid threads trying to add at the same time resulting in one or more items being dropped (often without error)

^ Note: There are other ways to for-loop for read access without using synclock or list copys some are a little creative, but they seem to work. Let me know if you'd like an example.
I think thats about all I can do to investigate this issue. In its current form the rate of performance degradation is significant. In a little over 1 hour performce dropped by half. From 850 runs per 5 minutes down to 400 per five minutes at the 1 hour 10 minute mark. At that rate, within 2 hours the optimzer speed is reduced to a snail's pace.
I'm very impressed with the above analysis. The fundamental problem is the current design of the SyncLock kills CPU utilization. That needs to be addressed somehow.
I don't fully understand why exceptions are thrown without the SyncLock. That would need to be researched before the SyncLock design could be implemented in a less intrusive way that wouldn't affect CPU utilization as much.
To take a "wild guess", I'm thinking this is reader/writer problem and the writers need to write into a thread-safe FIFO queue so they aren't stepping over each other. I don't particularly like thread-safe implementations because they tie the hands of the Windows scheduler (and create overhead for the scheduler), but I don't like killing CPU utilization either. It's a trade off.
On this FIFO queuing business, one needs to scale back the material all be writers are dumping into the queue so a single reader at high priority can keep up. Is this doable?
Update....
I've continued working on two areas of enhancement:
1) The queueing system (Refined further) for OptimizationResults
2) I now store results and add them to the ResultsList via a timed interval of 10 minutes.
The changes made have resulted in a sigificant speed boost. But they have not resolved the bottleneck issue.
In Build 43, I can generate runs speeds of 1,200 runs per 5 minutes during the first 20 minitues with no Exceptions when adding results and synclock not required for adding to ResultsList.
However, when I use the same machine, strategy, data, settings etc in build 45, the result is only 800 runs per five-minutes.
Beyond the first 20 minutes the bottleneck begins to erode performance.
Completion times for optimization with 9,261 runs are:
Build 43: 51 min 43 sec (aprox. avg. 178 runs per minute)
Build 45: 1 hr 5 min 50 sec (aprox. avg. 136 runs per minute)
We see a 1.27 x increase in time taken. (or decease of 42 runs per minute)
Even with the bottle neck resolved, what build 43 could do in 2 hours, will take nearly 3 with Build 45. If not resolved the degridation of performance may results in a "multiple factors" difference.
Without the enhancements noted above the native Exhaustive Optimizer takes:
1 hr 28min (aprox. avg. 105 runs per minute)
That's 1.33 times slower than the enhanced-no-error (no-resultslist-synclock) version...
And 1.7 times slower than the enhancements running on Build 43
There is no doubt in my mind that changes made to Build 44 and 45 have had a significant impact on optimization speed.
@Glitch - Can we roll back the changes introduced?
I'm happy to share with you how I've managed to add to the ResultsList without causing errors and help create a solution that retains performance (maybe even enhances it).
No, we can't roll back any changes. They were put in place to prevent exceptions that were adversely affecting optimizations for users.
@Glitch what I'm proposing is that the solution implemented be replaced with something that resolves the exceptions while maintaining performance. I am happy to help create that solution.
For a quick fix, we are going to bump the auto-save interval to 3 minutes for B47. And I did de-couple the saving to file from the optimization run itself, so it's not within the "lock" and the optimization won't need to wait for it. So let's see how much this improves things for B47.
OK great. Fingers cross that deals with the bulk of the issue.
For comparison, if I hold the results and only add to the list at the end of the run i get speeds of 900+ per 5 minute period. (Build 46)
Total run time for 9261 runs is 51 minutes 10 seconds.
Also, I've found the function for saving the OptimizationFile. I'll incorporate this in my "addtoresults" management thread and see if it has any impact on performance.
Update from my end.
The SaveOptimizationResults appears to be working correctly. I can load in the produced files without error and all settings seem to be correct.
The comparison (Build 46) with previous tests is interesting.
This test utilizes:
1) An Object (ResultsQueue) to Store OptimizationResults from n-threads. (I do not add to the ResultsList because this triggers the inbuilt AutoSave)
2) A dedicated Backgroundworker that:
a) Creates a new OptimizationResultsList and passes it directly to the SavedOptimizationManager.SaveOptimizationResults function every 5 minutes
b) Adds all ResultsQueue.items to the ResultsList when the Optimization is complete (For display in the GUI)
The Outcome:
- Similar speed to build 43 (Pre-SyncLock) - about 15-20% improvement in speed compared with current WL7 default optimization with autosave.
- Decrease in performance compared with save at end-of-optimization only. (approximately 8-10%)
- No bottleneck is present in the first 40 minutes (~7000 runs) with average speed dropping from 181 per minute to 162 per minute over the entire optimization (aprox. 10% decrease in speed)
- When bottleneck does appear, it is about 40% shorter in time when compare with previous tests at the same number of runs.
It will be interesting to see if the changes in Build 47 with SyncLock retained will produce a similar outcome.
Also, I noticed the SavedOptimizationsManager in the Backtest base class is Sealed (NotInheritable). I can successfully call the SaveOptimizationResults function directly, but i can't create a New instance of SavedOptimizationsManager.
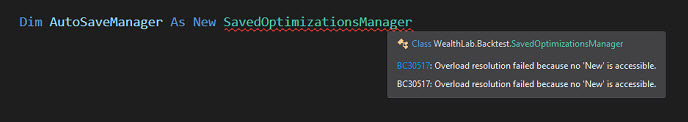
@Glitch - Are you using an instance created in and owned by the base class. Could this be contributing to the resource lock-up if SaveOptimizationResults is being called from another thread (including timers)?
The SaveOptimizationResults appears to be working correctly. I can load in the produced files without error and all settings seem to be correct.
The comparison (Build 46) with previous tests is interesting.
This test utilizes:
1) An Object (ResultsQueue) to Store OptimizationResults from n-threads. (I do not add to the ResultsList because this triggers the inbuilt AutoSave)
2) A dedicated Backgroundworker that:
a) Creates a new OptimizationResultsList and passes it directly to the SavedOptimizationManager.SaveOptimizationResults function every 5 minutes
b) Adds all ResultsQueue.items to the ResultsList when the Optimization is complete (For display in the GUI)
The Outcome:
- Similar speed to build 43 (Pre-SyncLock) - about 15-20% improvement in speed compared with current WL7 default optimization with autosave.
- Decrease in performance compared with save at end-of-optimization only. (approximately 8-10%)
- No bottleneck is present in the first 40 minutes (~7000 runs) with average speed dropping from 181 per minute to 162 per minute over the entire optimization (aprox. 10% decrease in speed)
- When bottleneck does appear, it is about 40% shorter in time when compare with previous tests at the same number of runs.
It will be interesting to see if the changes in Build 47 with SyncLock retained will produce a similar outcome.
Also, I noticed the SavedOptimizationsManager in the Backtest base class is Sealed (NotInheritable). I can successfully call the SaveOptimizationResults function directly, but i can't create a New instance of SavedOptimizationsManager.
@Glitch - Are you using an instance created in and owned by the base class. Could this be contributing to the resource lock-up if SaveOptimizationResults is being called from another thread (including timers)?
It’s a static class, which is why it shows up as sealed.
ok, looks like i've got some reading to do (C# is not my strong suit!)
From what I understand of Static Classes, they are similar to vb.net Shared in which case, they should run on the calling thread.
From what I understand of Static Classes, they are similar to vb.net Shared in which case, they should run on the calling thread.
Well, you access a static class just by calling its methods, and you can call its methods from any thread.
Sure, but calling from a thread does not inherently mean it runs on the calling thread (at least not in vb.net).... But I don't get any cross thread exceptions and from what I've read it "should" run on the calling thread.
The reason I'm pondering this is due to the smaller bottleneck that is apearing after the 7400 run mark andshowing the same relative "increase over time". I'll wait until you've released version 47 before testing again. It's possible changes made may eliminate it. But if not, I'd like to determine the cause.
The reason I'm pondering this is due to the smaller bottleneck that is apearing after the 7400 run mark andshowing the same relative "increase over time". I'll wait until you've released version 47 before testing again. It's possible changes made may eliminate it. But if not, I'd like to determine the cause.
I think it does mean that. To change threads in .Net you need to take some kind of action.
I've found some time to run tests on build 48. This bottle neck appears to have been resolved in both Native and custom exhaustive optimizers.
Thank you @Glitch.
Will we be able to completely disable AutoSave and handle it manually in the future? or set period value?
Side note: When I hold the Optimization Results from the results list the estimated time to completion does not update even if I report progress with MyStrategyOptimizer.ReportEstimatedCompletion(CompletedRuns * 100.0 / totalRuns)
It looks like the GUI update is reliant on the result list being populated.. Is this correct?
Yes that’s correct.
Your Response
Post
Edit Post
Login is required