Hello everyone,
I have recently realized, after about 11 months of working on one or two strategies, that I fell into the trap of over-optimization. I have realized that the next step in my algo trading journey is to develop much simpler systems in number to help smooth my equity curve and avoid correlation (using only one system means 100% correlation, I have only recently realized).
I was hoping to start a discussion on the topic. So that I might learn from the experience of others and more clearly understand the theory and mathematics behind over-optimization and why it is harmful. I would love your ideas, advice, and links to anything you think is useful.
As it stands I am still proud of my behemoth strategy, as it is optimized over a decently long time-frame, and I have discovered a great many profitable indicators and methods of applying them in its development. So I basically need to change my own mind and get past my misconceptions.
Why is it bad to use the power of a huge data set and a ton of ideas into a single strategy? Could it be good? Are there sound mathematical formulas and indicators we can apply to our strategies to understand when you are in the territory of over-optimization?
I can start off:
I think over-optimization is bad in that it is an inefficient process after a certain number of variables. The value of each added variable falls off exponentially. And worst of all, this falling value does not show up in a backtest. In fact the backtest will tell you the opposite, resulting in real world results that are disappointing to say the least.
It is usually more productive and profitable to analyze new strategies with the indicators you might be interested in than to add them to an existing strategy. This will give you a much clearer picture of their usefulness.
I need to work on that last part, but before I do, I hope you guys might help point me in the right direction!
Rename
QUOTE:
I think over-optimization is bad in that it is an inefficient process after a certain number of variables.
My production strategies don't have more than 4 or 5 parameters I use for optimization. Also, I don't employ parameters that affect the trading outcome directly. Rather these parameters steer adaptive "indicators", which then make the trading decisions.
Understand, you are having the optimizer set a parameter that's going to remain static until you run the optimizer again (say in 6 months). But the market is constantly changing between these 6-month intervals, so your trading cannot be based on 6-month static parameters.
Some indicators like MACD are intrinsically adaptive over time. It has "memory" that compares the past with the present and suggests a short-term future trend. That's a plus. But most prototype (older) indicators are not adaptive. You need to either create adaptive indicators out of them, or you need to use their modern equivalents that have been updated to be adaptive.
The other usage for static parameters (which the optimizer sets) is to set conditional probabilities which steer robust statistical algorithms. For example, when you set a trailing stop, there's a statistical chance you could set it too high and not sell soon enough, or too low and sell it too soon. So you're using the static parameters to set your "risk" by specifying a probability that steers your statistical algorithm which determines the appropriate trailing stop price to sell. My point is that your statistical algorithm is adaptive; whereas, your probability risk parameter is not. Let what's adaptive steer the actual trading.
Use static parameters to "tune" adaptive indicators that in turn make the trading decisions. Never use static parameters to make trading decisions directly.
QUOTE:
more clearly understand the theory and mathematics behind over-optimization and why it is harmful.
Basics
Every engineer tries to improve her designs to make them work as good as possible in the real world. The same goes for a system developer and her trading systems.
There is one important difference between an engineer who creates some machinery and the strategy developer: The world an engine lives in usually does not change much, and therefore is rather predictable.
A financial price series on the other hand is mostly noise, a true random walk with some minor deviations that are the true and only trading opportunities. And these deviations also change all the time. This means any design and any change to the design based on some "example data" (data form the past, data used in a backtest) has a high risk to *not work* in the future (on new data, on unseen data).
Sounds depressing? Its is!
The good news
Now the good news. Within Wealth-Lab and its extensions there are all the tools available to
* detect over-optimization
* measure over-optimization and
* avoid overoptimization
it just takes some time to explain things...
The basic trick
There is basically one trick that is the basis to handle optimizations: Use several sets of data.
* One set of data for design/development/changes/optimizations/proof of concept.
* Another set of data to check if any changes to the design works on "unseen" data.
Usually we call the first set "Insample" and it is older data.
The second set is called "Out-of-Sample". usually it is newer data.
Some people make the new data Insample and the old data OutOfSample, but this proves less useful: System developed this way tend to work worse on real future data.
Let me summarize this step: Instead of developing something on the last 5 years and then get bad results in realtime trading we "simulate" the process by developing on older data and simulate realtime trading on newer data. Here we can find out if we over-optimized without losing real money.
The process
The basic process works like this
1. divide your historical data in two parts: Insample and OutOfSample
2: work, analyse, improve on Insample data *only*
3. If you are happy with the results run your system *once* on Out-of-Sample data.
The whole process can be done with vanilla WL. It involves some manual work like changing the data range and rerun the backtest but it is possible without further software.
It is just much simpler if you use some extensions. This is explained in a follow up post.
The Tools
There is one extension that helps with the process as described above: The IS/OS Scorecard.
It comes with a property window that allows to define InSample and Out-of-Sample intervals.
Instead of calculating the usual performance metric (like APR) on the complete backtest interval it calculates separate metrics (like APR_IS and APR_OS) for the two data sets.
This means you see all interesting results in one go. No need to adjust data ranges and rerun the backtest anymore.
Remark
Probably you noticed: Up to now we did not mention any "Optimizer", and right so:
In fact any change in a strategies code or parameter (or BuildingBlock) with the aim to improve things can be considered an "optimization" which will lead to an overoptimized strategy if done the naïve way (i.e. without separation of IS/OS intervals and proper checking)
Remark 2
In your question and in superticker's answer one might get the impression that "too many indicators" may lead to overoptimization.
And it is true: the risk for overoptimization grows if there are more indicators.
On the other hand even a single indicator -if adjusted endless times- can lead to ever-optimization. It is more the way how things are improved....
The mathematical background goes like this:
Your strategy has a lot of things to adjust: Parameters, logic, indicator choices, limits and so forth. All these are considered "parameters" and together they define the "degree of freedom" of the system/strategy/algorithm.
Usually the set of parameters is estimated/determined from the available data in our case the financial price series.
The obvious problem of "over-optimization" or "curve fitting" occurs if these parameters match the data they are estimated from but not some other/new data.
It is not so much the amount of parameters (for example the number of indicators used) but the way they fit the data. You could have a large number of indicators that work on unseen data. The trick is to find those...
I always use in- and out-of samples, similar to what DrtKoch described, but only for ETFs. I use 6 moving intervals, 4 years "in" and 1 year "out", over a maximum period of 10 years.
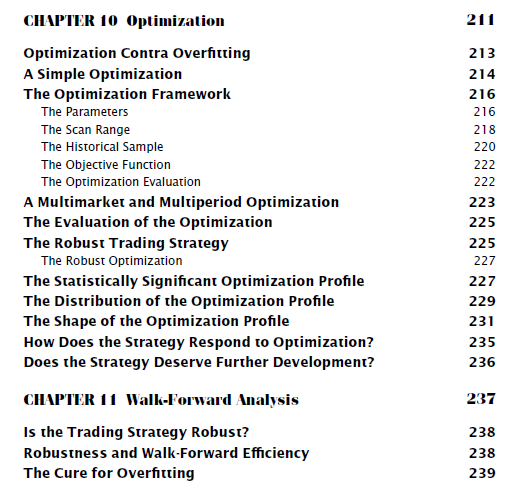
However, I recommend to read "The Evaluation and Optimization of Trading Strategies", simply to get a deeper understanding about optimization and overfitting (from chapter 10 onwards).
https://www.amazon.com/Evaluation-Optimization-Trading-Strategies/dp/0470128011
However, I recommend to read "The Evaluation and Optimization of Trading Strategies", simply to get a deeper understanding about optimization and overfitting (from chapter 10 onwards).
https://www.amazon.com/Evaluation-Optimization-Trading-Strategies/dp/0470128011
Well, Robert Pardo's book talks a lot about the basics (as me, above) and then mainly about detecting over-optimization. He explains how an over-optimized strategy looks like and his famous "Walk-Forward Analysis" (did he invent it?) is also method to detect over-optimized strategies.
This is very valuable per se, but the main question remains: How build a not-over-optimized strategy?
We'll get there...
This is very valuable per se, but the main question remains: How build a not-over-optimized strategy?
We'll get there...
One rule of thumb I use is: will my pc be busy for several hours to do the optimization? Than it's over-optimization.
And mostly that is when you have for example an RSI, some entry, some exit and another indicator and will run every parameter with 1 step. You'll have thousands of possibilities. For me, that's too much.
The results should not change a lot when the RSI is 25 or 26.
It is also not a good idea -IMHO- to optimize 1 strategy on 1 instrument like the SPY.
Or you optimize the same strategy on another instrument and put them all in a metastrategy.
Albeit, do not put your money in 1 optimized strategy on 1 instrument.
And if it's working only great on that 1 instrument, don't use it at all.
QUOTE:
do not ... 1 optimized strategy on 1 instrument.
very true.
The theory behind this
In the text above I said:
QUOTE:
Usually the set of parameters is estimated/determined from the available data in our case the financial price series.
Let me explain things with a simple albeit extreme example:
It takes two points to define a straight line if these two points are exact.
If you have noisy points (as we always have in trading) then you need much more points to define a straight line. And such a straight line has just two parameters.
If you want to find good values for a complete strategy (with many parameters) you'll need a lot of data.
For reference: I usually work with 10 years of Nasdaq-100 EOD data, this is 10 years times 250 days times 100 symbols or 250'000 data points. And often I feel it is not enough...
If you try to estimate/extract/calculate the parameters of a trading strategy from less data you could just as well throw the dice, the results will be highly unreliable.
For me, a strategy is a process that combines several steps. I use a three-phase approach:
Phase 1: determine the trend of the movement that I am going to approach (impulsive: bullish/bearish; corrective: countercyclical; hit and run: range) Example of bullish strategy: RSI greater than 50%
Phase 2: the conditions of the entry and exit points which will often be on a lower time unit. Example: Stoch turns upward
Phase 3: tactics, which will bring together entry and exit points, the optimal size of a position,... It also takes into account something that I don't think we talk about enough: management money (the key to survival and essential for the intradays which is considered like a spiel).
For me, each phase should be optimized independently and in order. Trust the previous phase and optimize the rest. Because if I question phase 1 and optimize it, then I will have to question phases 2 and 3 because they are optimized on this first phase (this is what I consider to be overoptimization).
This is why I don't see the point of genetics evolver if there is no basis (except if we have a quantum computer and even).
One thing I can't seem to keep up with is optimization on the distant past. The market of today and yesterday has changed (volatility, velocity, etc.). The market of tomorrow is more like the market of today than that of the distant past, right? I mean the further the data goes, the less “representative” it becomes. Certainly the movements remain the same, but the models of the past take more time to achieve, for example.
You said to create a strategy on data from the distant past (Insample) and backtest on the more recent past, but why?
To optimize phases 2 and 3, I find it more effective to take 1 year on 1000 symbols than 10 years on 100 symbols for example, but I am probably wrong.
High speed trading has had an impact on market dynamics. I don’t think something like a flash crash occurred before high speed trading and algo trading.
Superticker
I am intrigued by your definitions of static vs adaptive indicators. But since this is the first I have heard of this idea, I am not sure I understand. Aren’t all indicators adaptive, as they compare different timeframes, like the MACD as you mentioned? Can you give more examples of static vs. adaptive indicators? Perhaps you can show me how a static indicator can be converted into an adaptive indicator. Also, how does the use of an adaptive indicator avoid the problems of overoptimization/curve fitting? Aren’t all indicators simply taking past data and producing a value from a formula?
DrKoch:
Thank you so much for your thorough discussion of the theory of overoptimization. I think you described it very well. I really appreciate your examples and analogies to help me understand this major barrier to developing profitable strategies. My wife even asked me to explain the problem to her and I used some of your examples (like the noisy points to make a straight line).
Springroll:
It appears Pardo’s work is essential reading on this topic. I hope I can find a source that is less than $50 for a used copy (probably worth it though).
Dirk3000:
Yes, I am afraid my overoptimization overnight days are over. It was nice to wake up to a higher profit number, but that appears to be an illusion. However, I am still struggling to design strategies with less than 10000 iterations.
Ramsa976:
Thank you for your process. I share your confusion regarding what is potentially the absolute best methodology, but it appears you at least have something that works for you. I am hoping we can discover a logically and even mathematically coherent theory that will allow us to develop a process of designing robust strategies confidently and efficiently.
With all these ideas swimming in my head, it is not surprising that I am still a bit confused. I am looking for a clear delineation of good practice versus bad practice, but maybe the answer lies somewhere in the middle. I know there are some online gurus who offer courses on how to do this, but they cost several thousand dollars, and I don’t trust randoms on the internet with a profit motive.
As I mentioned above, I am still struggling to design strategies with less than 10000 permutations. Once you add a condition for entries, a filter, and a condition for exits and stop losses you are up to five or six variables and if each only has 5 values you still have 3125-15625 permutations. Looking at 10 years of data and 30 tickers means days of calculations for an exhaustive test. I know there are ways of reducing the sample size, but I feel unsatisfied even with this list of variables and values (As in, I want more filters and more refined entries and exits).
Another thing I am very unsure about is where I am allowed to optimize and where I am not. It appears that if you optimize once to test feasibility, that is OK, but you cannot optimize again after you have tweaked a strategy. I guess I am looking for a clear description of this rule, because I think it is very easy and very tempting to optimize an extra time or in some way that accidentally introduces curve fitting.
Forgive me for sharing my stream of consciousness here. I hope this thread is helpful for everyone, I know it certainly has been for me.
QUOTE:
static vs adaptive indicators. Aren’t all indicators adaptive ...?
No, some mathematically normalize out random variations better than others.
QUOTE:
Perhaps you can show me how astatic[prototype] indicator can be converted into an adaptive indicator.
Just compare the mathematically approach a prototype (older) indicator employs, such as StochK, to its modern counterpart, SMI (Stochastic Momentum Index). Notice how SMI is less noisy than StochK because of its calculation method. Just compare their calculation methods.
But that's not a good example of normalizing out variation. For that let's look at the code below:
CODE:Notice how DX is smoothed out the with DSMA (which is an adaptive moving average based upon Price StdDev), then divided by a slower SMA to stabilize (normalize) it over a longer period of time. That's one "form" of normalization. In general, the real goal of normalization is to divide out (or factor out via decorrelation) the random and irrelevant variation.
TimeSeries dx = DX.Series(bars, paramDxPeriod); TimeSeries dxSmoothed = new DSMA(dx,19) / new SMA(dx,50); //normalize baseline with SMA dxSmoothed.Description = "Normalized smoothed DX";
Although not normalization, adding more independent variables to an indicator can also sharpen it. Many more advanced indicators model both Price and Volume together to get cleaner, clearer, and more correlated results. Other important independent variables to include would be something from IndexLab or even P/E Ratio.
QUOTE:
Also, how does the use of an adaptive indicator avoid the problems of over optimization/curve fitting?
If you have more adaptive indicators, then your strategy can run will less static parameters. And if you can eliminate all static parameters, you can't have over optimization since there won't be any static parameters left to optimize. The less static parameters the better.
Reviving this thread for a question.
Can a Monte Carlo simulation provide a level of validation that a strategy is (or is not) over-optimized? I.e. if the results of a simulation come back in a narrow range, does that validate the predictive capability of the model?
Or are they statistically unrelated?
Can a Monte Carlo simulation provide a level of validation that a strategy is (or is not) over-optimized? I.e. if the results of a simulation come back in a narrow range, does that validate the predictive capability of the model?
Or are they statistically unrelated?
No. If the MC Simulation base run and raw trades come from a backtest with over-optimized parameters, then that would be reflected in the MC results too.
Your Response
Post
Edit Post
Login is required