Hello.
I would like a feature to provide the acclaimed Evolver with a customizable option to simulate each generation out-of-sample so we can compare in-sample and OOS in order to filter overoptimized strategies.
Can the overoptimization indicators from finantic.Socrecard be used as filters for the Evolver generations? Can the OOS indicators, such as OOS Sharpe Ratio, be used as a fitness function? Example: evolving for the highest OOS Sharpe Ratio.
Here is an example of overoptimized generation:
This image shows the equity curve for a strategy evolved for the last 10 years. Looks great! Does it?
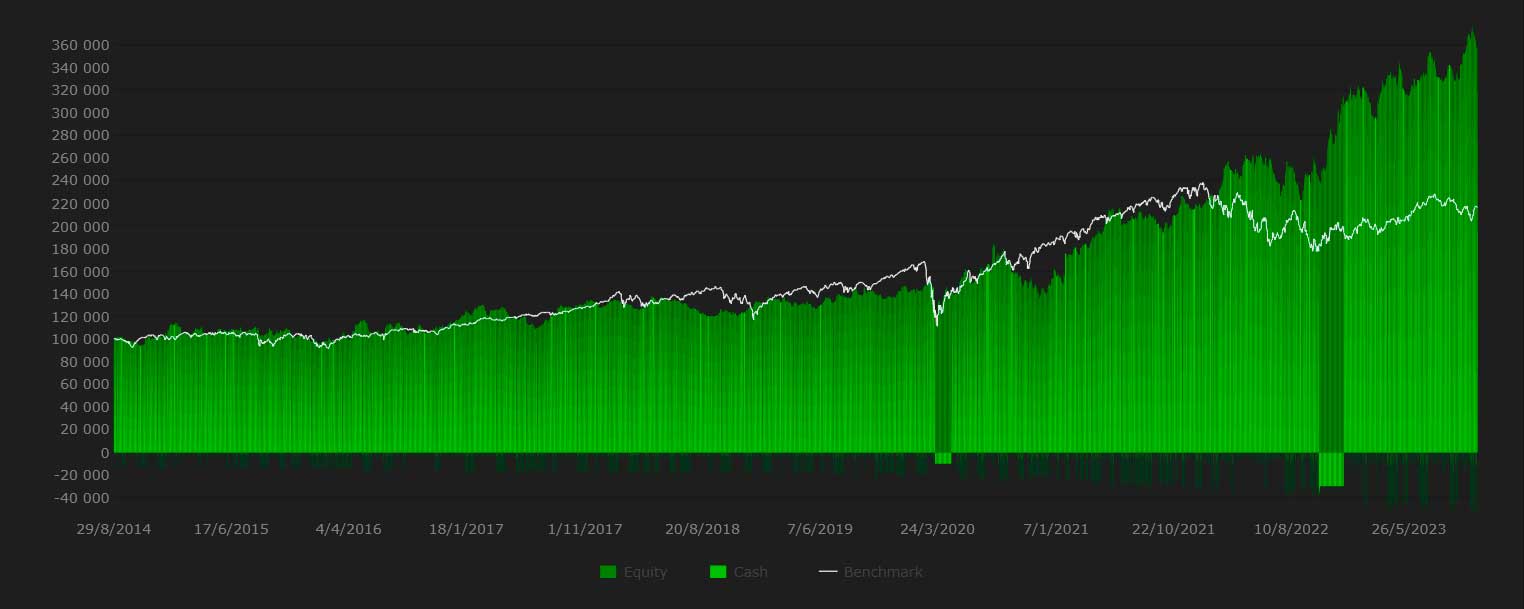
Next is the same strategy back tested OOS (for the period from 2003 to 2013).
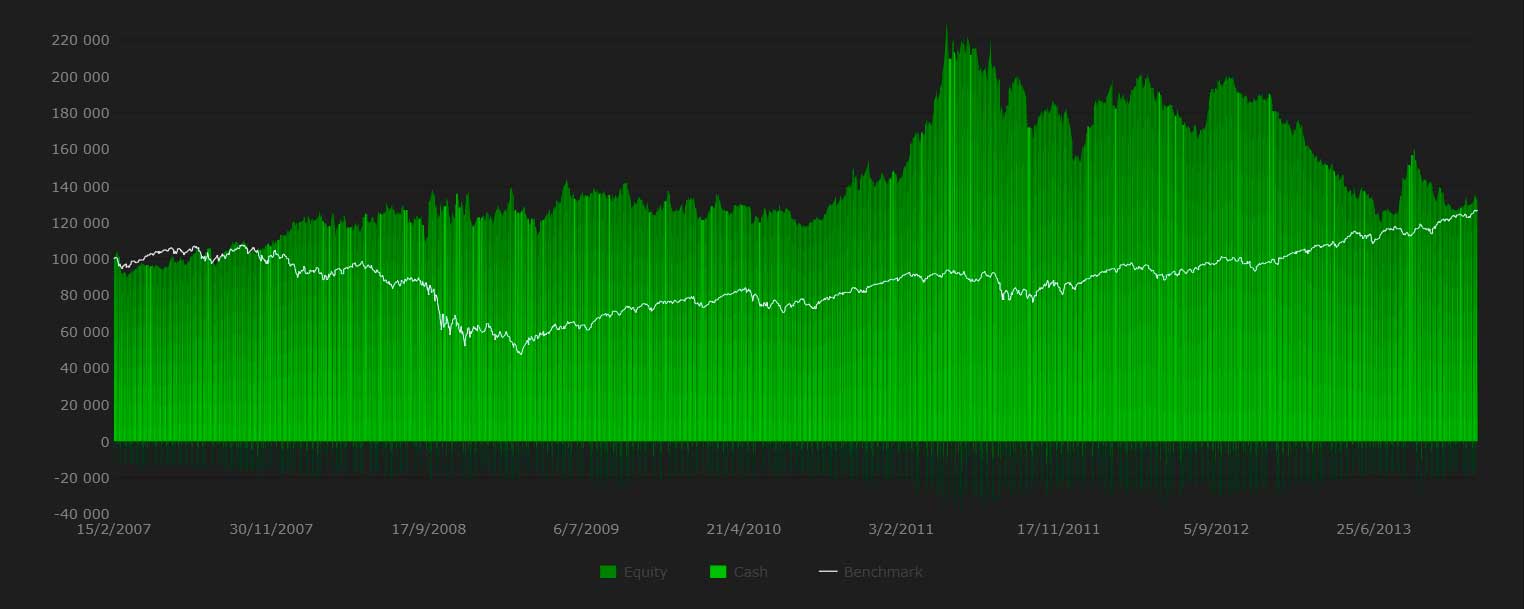
Best.
I would like a feature to provide the acclaimed Evolver with a customizable option to simulate each generation out-of-sample so we can compare in-sample and OOS in order to filter overoptimized strategies.
Can the overoptimization indicators from finantic.Socrecard be used as filters for the Evolver generations? Can the OOS indicators, such as OOS Sharpe Ratio, be used as a fitness function? Example: evolving for the highest OOS Sharpe Ratio.
Here is an example of overoptimized generation:
This image shows the equity curve for a strategy evolved for the last 10 years. Looks great! Does it?
Next is the same strategy back tested OOS (for the period from 2003 to 2013).
Best.
Rename
QUOTE:
evolving for the highest OOS Sharpe Ratio.
I'd suggest to proceed the other way round.
Use a IS metric as target for the evolver, i.e. let the evolver find strategies with better and better Sharpe_IS values.
Then use a comparison between IS metric and OS metric as a filter, i.e. if Sharpe_OS is less than half of Sharpe_IS then discard the (presumably overoptimized) strategy.
BTW I always use older data for IS and newer data for OS.
Example:
IS: 2007 .. 2014
OS: 2015 .. 2022
Keep 2023 for "validation"
Your Response
Post
Edit Post
Login is required