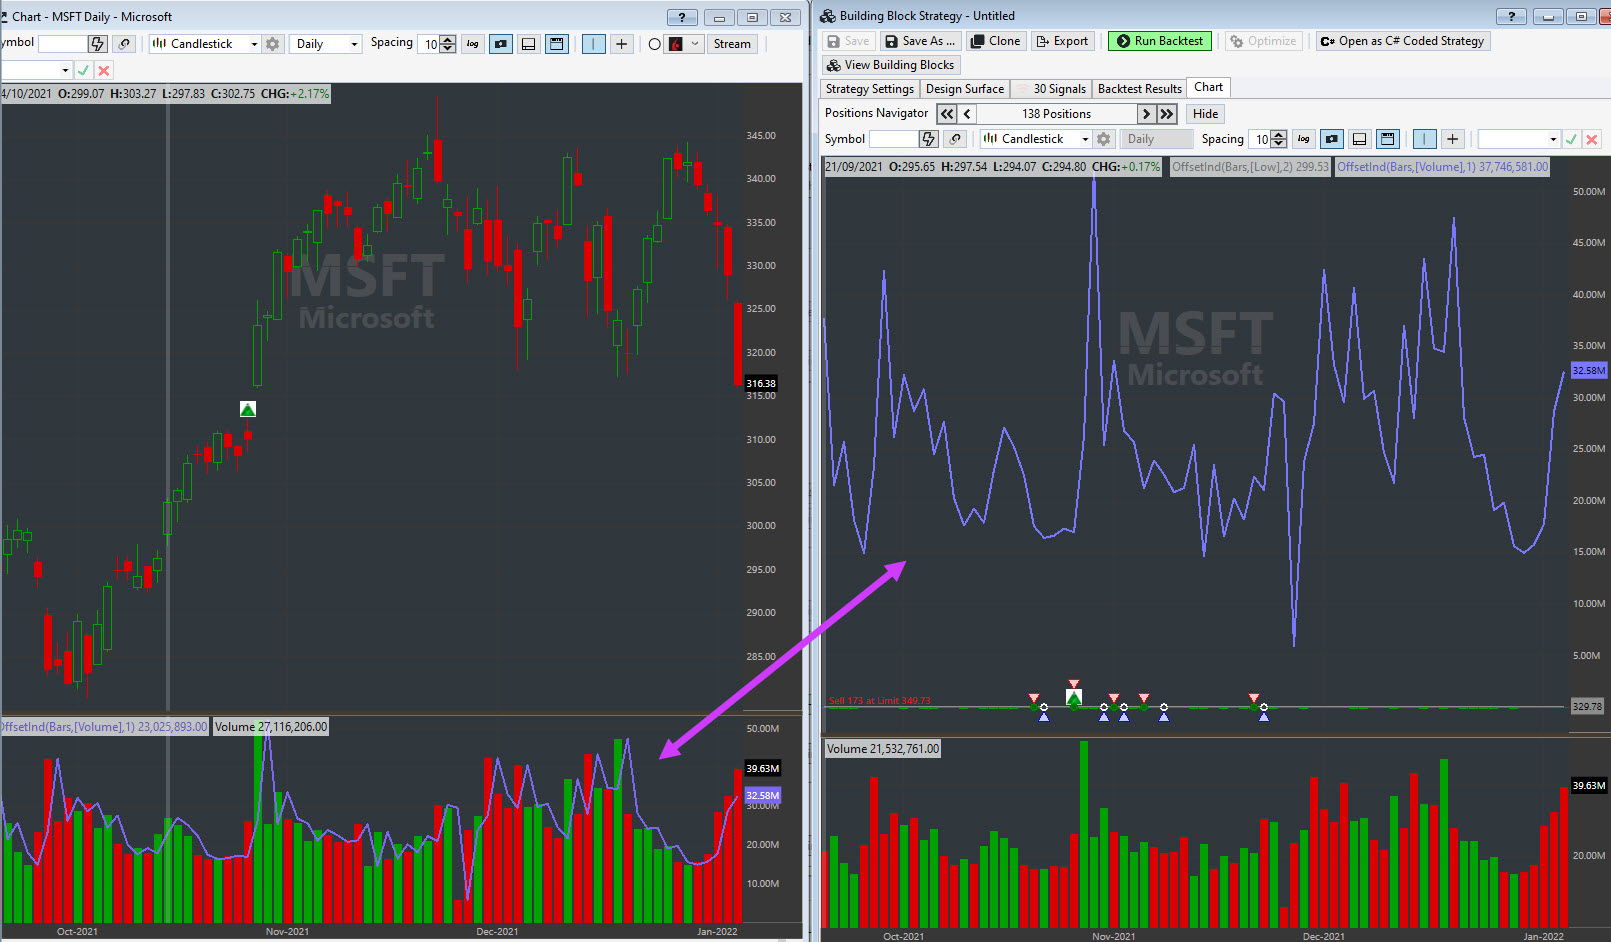
I noticed an issue today where the offset indicator of a VOLUME source was plotted to the Price Pane of a backtest chart.
When adding the offset indicator to a general chart form the user can select the pane for the plot to occur. This option is not available when selecting an offset indicator on/in a building block.
Typically, I think one would expect the offset to be plotted to the same pane as the source data (ie: offset of RSI to RSI Pane, Offset of Volume to Volume Pane, etc). or to its own/new pane.
I stumbled onto this when using the offset to compare volume from previous days is specfic scenarios. The resulting plot makes it very difficult to inspect trades/positions on the backtest chart.
image below shows general chart form, compared with backtest chart.
PS: Top job on the new features over the holiday period. Loving the Filters added to the backtest results. A very helpful tool indeed.
Rename
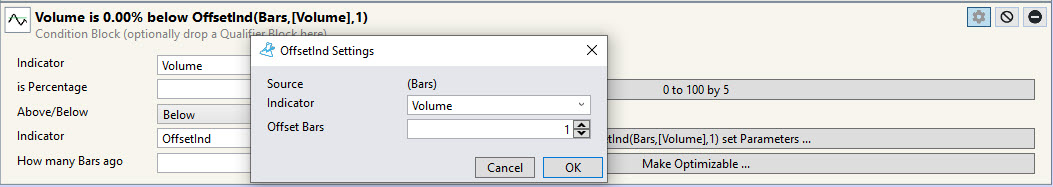
You can simply choose the Volume pane manually from the dropdown list, and the OffsetInd will be plotted there correctly. Same applies to other transformer indicators like the SymbolInd.
Making some improvements to it in B44 so by default it would plot in its own pane.
Thanks Eugene.
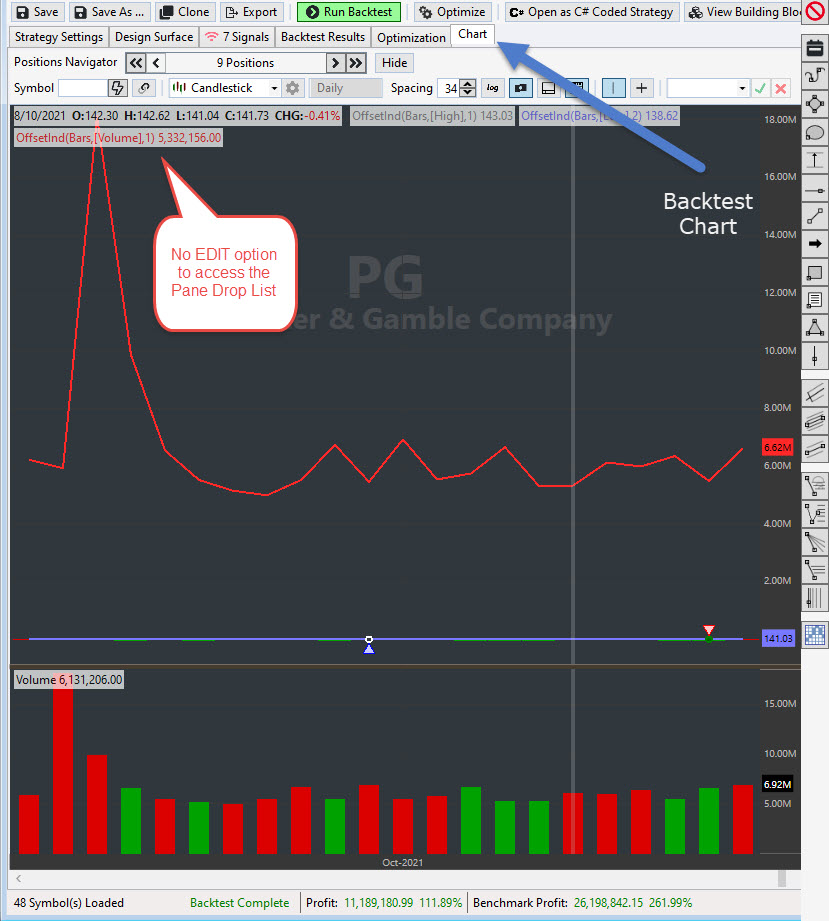
Perhaps I didn't explain very well. I'm refering to the Bactest chart. A normal chart works fine and i can select the pane either before plot or after via the edit feature.
But, the BackTest/Strategy Chart does not have those features.
There is no drop down list on the building Block to assign the pane.
And there is no edit feature on the Backtest/Strategy Chart.
With the change I committed for B44, OffsetInd(Volume) will be plotted in a separate pane without occluding the price pane.
Awesome. Thanks Eugene
Your Response
Post
Edit Post
Login is required