Is there a John Carter squeeze pro equivalent indicator in WL8?
Rename
Perhaps this is what you're looking for...
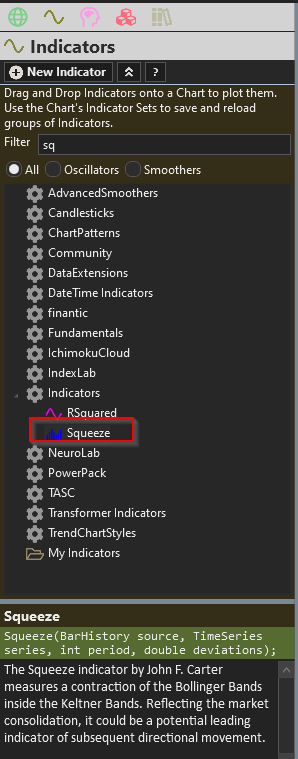
One other thing... I don't know if the Squeeze indicator in WL 8 is the Pro version or not. In any case, you'll probably want to take a look at the posts that Eugene referenced.
QUOTE:
I don't know if the Squeeze indicator in WL 8 is the Pro version or not.
I didn't know there was a "Pro" version of John Carter's double squeeze strategy. My guess is that WL is using an earlier version. Do you have a reference for the Pro version? Maybe I can update it.
The link below includes a "simple" example of using WL's squeeze indicator for "starting material". It's nothing fancy. I'm sure you could add trailing stops, market sentiment, and other goodies to make it better. https://www.wealth-lab.com/Discussion/Bollinger-Band-fans-Squeeze-strategy-10298
@superticker - I didn't know either. I searched for info about the Pro version, and there are some results where you can buy it for various platforms. I didn't find any source code, but I didn't try too hard, either.
In ThinkOrSwim it appears to be study TTM_Squeeze, but the code is licensed, so you can't view the code in ThinkOrSwim.
In ThinkOrSwim it appears to be study TTM_Squeeze, but the code is licensed, so you can't view the code in ThinkOrSwim.
QUOTE:
In ThinkOrSwim it appears to be study TTM_Squeeze,
The TTM_Squeeze code given in Reply# 5 of https://www.wealth-lab.com/Discussion/Add-Squeeze-Vortex-indicator-9859 does not employ Keltner bands, so it's not the John Carter version.
That begs the question, "How many squeeze methods are there?" What someone should do is publish a hybrid squeeze method that's a composite of all of them.
It appears to me that a "squeeze" is not simply a "consolidation" where some traders types are pulling out of the position and others are filling in, which suggests a swing in the stock price (and change in ownership makeup). I'm just wondering what's going on with the stock to drop volatility to the point that it promotes a dramatic shift in the stock price following the squeeze event?
Here's the code for the one I use on TOS. I like it because it has the squeeze indicators (red dots) as well as the histogram. I can't vouch for its accuracy but it seems to do a good job.
##Assembled by TheBewb using existing Mobius Squeeze Momentum coding and "squeeze" concept made popular by John Carter.
input price = close;
input length = 20;
input Num_Dev_Dn = -2.0;
input Num_Dev_up = 2.0;
input averageType = AverageType.SIMPLE;
input displace = 0;
def sDev = StDev(data = price[-displace], length = length);
def MidLineBB = MovingAverage(averageType, data = price[-displace], length = length);
def LowerBandBB = MidLineBB + Num_Dev_Dn * sDev;
def UpperBandBB = MidLineBB + Num_Dev_up * sDev;
input factorhigh = 1.0;
input factormid = 1.5;
input factorlow = 2.0;
input trueRangeAverageType = AverageType.SIMPLE;
def shifthigh = factorhigh * MovingAverage(trueRangeAverageType, TrueRange(high, close, low), length);
def shiftMid = factormid * MovingAverage(trueRangeAverageType, TrueRange(high, close, low), length);
def shiftlow = factorlow * MovingAverage(trueRangeAverageType, TrueRange(high, close, low), length);
def average = MovingAverage(averageType, price, length);
def Avg = average[-displace];
def UpperBandKCLow = average[-displace] + shiftlow[-displace];
def LowerBandKCLow = average[-displace] - shiftlow[-displace];
def UpperBandKCMid = average[-displace] + shiftMid[-displace];
def LowerBandKCMid = average[-displace] - shiftMid[-displace];
def UpperBandKCHigh = average[-displace] + shifthigh[-displace];
def LowerBandKCHigh = average[-displace] - shifthigh[-displace];
def K = (Highest(high, length) + Lowest(low, length)) /
2 + ExpAverage(close, length);
def momo = Inertia(price - K / 2, length);
def pos = momo >= 0;
def neg = momo < 0;
def up = momo >= momo[1];
def dn = momo < momo[1];
def presqueeze = LowerBandBB > LowerBandKCLow and UpperBandBB < UpperBandKCLow;
def originalSqueeze = LowerBandBB > LowerBandKCMid and UpperBandBB < UpperBandKCMid;
def ExtrSqueeze = LowerBandBB > LowerBandKCHigh and UpperBandBB < UpperBandKCHigh;
def PosUp = pos and up;
def PosDn = pos and dn;
def NegDn = neg and dn;
def NegUp = neg and up;
plot squeezeline = 0;
squeezeline.SetPaintingStrategy(PaintingStrategy.POINTS);
squeezeline.AssignValueColor(if ExtrSqueeze then Color.RED else if originalSqueeze then Color.YELLOW else if presqueeze then Color.DARK_ORANGE else Color.GRAY);
plot momentum = momo;
momentum.SetPaintingStrategy(PaintingStrategy.HISTOGRAM);
momentum.AssignValueColor( if PosUp then Color.GREEN else if PosDn then Color.DARK_GREEN else if NegDn then Color.DARK_ORANGE else if NegUp then Color.YELLOW else Color.YELLOW);
In Reply# 7:
Did you notice there are not Keltner bands in that code. This is TTM_Squeeze code, not the double-banded Bollinger and Keltner band code that John Carter originally proposed.
The next question is which method is better? Can we combine both squeeze methods into an improved hybrid indicator?
UPDATE: The TTM_Squeeze is computing the ATR is a weird way ...
I do like they way they compute the pseudo Keltner bands better because the traditional Keltner bands are based on the ATR indicator, which responds very slowly. But I can't say which squeeze approach would perform better in the real market.
QUOTE:
Here's the code for the one I use on TOS.
Did you notice there are not Keltner bands in that code. This is TTM_Squeeze code, not the double-banded Bollinger and Keltner band code that John Carter originally proposed.
The next question is which method is better? Can we combine both squeeze methods into an improved hybrid indicator?
UPDATE: The TTM_Squeeze is computing the ATR is a weird way ...
CODE:so we have pseudo Keltner bands. That said, the TTM_Squeeze is trying to emulate the original John Carter approach. My gripe is why aren't the pseudo Keltner bands plotted as expected? Moreover, why don't they compute a single "merit metric" instead of creating all these independent Boolean variables? A fragmented poor design.
TimeSeries atrShift = atrFactor * SMA.Series(TR.Series(bars), length);
I do like they way they compute the pseudo Keltner bands better because the traditional Keltner bands are based on the ATR indicator, which responds very slowly. But I can't say which squeeze approach would perform better in the real market.
Thanks, everyone.
Superticker - I can't vouch for the quality of the code, but I've found the indicator, when combined with others, to be a pretty good signal when trading manually. Specifically, the squeezeline.AssignValueColor points are particularly helpful.
I downloaded the code you posted on the other board and that seems to work quite well when optimized. Using an hourly signal and a small number of stocks I've curated I'm getting a 20% APR.
QUOTE:
the code you posted on the other board ... seems to work quite well when optimized. ... I'm getting a 20% APR.
I think it's being over fitted when optimized. Doesn't 20% APR sound too good to be true? I think the problem is there are only 3 or so trades to determine the optimizing parameters, so the optimizer sets those parameters to fit those few trades.
To fit this right, one really needs 5 trades for each parameter. That strategy has 2 parameters, so one needs 10 trades. That's going to be hard to get (per stock) since a squeeze doesn't occur too often.
But there's definitely something here with a John Carter double-banded squeeze strategy. We can tell that.
Your Response
Post
Edit Post
Login is required