Hi,
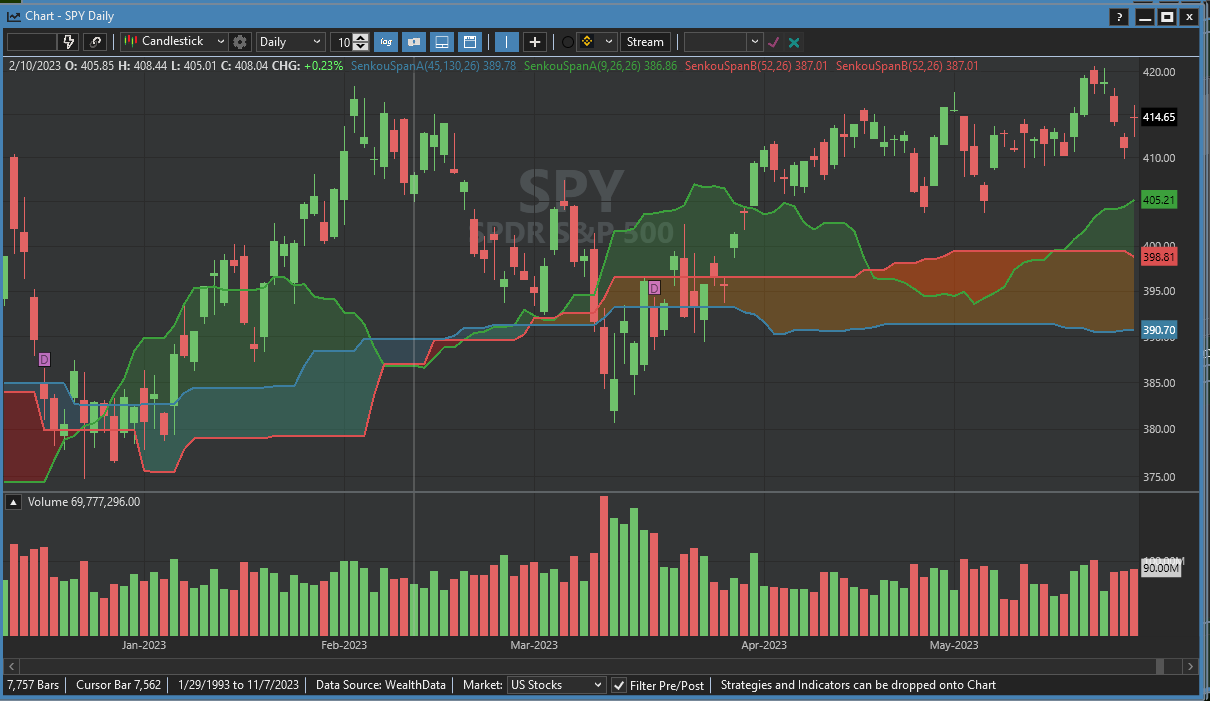
I tried to set up an Ichimoku Chart on daily basis and a weekly oriented cloud on the same chart. I added a SenkouSpanA and a SenkouSpanB with different parameters. The resulting cloud looks strange and isn't correct.
Regards
Dieter
I tried to set up an Ichimoku Chart on daily basis and a weekly oriented cloud on the same chart. I added a SenkouSpanA and a SenkouSpanB with different parameters. The resulting cloud looks strange and isn't correct.
Regards
Dieter
Rename
Without any evidence (code, chart), we'll just assume you made a mistake.
Hi Dieter,
You didn't provide enough information to go on here. We can only try to image what you did and what the outcome is. I imagined you tried parameters of 45 and 130 which is 9*5 and 26*5 since there are 5 trading days in a week. I did likewise and everything looks OK to me.
You didn't provide enough information to go on here. We can only try to image what you did and what the outcome is. I imagined you tried parameters of 45 and 130 which is 9*5 and 26*5 since there are 5 trading days in a week. I did likewise and everything looks OK to me.
Dieter, could you please clarify your definitions of "strange" and "correct"?
Sorry, corrected:
CODE:
using WealthLab.IchimokuCloud;
using WealthLab.Backtest;
using System;
using WealthLab.Core;
using WealthLab.Data;
using WealthLab.Indicators;
using System.Collections.Generic;

namespace WealthScript1
{
    public class MyStrategy : UserStrategyBase
    {
        //create indicators and other objects here, this is executed prior to the main trading loop
        public override void Initialize(BarHistory bars)
        {
         ind5 = new SenkouSpanB(bars,52,26);
         PlotIndicator(ind5, WLColor.FromArgb(255,139,0,0), PlotStyle.Cloud);
         ind4 = new SenkouSpanA(bars,9,26,26);
         PlotIndicator(ind4, WLColor.FromArgb(255,0,100,0), PlotStyle.Cloud);
         ind3 = new KijunSen(bars,26);
         PlotIndicator(ind3, WLColor.FromArgb(255,255,0,0), PlotStyle.Line);
         ind2 = new TenkanSen(bars,9);
         PlotIndicator(ind2, WLColor.FromArgb(255,0,0,255), PlotStyle.Line);
         ind1 = new ChikouSpan(bars,26);
         PlotIndicator(ind1, WLColor.FromArgb(255,72,61,139), PlotStyle.Line);

         ind6 = new SenkouSpanB(bars, 52 * 5, 26 * 5);
         PlotIndicator(ind6, WLColor.LightCoral, PlotStyle.Cloud);
         ind7 = new SenkouSpanA(bars, 9 * 5, 16 * 5, 26 * 5);
         PlotIndicator(ind7, WLColor.LightGreen, PlotStyle.Cloud);


      }

        //execute the strategy rules here, this is executed once for each bar in the backtest history
        public override void Execute(BarHistory bars, int idx)
        {
            if (!HasOpenPosition(bars, PositionType.Long))
            {
                //code your buy conditions here
            }
            else
            {
                //code your sell conditions here
            }
        }

        //declare private variables below

      private IndicatorBase ind1;
      private IndicatorBase ind2;
      private IndicatorBase ind3;
      private IndicatorBase ind4;
      private IndicatorBase ind5;
      private IndicatorBase ind6;
      private IndicatorBase ind7;

   }
}
Eugene:
strange : not known, seen etc before; unfamiliar or foreign
correct: free from faults or errors
strange : not known, seen etc before; unfamiliar or foreign
correct: free from faults or errors
Let's simplify it by not plotting the additional components, you can add them back in.
Use PlotIndicatorCloud to plot clouds. Then, use a PlotIndicator for the secondary component to get its indicator label appearing in the chart.
Note, in a Strategy, the Ichimoku indicators won't produce an expanded area to the right of the chart, it's not possible in Strategy/backtest mode.
Use PlotIndicatorCloud to plot clouds. Then, use a PlotIndicator for the secondary component to get its indicator label appearing in the chart.
CODE:
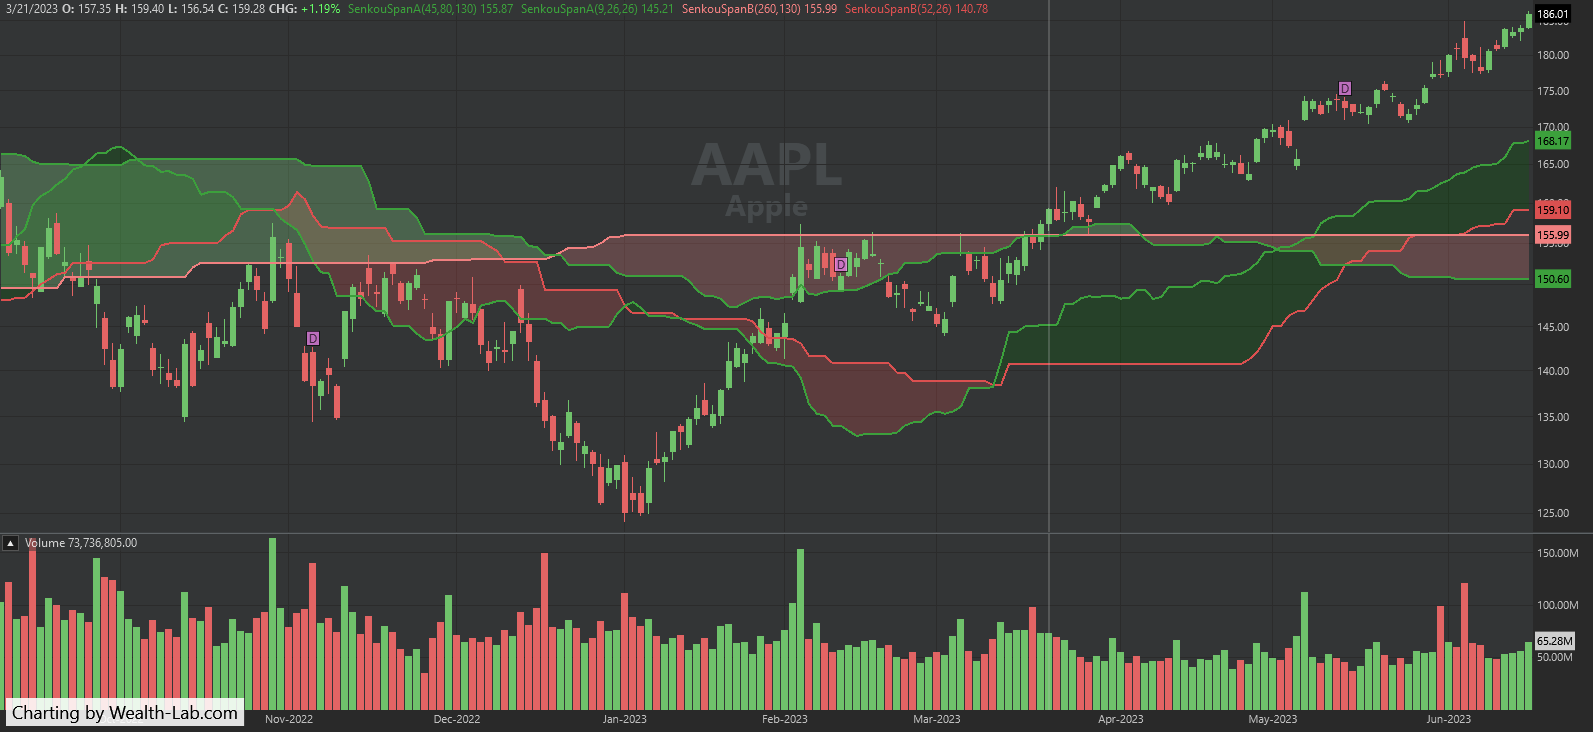
//create indicators and other objects here, this is executed prior to the main trading loop public override void Initialize(BarHistory bars) { ind5 = new SenkouSpanB(bars, 52, 26); ind4 = new SenkouSpanA(bars, 9, 26, 26); PlotIndicatorCloud(ind5, ind4, WLColor.FromArgb(255, 139, 0, 0), WLColor.FromArgb(255, 0, 100, 0)); PlotIndicator(ind4); //so indicator label will appear ind6 = new SenkouSpanB(bars, 52 * 5, 26 * 5); ind7 = new SenkouSpanA(bars, 9 * 5, 16 * 5, 26 * 5); PlotIndicatorCloud(ind6, ind7, WLColor.LightCoral, WLColor.LightGreen); PlotIndicator(ind7); //so indicator label will appear }
Note, in a Strategy, the Ichimoku indicators won't produce an expanded area to the right of the chart, it's not possible in Strategy/backtest mode.
Works!
Thank You, Glich!
Thank You, Glich!
Your Response
Post
Edit Post
Login is required