Here is what I would like to do. I have a current trading strategy. Buy when close above 200 day sma. Sell when close below 200 sma. I want to use 10% equity.
So looking to take the trade when fast SMA 5 over the slow sma 25. When this does not occur, I want to ignore the trade.
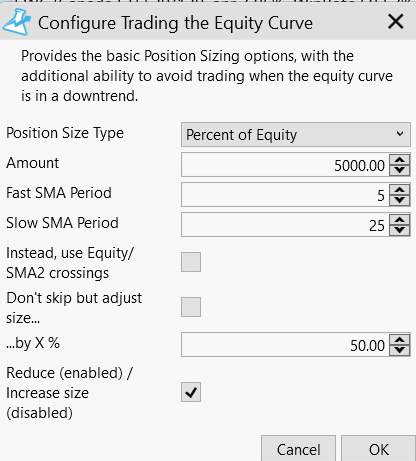
What are the settings needed in this screen.
Since I am choosing Position size type "Percent of Equity" not sure how to fill this out.
Thank you,
Larry
So looking to take the trade when fast SMA 5 over the slow sma 25. When this does not occur, I want to ignore the trade.
What are the settings needed in this screen.
Since I am choosing Position size type "Percent of Equity" not sure how to fill this out.
Thank you,
Larry
Rename
As the pos.sizing type is set to "Percent of Equity", use 10 for Amount - not 5000. That's your regular position size based on % Equity. The rest of the dialog seems to conform to your request.
Eugene,
I want to confirm my understanding.
If I click on:
"Instead, use Equity/SMA2 crossings"
Does that mean it will ignore the fast SMA period and just look to place the trade when equity is "crossed over" the slow SMA period.
Is there a way, I can see graphically, when this occurs? Meaning I want to see a line when the equity is above it's 10 day sma of equity, as an indicator on the chart or elsewhere on the equity curve tab?
Thank you,
Larry
Thank you,
Larry
Larry,
1. Yes. You might want to check out the built-in Help where it's explained: "Trading the Equity Curve" under Extensions > PowerPack. Simply type in "curve" as a shortcut.
2. Re: graphically, there's a checkbox to overlay a hardcoded 50-bar SMA of the equity on the Equity tab (the period is not subject to configure). For the sake of completeness and only if you want to take a deeper look on your own, here's some code to accomplish this in the C# strategy code: More averaging indicator choices to operate on backtest results Equity curve, Post #9.
Your Response
Post
Edit Post
Login is required