Hi,
In Sample Strategies have Pairs Trading ( QQQ / SPY )
I want to observe the ( Entry / Eixt )signals of two symbols on the chart.
convenient to confirm the entry and exit conditions are followed.
How to do ?
Thx.
In Sample Strategies have Pairs Trading ( QQQ / SPY )
I want to observe the ( Entry / Eixt )signals of two symbols on the chart.
convenient to confirm the entry and exit conditions are followed.
How to do ?
Thx.
Rename
Hi,
I think you can create a second pane and draw trade arrows there manually like this example shows:
https://www.wealth-lab.com/Discussion/Images-Icons-to-use-with-DrawImage-5712
I think you can create a second pane and draw trade arrows there manually like this example shows:
https://www.wealth-lab.com/Discussion/Images-Icons-to-use-with-DrawImage-5712
Hi, Eugene
Thanks ur reply.
I using DrawBarAnnotation plot shapes on chart
but i want red triangle plot on the last pane (PlotBarHistory)
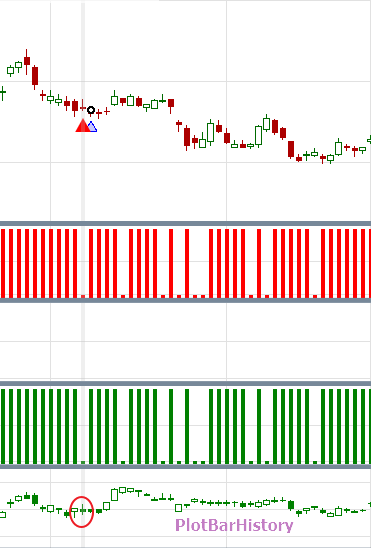
Thx.
Thanks ur reply.
QUOTE:
I think you can create a second pane and draw trade arrows there manually like this example shows:
https://www.wealth-lab.com/Discussion/Images-Icons-to-use-with-DrawImage-5712
I using DrawBarAnnotation plot shapes on chart
but i want red triangle plot on the last pane (PlotBarHistory)
Thx.
it’s currently not possible. You could open a #FeatureRequest for it.
Ok.
Your Response
Post
Edit Post
Login is required