I only want strategies that make money from month to month, not with such a dispersion, how can I filter out such options?
Rename
Check out the metrics in the Risk/Reward group of the Extended Scorecard (Backtest Results tab).
I use a combination of metrics: first I look to the SysQ scorecard (https://wealth-lab.com/extension/detail/finantic.SysQ), high SysQ tend to show stable profitability vs risk, then I look for high Sharpe in combination with a low Expected DD, a low DD and a high SysQ, and of course a large % of profitable trades. Then I run different backtests amongst the best cases and I look for satisfactory monthly results.
An idea: I will look for something like a Standard Deviation across the equity curve, Maybe the slope.
An idea: I will look for something like a Standard Deviation across the equity curve, Maybe the slope.
Wouldn't everyone love that? One way I found to smooth out the equity curve is to trade a handful of strategies, not just one. I run my MetaStrategy at the end of every trading day and get all my signals at once.
I recommend to read Laurens Bensdrop's book "Automated Stock Trading Systems: A Systematic Approach for Traders to Make Money in Bull, Bear and Sideways Markets".
He has laid out his trading approach exactly so that he can profit in all market situations. In his book he presents 6 stock trading approaches (Trend Momentum + Mean-Reverse Short/Long) designed to keep the equity curve as linear as possible.
He has laid out his trading approach exactly so that he can profit in all market situations. In his book he presents 6 stock trading approaches (Trend Momentum + Mean-Reverse Short/Long) designed to keep the equity curve as linear as possible.
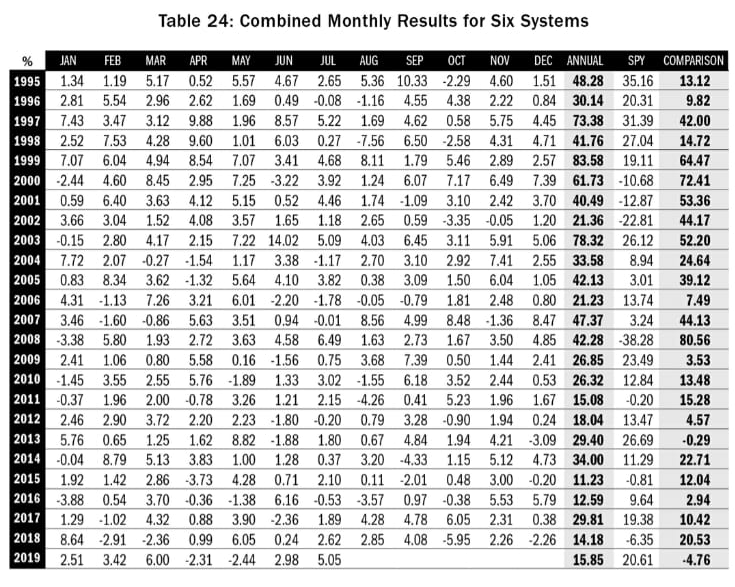
Springroll, the table looks awesome. If you did a strategy using this system, how did it behave in recent years and what is the maximum drawdown?
You can check out his entire portfolios and their metrics at https://www.turingtrader.com/portfolios/. Bensdrop seems to be a very transparent guy...
Springroll, I'm aware of this site, didn't know it was his. Such openness, of course, is admirable. From what I see there, last years such more passive management systems show worse results. Even compared to the Glitch yield curve shown above.
Glitch, what's your maximum drawdown?
Upd: As for the topic question, haven't found a way in Evolver to filter strategies with unprofitable years at least.
Glitch, what's your maximum drawdown?
Upd: As for the topic question, haven't found a way in Evolver to filter strategies with unprofitable years at least.
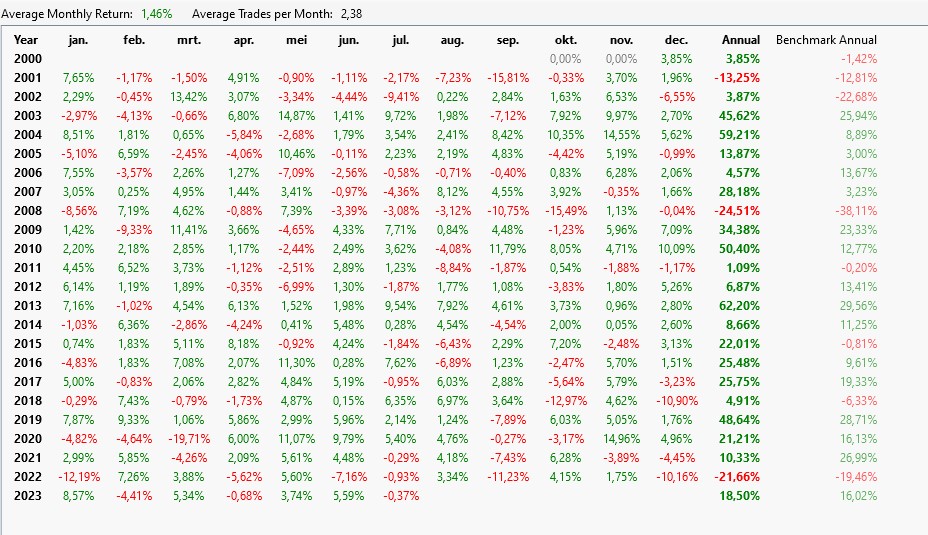
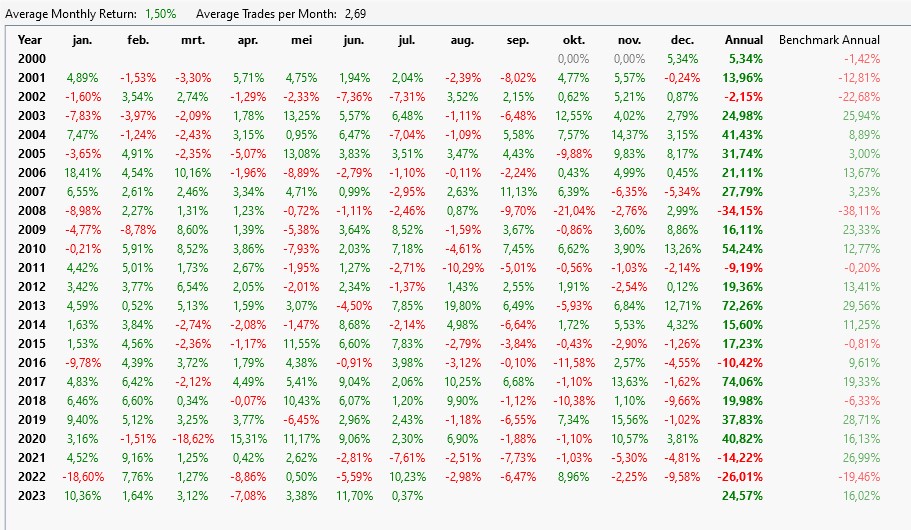
Just a single system is too error-prone and will sometimes produce unprofitable years. The key is to combine several non-correlating systems to ensure constant profits.
To demonstrate this, two simple mean-reverse systems on leveraged ETFs. The short system had its great days until September 2022. After that in October 2022, the losses were covered by the long system, which can be seen in the combined view.
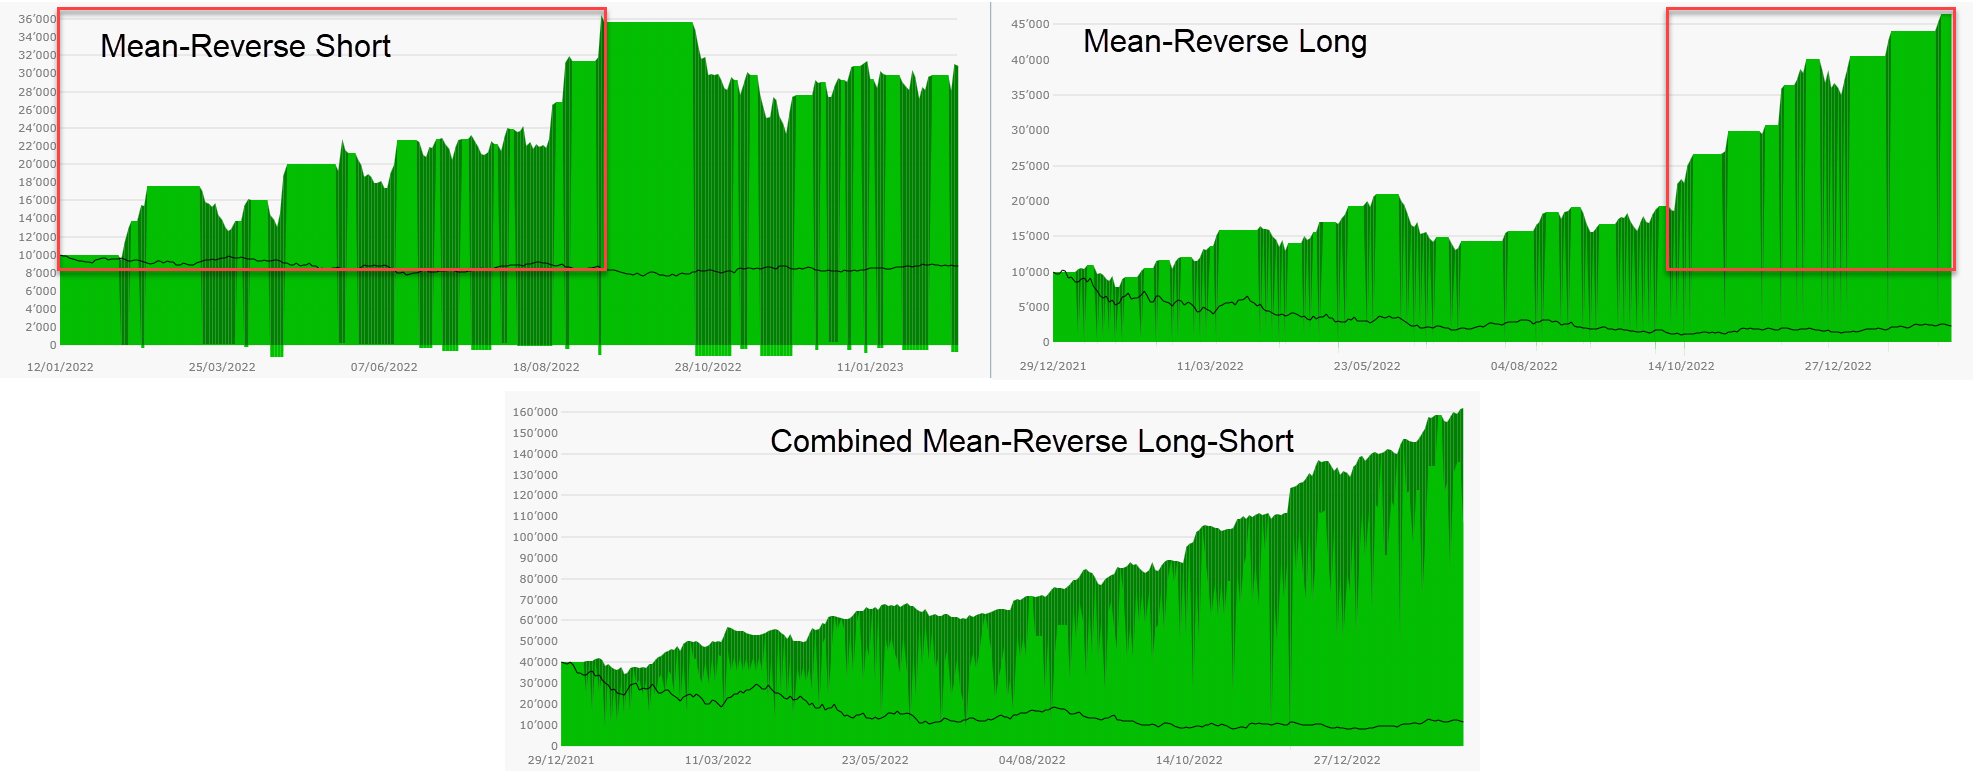
To demonstrate this, two simple mean-reverse systems on leveraged ETFs. The short system had its great days until September 2022. After that in October 2022, the losses were covered by the long system, which can be seen in the combined view.
This is the way.
Still haven't found a way to cull the strategies that earn most of the time.
Such a score is especially important if this improvement is to be implemented
https://www.wealth-lab.com/Discussion/Strategy-Evolver-Detect-Convergence-Stop-Record-and-Restart-9212
For example a very simple ratio formula: (the number of profitable months or weeks/total)*100
Such a score is especially important if this improvement is to be implemented
https://www.wealth-lab.com/Discussion/Strategy-Evolver-Detect-Convergence-Stop-Record-and-Restart-9212
For example a very simple ratio formula: (the number of profitable months or weeks/total)*100
QUOTE:
I recommend to read Laurens Bensdrop's book "Automated Stock Trading Systems: A Systematic Approach for Traders to Make Money in Bull, Bear and Sideways Markets".
All systems from this book are now available as published strategies for WL8.
(see https://www.wealth-lab.com/Strategy/PublishedStrategies)
QUOTE:
For example a very simple ratio formula
You should consider the "Formula ScoreCard" available with the finantic.Scorecard extension.
(see https://www.wealth-lab.com/extension/detail/finantic.ScoreCard)
It implements many Performance Metrics which gauge "Smoothness of Equity Curve" like Lars' K-Ratio.
When backtesting, the highest ranked APR is not always the best choice.
I prefer a strategy that shows a steady result of 10% each year above a stratety with +28% and the other year -5% (for example).
There is the "slope of the equity" in the report wich is not bad but quite abstract and not really the same.
I want to make clear in WL to keep in mind during backtesting that I prefer the parameters that create the most stable performance, not per se the highest performance. Or the parameters that gives the less red years.
Is this possible in some way?
QUOTE:
I prefer a strategy that shows a steady result of 10% each year above a stratety with +28% and the other year -5% (for example).
As a trade simulation program, I'm not sure WL is in a position to accomplish this..
However, it is the goal of Modern Portfolio Theory (MPT) is do exactly that. MPT is composed of investment (not trading) strategies to produce uniform returns in all environments. The two most popular MPT methods you probably heard of are:
1) Efficient Frontier
2) Zero beta (some funds call it "smart beta")
It is outside the scope of a trading forum to talk about such numerical methods, but if you Google any of these terms, you should get lots of hits. The developer of efficient frontier got a Nobel laureate in economics for his theoretical work in this area. Just understand, you're investing, not trading. This is not about running trading simulations, but rather doing numerical analysis on an optimization problem.
It might also interest you to know Fidelity Investments uses efficient frontier to balance many of their mutual funds. Part of the goal here is to minimize turnover of stock positions within a fund to reduce its tax impact on high income investors.
Happy investing to you.
I also posted this question yesterday. How to find a smooth equity curve.
I have read some good answers above. In short:
- use the SysQ scorecared (finantic) and look for the ratio's like Sharpe, Expected DD,..
- use multiple systems that are non-correlated.
That is when you already have a strategy and did the optimization.
If you optimize and sort on WLscore, Sortino or Sharperatio, they all rank nr 1 together with the highest APR.
Maybe not always but even than, this is most likely not the smoothest curve.
You have to check all the equity curves yourself, isn't?
That is why I wonder if WL can do this during optimization?
QUOTE:
If you optimize ... on WLscore, Sortino ,or Sharpe ratio, they all rank ... together with the highest APR..... this is most likely not the smoothest curve.
I totally agree. When optimizing on these metrics, you're pushing higher risk to get more reward. The higher risk is going to create more instability in the equity curve. (I typically think of Sortino and Sharpe ratios as "quantifying" the risk/reward ratio to come to a compromise. But this process does create more instability in the equity curve.)
In contrast, MPT (Modern Portfolio Theory) methods are trying to optimize (i.e. solve for) the best stable, buy-and-hold, combination of stocks to whether all economic environments. That's why mutual funds have low turnover (and that should be why you invest in them). And with this lower risk is lower reward. And that's why mutual funds don't do as well as a portfolio where you are turning over stocks (like with WL). You're optimizing for stability with MPT; whereas, with WL you're optimizing for profit.
You're asking how to achieve both low risk (stability) and high profit. What you need to do is come up with a new ScoreCard metric to replace the Sortino and Sharpe ratios that can better meet that compromise. Then you'll be on your way to your own Nobel laureate.
WL let's you develop your own ScoreCard metrics so you can use it for your research. https://www.wealth-lab.com/Support/ExtensionApi/ScoreCard
Working with API's will be for another (life)time :-) but it's awesome that this all is possible.
This is THE challenge for a systemtrader: higher APR than the benchmark with a lower risk, more stability.
The higher APR seems not that difficult because since 2000 the APR of the SPY is now at only 5 percent. A lower Drawdown is also not impossible.
Finding more stability (zero beta?) is the next goal.
As far as I know, MPT is from the period of building a (defensive) portfolio with 60% bonds and 40% stocks. We live in other times, other possibilities.
You can create a zero beta system with W-L (i.e. trading, not really investing) by combing several non-correlated strategies. As Glitch mentioned above.
Trend/countertrend, intraday, EOD on stocks (pairs), commodities, currencies,..
QUOTE:
You're optimizing for stability with MPT; whereas, with WL you're optimizing for profit.
This is THE challenge for a systemtrader: higher APR than the benchmark with a lower risk, more stability.
The higher APR seems not that difficult because since 2000 the APR of the SPY is now at only 5 percent. A lower Drawdown is also not impossible.
Finding more stability (zero beta?) is the next goal.
As far as I know, MPT is from the period of building a (defensive) portfolio with 60% bonds and 40% stocks. We live in other times, other possibilities.
You can create a zero beta system with W-L (i.e. trading, not really investing) by combing several non-correlated strategies. As Glitch mentioned above.
Trend/countertrend, intraday, EOD on stocks (pairs), commodities, currencies,..
Still haven't found a way to filter out such trashy strategies
QUOTE:
Still haven't found a way
Let me remind you:
The equity curve is just a pleasant and obvious way to judge the quality of a system. But a "bad" equity curve is the final result of many other system properties.
Instead of focusing on a "smooth" equity curve, I'd suggest the following:
* make sure your strategy has enough trades, say more than 100 trades each month.
* make sure average profit per trade is large enough
* make sure your strategy does not "cherry pick" some favorable situations in the past, these situations will never occur again.
* instead make sure your strategy uses principles that hold in (most of) the past
Background
Trading is close to gambling, there is a lot of random fluctuation and just a very small part of "cleverness". This means you have to play a large number of rounds before your capabilities shine.
Same for a trading strategy. The win rate will always be close to 50% (or more exact: Expected profit will always be close to zero). If there is an edge, this will show after a large number of trades only.
So don't judge a strategy after 100 trades, or for less than 100 trades per month and so on.
If you follow these suggestions you will see a smooth equity curve. It is the final result of many other design decisions, none of them said "make a smooth equity curve"
QUOTE:
* make sure your strategy does not "cherry pick" some favorable situations in the past, these situations will never occur again.
This is a "disguised" way of saying that each parameter you're optimizing against should have a minimum of 5 trades; otherwise, the optimizer is going to over fit and cherry pick the parameter settings.
If you're averaging the parameter settings over the entire dataset, this may be easy to do. But if you're doing symbol-by-symbol optimization over a strategy that has 5 parameters, then you need 5*5=25 trades for each symbol in that dataset; otherwise, you're over fitting (cherry picking) parameter settings per stock.
It's never the number of trades that matters, but the quality of each trade. If you have a visually trained eye, you can judge this pretty well from the chart itself. If you can see that more or less a pattern is being followed, then it definitely makes sense to expand an approach further, for example by reducing risks with the help of some kind of loss protection or by reducing the holding period (the shorter the better).
I only trade ETFs (for various reasons). Using the example of an inverse 3x ETF on the Russell 2000, it is easy to see that in a difficult period, only short mean-reversion pieces are taken, upward-trends are ignored and losses are limited without "ifs and buts".
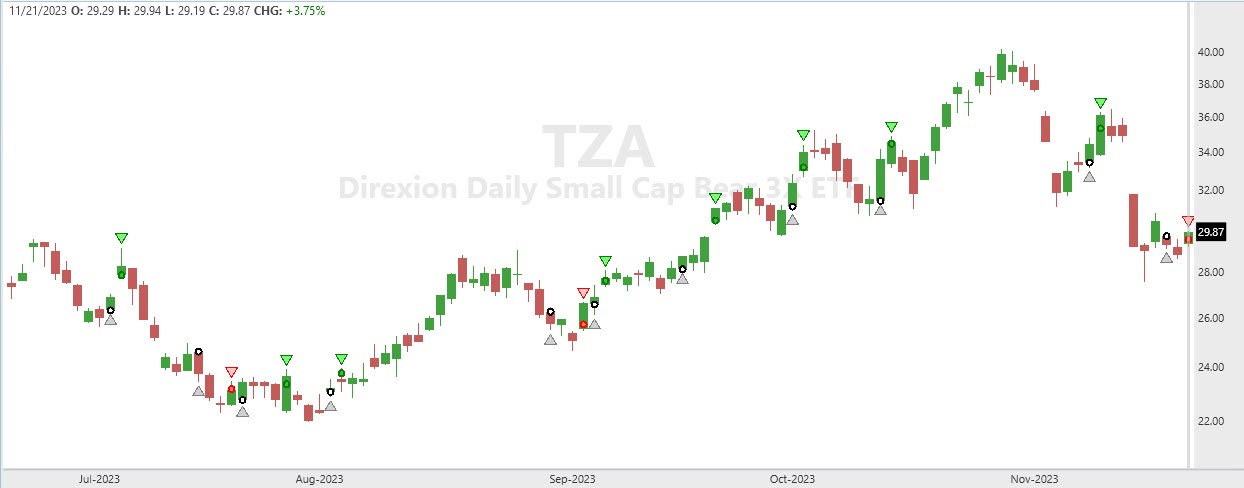
I only trade ETFs (for various reasons). Using the example of an inverse 3x ETF on the Russell 2000, it is easy to see that in a difficult period, only short mean-reversion pieces are taken, upward-trends are ignored and losses are limited without "ifs and buts".
QUOTE:
Instead of focusing on a "smooth" equity curve, I'd suggest the following:
* make sure your strategy has enough trades, say more than 100 trades each month.
* make sure average profit per trade is large enough
* make sure your strategy does not "cherry pick" some favorable situations in the past, these situations will never occur again.
* instead make sure your strategy uses principles that hold in (most of) the past
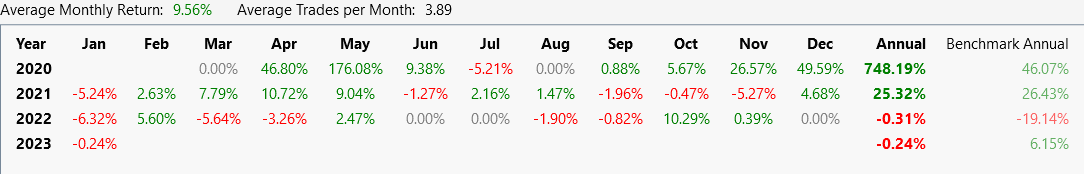
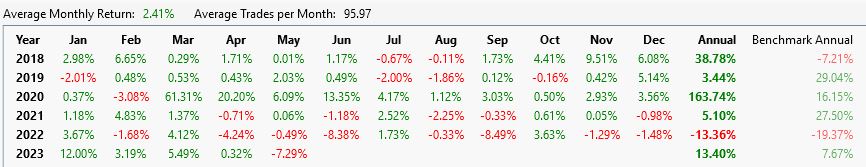
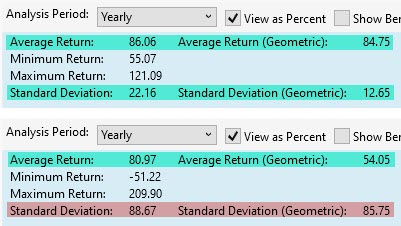
These criteria make sense, but I'm talking about something else, namely to achieve a strategy of consistently outperforming the market. In my screenshot you can see that APR doesn't show the real picture, like most other metrics. All this is because the average is being compared, and for me it is the year to year values that matter, i.e. if a strategy is underperforming the benchmark for a specified number of years, I would like to be able to filter out that strategy.
In terms of quality, the APR is not very meaningful. To take quality into account, I always consider the standard deviation (per year or quarter).
The profit (per year or quarter) provides information on how well a trading approach has performed over a certain period of time. It makes it possible to evaluate the return in relation to the time invested.
The standard deviation, on the other hand, measures the dispersion of returns around the average. A higher standard deviation indicates a higher risk. A good trading approach should not only be profitable but also stable in order to limit the risk.
The combination of profit (per year or quarter) and standard deviation (per year or quarter) allows a more comprehensive assessment of the performance and risks of a trading approach. A high profit per year is positive, but if it is accompanied by an extremely high standard deviation, this could indicate unpredictable fluctuations (as in your case) and higher risk.
A moderate profit per year with a low standard deviation indicates a consistent and stable trading approach.
QUOTE:
The combination of profit (per year or quarter) and standard deviation (per year or quarter) allows a more comprehensive assessment of the performance and risks ...
I agree and the Sharpe Ratio and Sortino Ratio are doing exactly that. They are dividing profit by standard deviation. I usually think of the Sharpe Ratio as the Z-Score of profit over its standard deviation.
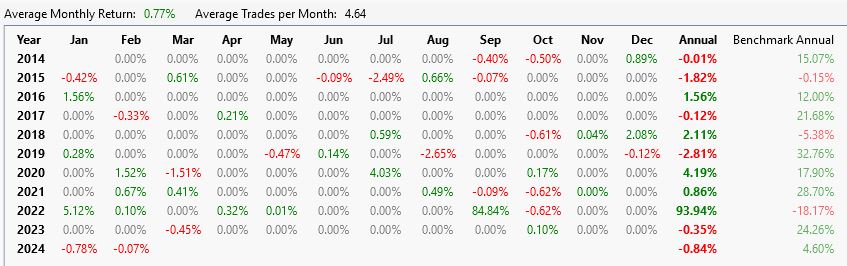
The same goes with candlestick patterns. I have selected top 10 patterns which showed an impressive n-bar and %-chance performance and put them into a strategy. Almost all did give a profit only in September 2022, which makes them garbage. We definitely need a metric that will take into account profitability by month.
There is a request https://www.wealth-lab.com/Discussion/Rank-by-E-ratio-or-MFE-in-Indicator-Profiler-and-Price-Grid-Evolver-10521 to add E-ratio instead of N-bar, but this won't help either.
Your Response
Post
Edit Post
Login is required