Hello :)
Is there anyone here that can help me get this strategy in code for WealthDeveloper, or help me create it in drag and drop?
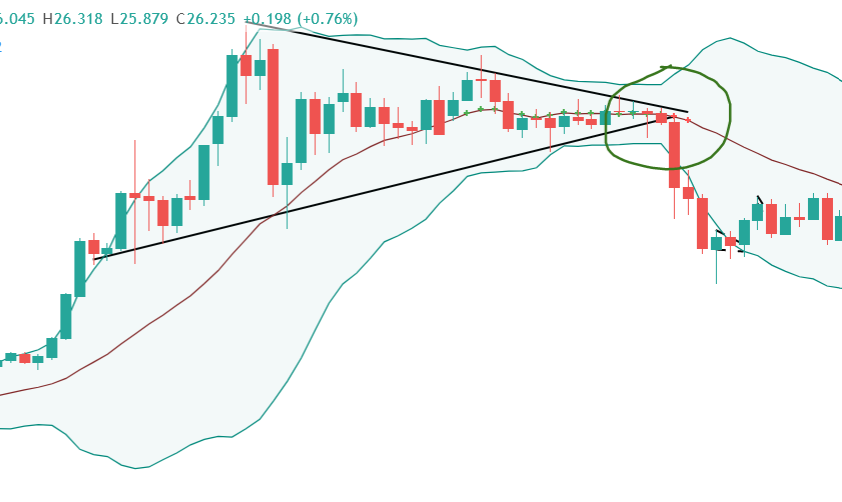
What I need is an indication of when the BB is squeezed in a certain stock, and then initiate buy signals when the stock breaks the upper or lower band.... I'll add a screenshot of a real case, so you get an idea :)
Here is the code from tradingview:
study("1337 Squeeze", overlay=true)
ma_len = input(20, "MA length")
atr_len = input(14, "ATR len")
atr_mult = input(1.5, "ATR multiplier", step=0.1)
std = input(2, "BB stdev", step=0.1)
[basis, bb_up, bb_down] = bb(close, ma_len, std)
atr = atr(atr_len)
k_up = basis + atr * atr_mult
k_down = basis - atr * atr_mult
squeeze = bb_down > k_down and bb_up < k_up
breakout = (squeeze and close > bb_up) or (squeeze and close < bb_down)
plot(basis, color=breakout?color.red:squeeze?color.green:na, linewidth=2, style=plot.style_cross)
plot(bb_up, color=color.red, linewidth=1, transp=100)
plot(bb_down, color=color.red, linewidth=1, transp=100)
plot(k_up, color=color.blue, linewidth=1, transp=100)
plot(k_down, color=color.blue, linewidth=1, transp=100)
Is there anyone here that can help me get this strategy in code for WealthDeveloper, or help me create it in drag and drop?
What I need is an indication of when the BB is squeezed in a certain stock, and then initiate buy signals when the stock breaks the upper or lower band.... I'll add a screenshot of a real case, so you get an idea :)
Here is the code from tradingview:
study("1337 Squeeze", overlay=true)
ma_len = input(20, "MA length")
atr_len = input(14, "ATR len")
atr_mult = input(1.5, "ATR multiplier", step=0.1)
std = input(2, "BB stdev", step=0.1)
[basis, bb_up, bb_down] = bb(close, ma_len, std)
atr = atr(atr_len)
k_up = basis + atr * atr_mult
k_down = basis - atr * atr_mult
squeeze = bb_down > k_down and bb_up < k_up
breakout = (squeeze and close > bb_up) or (squeeze and close < bb_down)
plot(basis, color=breakout?color.red:squeeze?color.green:na, linewidth=2, style=plot.style_cross)
plot(bb_up, color=color.red, linewidth=1, transp=100)
plot(bb_down, color=color.red, linewidth=1, transp=100)
plot(k_up, color=color.blue, linewidth=1, transp=100)
plot(k_down, color=color.blue, linewidth=1, transp=100)
Rename
Hi Henrik,
WL7 comes with built-in Squeeze indicator. Look it up on the Indicators tab. It measures a contraction of the Bollinger Bands inside the Keltner Bands.
If you could be more specific about the rules of your system we could try to help you build it in Blocks?
WL7 comes with built-in Squeeze indicator. Look it up on the Indicators tab. It measures a contraction of the Bollinger Bands inside the Keltner Bands.
If you could be more specific about the rules of your system we could try to help you build it in Blocks?
QUOTE:
squeeze = bb_down > k_down and bb_up < k_up
breakout = (squeeze and close > bb_up) or (squeeze and close < bb_down)
As I couldn't find any trace of your WL7 evaluation I assume that your question concerns WL6. (Indeed your free trial of WL6 ends next week.) Please note that WL6 is no longer for sale. There's hardly any point for a new user to invest time and effort into the legacy platform that cannot be purchased anymore. Let me suggest you start a demo of WL7 instead for improved user experience, faster speed and a greater potential going forward.
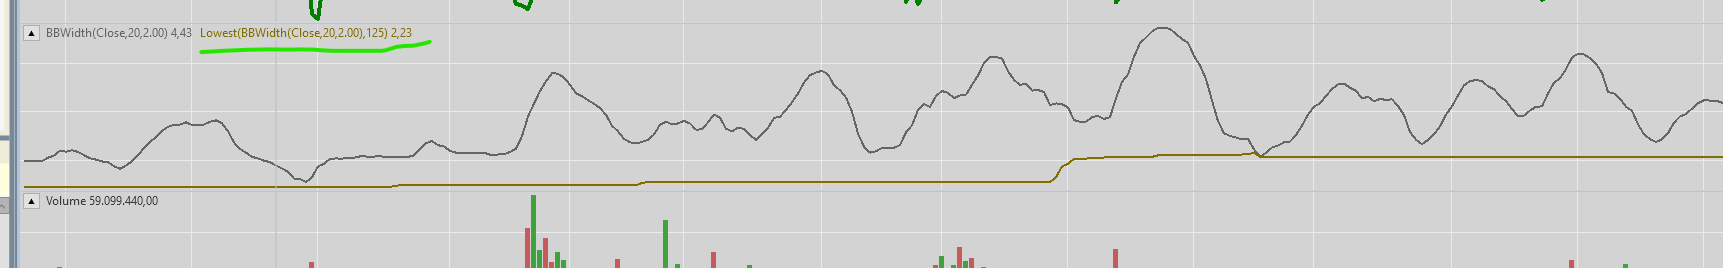
The lowest(BBWidth ...) indicator marked in green gives the lowest BBWidth during a period of 125 days. Which indicator can i use to see the lowest BBwidth in 125 days.
I want to create a bollinger squeeze indicator. The existing squeeze indicator refers to the Keltner bands and that's not what i want.
QUOTE:
The lowest(BBWidth ...) indicator marked in green gives the lowest BBWidth during a period of 125 days. Which indicator can i use to see the lowest BBwidth in 125 days.
The answer to "Which indicator" is in your own words: the Lowest(BBWidth ...) with a period of 125 days, isn't it? The one plotted on your chart.
QUOTE:
I want to create a bollinger squeeze indicator.
What is the formula?
This is the formula in MS.
bw:=Fml("BBTK - BandWidth");
bw<Ref(LLV(bw,125),-1);
Can this help of do i have to look for something else?
The bandwidth today has to be lower than the bandwidth in the past and the past must be 125 days.
bw:=Fml("BBTK - BandWidth");
bw<Ref(LLV(bw,125),-1);
Can this help of do i have to look for something else?
The bandwidth today has to be lower than the bandwidth in the past and the past must be 125 days.
1. This refers to an external Metastock indicator formula named "BBTK - BandWidth" that you don't show:
2. This is not an indicator but a logical condition:
You could assemble it from Building Blocks e.g. "Indicator Compare to Indicator" (125 bars ago).
QUOTE:
bw:=Fml("BBTK - BandWidth");
2. This is not an indicator but a logical condition:
QUOTE:
bw<Ref(LLV(bw,125),-1);
You could assemble it from Building Blocks e.g. "Indicator Compare to Indicator" (125 bars ago).
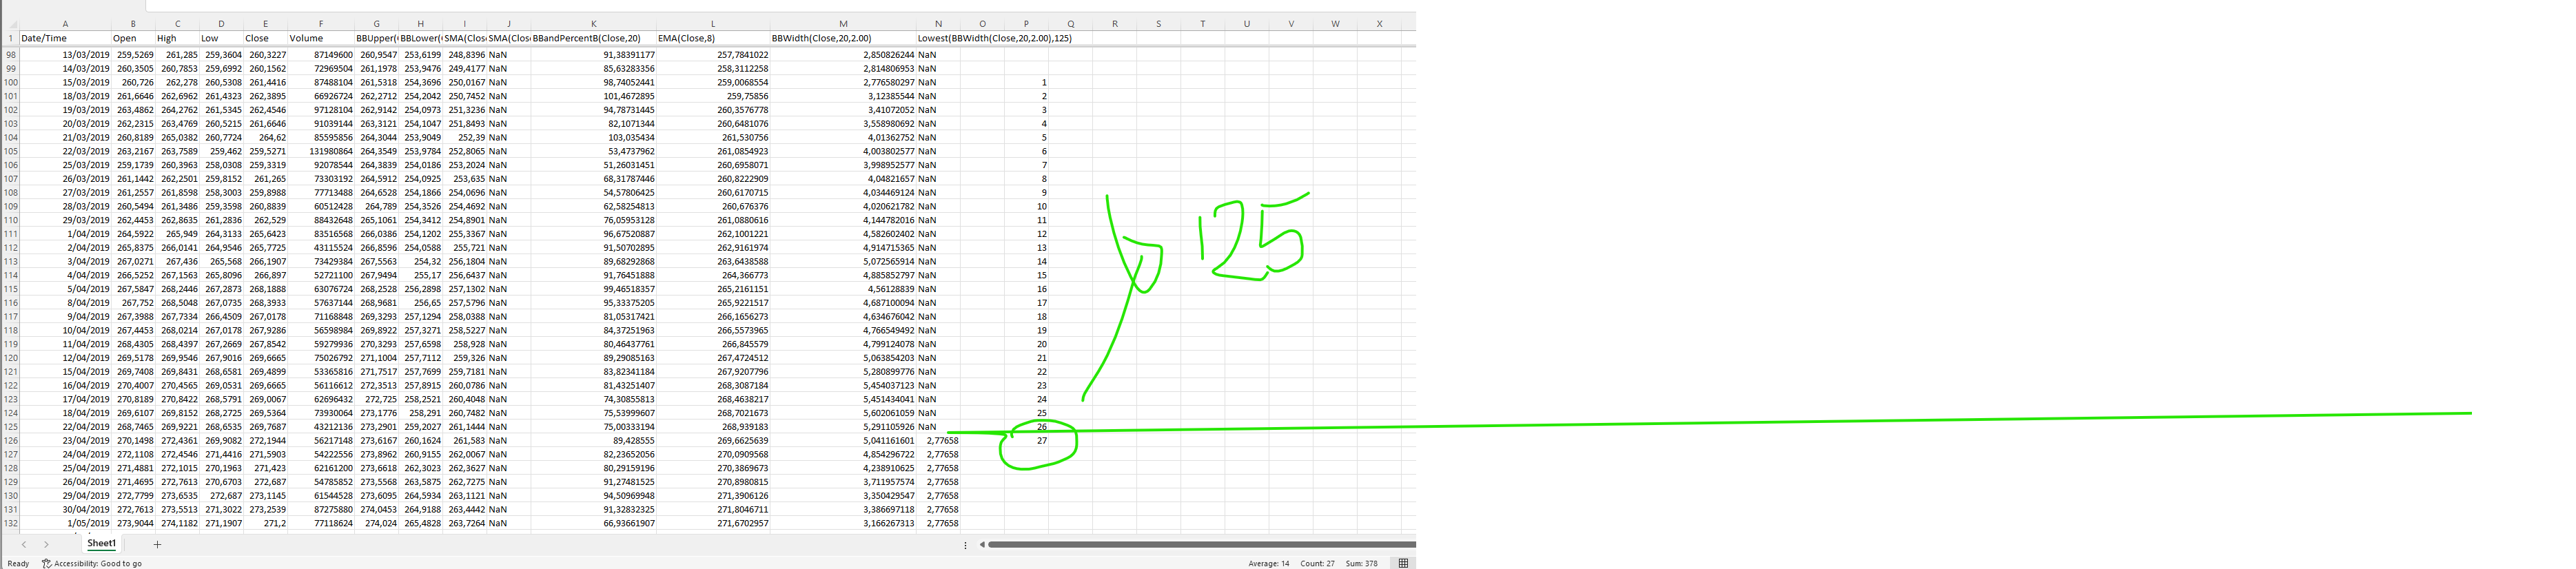
125 days instead of 27.
external MS indicator is the same as WL. That's not the problem. It's indeed a logical condition.
Ok i can assemble it in building blocks but can i create this as an indicator. In MS i always created my setups as an indicatorn that i used in the system tester.
Ok i can assemble it in building blocks but can i create this as an indicator. In MS i always created my setups as an indicatorn that i used in the system tester.
QUOTE:
125 days instead of 27.
First bar after value not being NaN.
QUOTE:
can i create this as an indicator.
Already answered: Post #4, first paragraph.
Post #4, this is not the correct indicator. I will try to find another way to explain it.
From some Googling I think the BBTK is part of the John Bollinger BBand Toolkit. If so, this is proprietary and we don't have access to how it's calculated. Do you know the formula?
Here's some source info, looks like it's just the BBWidth?
https://www.tradenavigator.com/legacy/pdf/BBTK.pdf
https://www.tradenavigator.com/legacy/pdf/BBTK.pdf
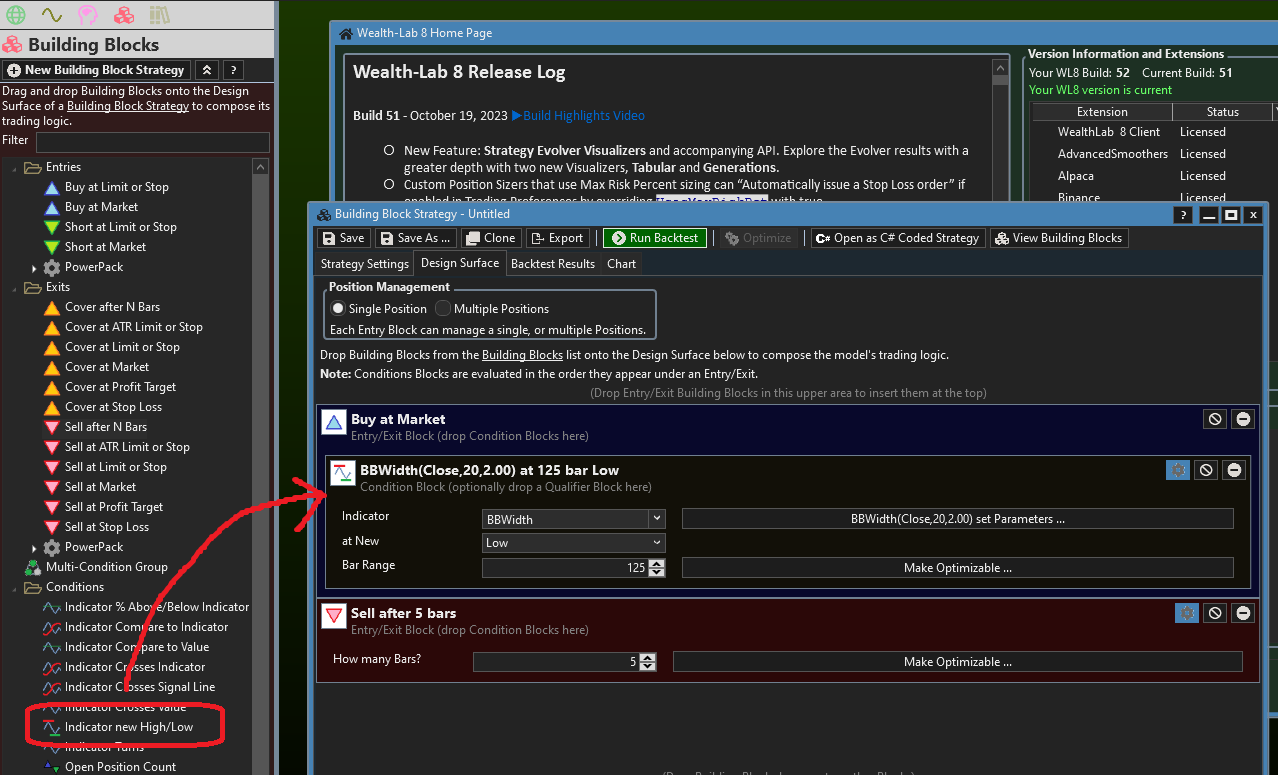
Why not use the Indicator New High/Low Condition Block?
I have the bollinger toolkit for MS and all the formulas but i don't want to have problems with the rights. I compared Bandwidth between WL and MS and there is already a difference.
@Glitch
There are so many indicators in WL that i don't know where to start.
There are so many indicators in WL that i don't know where to start.
The difference could just be due to parameter settings. Does your MS indicator use the 20 periods and 2 standard deviations that our BBWidth defaults to?
BBWidth is simply the high minus the low BBand so I don't think there should be a difference, all things being equal.
Also, data might come into play. If WL8 and MS are using different data sources then there might be differences in the data.
BBWidth is simply the high minus the low BBand so I don't think there should be a difference, all things being equal.
Also, data might come into play. If WL8 and MS are using different data sources then there might be differences in the data.
I tried this one but that's no ok.
MS indicator uses the 20 and 2.
Data will not come into play because Norgate is my data provider for both.
Data will not come into play because Norgate is my data provider for both.
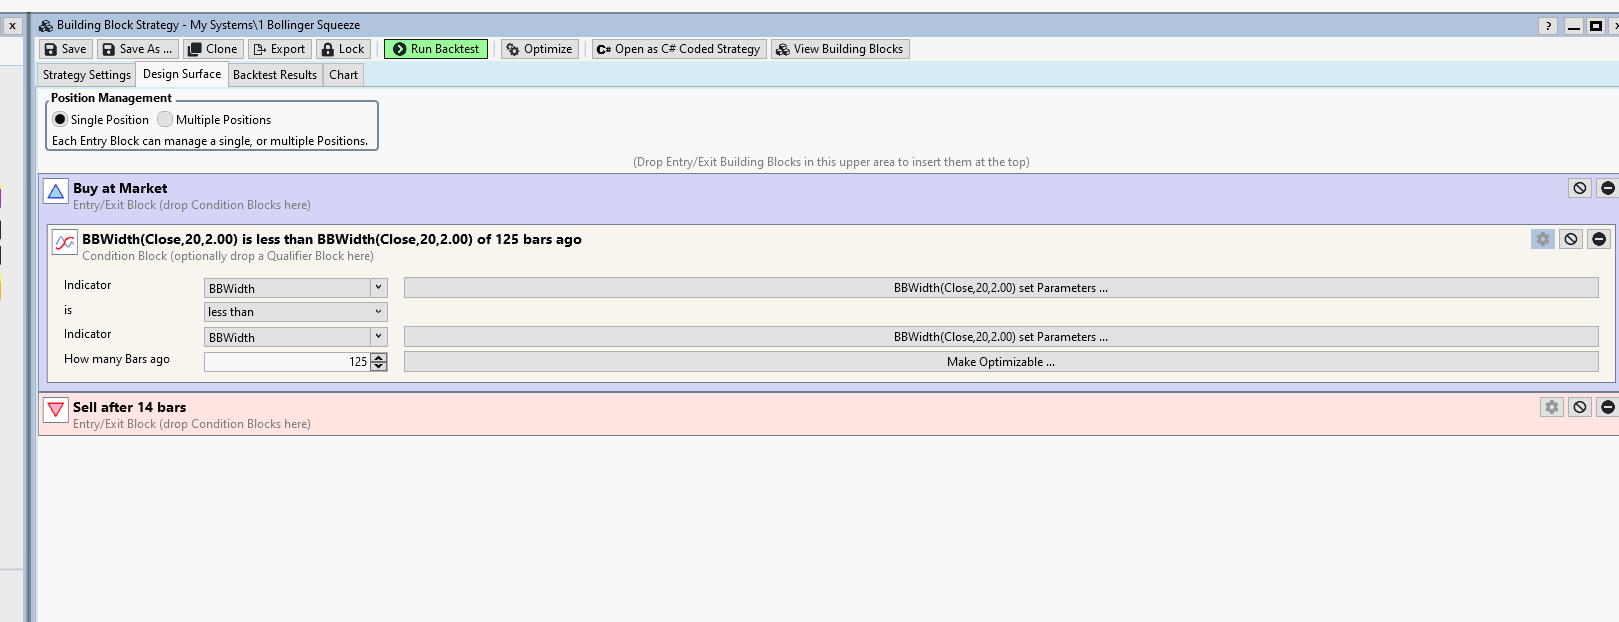
That’s not right. What you want to do is use the Indicator at New High/Low Block like I showed you in Post #13.
What is wrong? I want to learn from my mistakes,
The Block you chose does a simple comparison of the BBWidth current bar to the BBWidth 125 bars ago. This isn't what you're going after.
You're trying to model a condition that resolves to true if the BBWidth is at the LOWEST VALUE ever within the 125 bars.
The "Indicator new High/Low" Block does just that.
You're trying to model a condition that resolves to true if the BBWidth is at the LOWEST VALUE ever within the 125 bars.
The "Indicator new High/Low" Block does just that.
Thanks!
Print screen removed for owner rights.
Print screen removed for owner rights.
Looks good!
Your Response
Post
Edit Post
Login is required