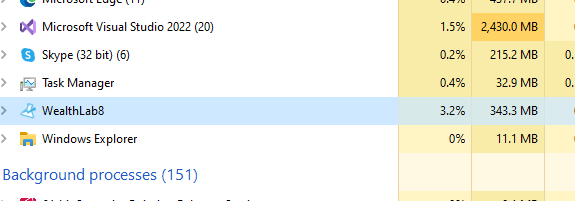
I'm seeing that if WL8 is left open with no streaming, no running SM, nothing running then WL8 will still sip about 20% of CPU all the time. I left WL8 open overnight, and it caused my PC to become very hot.

I looked into the threads it is running and I found wpfgfx_cor3.dll is the main CPU user
When WL8 window is minimized only then CPU consumption goes down and it is no longer running wpfgfx_cor3.dll
Do you think it can be optimized to save CPU when nothing is being run on WL8?
I looked into the threads it is running and I found wpfgfx_cor3.dll is the main CPU user
When WL8 window is minimized only then CPU consumption goes down and it is no longer running wpfgfx_cor3.dll
Do you think it can be optimized to save CPU when nothing is being run on WL8?
Rename
I don't think so, it's really not anything WL is doing itself, it's just the WPF framework here.
Also I think it doesn't look like what I experience, for example after running streaming charts for a few hours solid here is my CPU:
3% for me too.
I have a fanless PC (meaning, no active cooling at all; just a passive case made of a big chunk of aluminium). I run it 24/7 and most of the times WL8 is open; some times running the Evolver for multiple days non-stop; and yet, I also don't experience that behaviour at all. I have WL8 open since this morning; and just been looking at the resource consumption for the last 10m: around 0.1% CPU, 0.2% GPU (integrated in my case) and 312MB RAM. Nothing special...
I do keep Windows (11 in my case) and any C# related framework (.NET Framework and .NET Core) always very up to date. You could try to see if you are running the latest versions of the runtime.
I do keep Windows (11 in my case) and any C# related framework (.NET Framework and .NET Core) always very up to date. You could try to see if you are running the latest versions of the runtime.
Also Andy, it might help to know what you were doing prior to leaving WL8, which streaming provider, etc. Maybe there's a disconnected websocket or something that's causing this at your end.
Clearly you have a WPF window sucking CPU time. It's even sucking GPU time according to your screenshot, so it's definitely a window causing the problem. But you never told us which window is the culprit so we can't troubleshoot it. Help us help you. Start closing child windows until the CPU time drops and report which child window is running without cause.
Also this runaway window might be from one of the WL extensions (and one of its windows). I would start uninstalling the extensions until the problem goes away.
Finally, I would see if there's an update to your video drivers for Windows 11 since they are directly involved. There maybe a bug in the video driver, but you need to determine which WPF call is leading to the video driver not returning control back to the OS like it should before you can report it to the video card manufacture.
Can you confirm this is not a problem with WL7 on the same machine?
As you can see from my screenshot below, my workstation doesn't have this runaway video problem (but it's not Windows 11 either). I'm running .NET 6.0.4 for x64 Client and WL8 Build 5.
Thanks for the suggestions. I have the 5 windows open:
- Two C# coded strategy windows. No streaming. I used the window to backtest the strategy during intraday - looked at bar chart and symbol equity chart.
- SM window open with strategies not running (deactivated)
- Order manager window and
- WL8 Home Page
The WPF thread is always in Running mode. Based on Superticker's suggestion, I did the following:
- On closing one of the C# coded strategy windows, the WPF thread went to Wait:WrLpcReply mode and CPU usage drop from 15% to around 8%.
- One closing 2nd C# coded strategy window, CPU usage dropped to 3-5% range.
- After closing the SM and Order Manager window, CPU usage remained the same
- The last window left is the WL8 Home Page, after closing this, the CPU usage dropped to < 0.01. It looks like the flashing version mismatch on the home page is the culprit.

I did the following now:
- I reopened the saved workspace - with SM, OM and WL8 home page windows open, CPU usage is back in continuous 5% range as expected. GPU usage is 1%
- If I minimize the home page, then CPU and GPU usage is < 0.01.
- When I opened one C# coded strategy window, nothing happens. No chart is loaded
- After backtesting it and loading the chart, CPU and GPU is around 2-3%
- After opening 2nd C# coded strategy window, backtesting it and loading the chart, CPU usage is 5%, GPU usage is still 2-3%.
- After restoring the WL8 home page, CPU usage is 10%, GPU usage is 3-4%
- When I loaded the Symbol Equity chart under Backtest results in the strategy window, then CPU usage is 13% and WPF is now in Running mode. GPU usage is around 10%
- Loading Symbol Equity chart of 2nd strategy, then CPU is back to 15%. GPU usage is also 17%.
It looks like combination of strategy window charts and WL8 home page is causing the CPU usage. Symbol Equity chart causes increased GPU usage. If there is no streaming or no active running strategies, then I think the CPU/GPU usage should decline after chart has been loaded and left open but idle.
- Two C# coded strategy windows. No streaming. I used the window to backtest the strategy during intraday - looked at bar chart and symbol equity chart.
- SM window open with strategies not running (deactivated)
- Order manager window and
- WL8 Home Page
The WPF thread is always in Running mode. Based on Superticker's suggestion, I did the following:
- On closing one of the C# coded strategy windows, the WPF thread went to Wait:WrLpcReply mode and CPU usage drop from 15% to around 8%.
- One closing 2nd C# coded strategy window, CPU usage dropped to 3-5% range.
- After closing the SM and Order Manager window, CPU usage remained the same
- The last window left is the WL8 Home Page, after closing this, the CPU usage dropped to < 0.01. It looks like the flashing version mismatch on the home page is the culprit.
I did the following now:
- I reopened the saved workspace - with SM, OM and WL8 home page windows open, CPU usage is back in continuous 5% range as expected. GPU usage is 1%
- If I minimize the home page, then CPU and GPU usage is < 0.01.
- When I opened one C# coded strategy window, nothing happens. No chart is loaded
- After backtesting it and loading the chart, CPU and GPU is around 2-3%
- After opening 2nd C# coded strategy window, backtesting it and loading the chart, CPU usage is 5%, GPU usage is still 2-3%.
- After restoring the WL8 home page, CPU usage is 10%, GPU usage is 3-4%
- When I loaded the Symbol Equity chart under Backtest results in the strategy window, then CPU usage is 13% and WPF is now in Running mode. GPU usage is around 10%
- Loading Symbol Equity chart of 2nd strategy, then CPU is back to 15%. GPU usage is also 17%.
It looks like combination of strategy window charts and WL8 home page is causing the CPU usage. Symbol Equity chart causes increased GPU usage. If there is no streaming or no active running strategies, then I think the CPU/GPU usage should decline after chart has been loaded and left open but idle.
There are many elements in the Strategy window, including some potentially animated ones, so I think the modest idle CPU is not something we'll be able to do anything about. Best practice is of course closing WL8 before retiring for the night.
QUOTE:
On closing one of the C# coded strategy windows, the WPF thread went to Wait:WrLpcReply mode and CPU usage drop from 15% to around 8%.
Generally speaking, the WPF thread should be in some kind of wait state. If it's not, that doesn't sound right. But do appreciate any animation "may" bring it out of that wait state.
I'm afraid the failure of the WPF thread to return to its wait state may be a video driver problem. We typically see Windows drivers as being highly optimized. But the exception is with new releases; in this case Windows 11. Understand there is great pressure to get the new product out the door, and since drivers are tough to optimize (especially video drivers), they are the last to get tweaked.
I would go to the video card manufacture's website and update all the video drivers for your system. And I would continue to do that for the next 18 months at least. Also understand, many video card (and computer) manufactures simply "copy" the video driver the video chipset manufacture posts, which would be most up-to-date. So it's "possible" you can download the most up-to-date driver from the video chipset manufacture directly. But I would consult with the video card manufacture first because there could be timing differences between the two implementations.
When the video drivers are fully optimized for Windows 11 (over the next 18 months), the WPF thread should remain in a "wait state" most of the time. Happy computing.
I'm seeing the same issue as the original entry. After loading WL8 my laptop start to run hot and the fans kicks in loud. A few minutes after closing WL8 the laptop fans gets silent and the laptop is much cooler.
The laptop almost never gets hot and I hardly hear the fans. Until I start WL8. After a trading day the laptop is hot!
It would be helpful to find why WL8 (directly or indirectly) is causing this.
The laptop almost never gets hot and I hardly hear the fans. Until I start WL8. After a trading day the laptop is hot!
It would be helpful to find why WL8 (directly or indirectly) is causing this.
QUOTE:
I'm seeing the same issue as the original entry
What version of Windows are you running? Tell us a little more about your video hardware. Most video hardware platforms are not seeing this problem. Does this occur with WL7 or just WL8?
I seriously doubt this is a hardware or OS specific problem superticker... WL8. Windows 11 21H2. AMD Ryzen 7 5700U with Radeon Graphics. 16.0 GB. I rather not going trough this rabbit hole.
This is a software (WL8 and its dependencies) issue. I'll try to use resource monitor to figure out what's going...
This is a software (WL8 and its dependencies) issue. I'll try to use resource monitor to figure out what's going...
QUOTE:
WL8. Windows 11
Well, this is the only configuration combination that's causing this problem. Try installing WL7 on your Windows 11 system and see if the problem goes away. There was a big change between WL7 and WL8 with the WPF video rendering, so if WL7 fixes the problem, that would narrow it down to the new WPF display package WL8 is using to support dark screen mode.
QUOTE:
I'll try to use resource monitor to figure out what's going...
That's an excellent idea. If you look at the original post, you'll see the WPF process is not returning control back to the OS like it should. Status: running. That's a big red flag the video driver is somehow looping--very bad. Even if the application has bugs, the video driver should never be doing that. That video driver needs to be fixed/updated. Nobody else's video driver is doing that.
If the developers can't reproduce the problem, they can't fix the problem. But you already knew that.
I've also noticed high CPU usage in WL8.
Some additional points:
1) The CPU usage is highest when the Chart tab is selected, less with others tabs.
2) I opened 2 identical strategies in WL8, WL7 and WL6.9; only WL8 had this issue.

3) Minimizing the WL8 app or the strategy windows drops the CPU usage to normal (i.e. negligible) levels.
Hope this helps in pinpointing the issue.
Some additional points:
1) The CPU usage is highest when the Chart tab is selected, less with others tabs.
2) I opened 2 identical strategies in WL8, WL7 and WL6.9; only WL8 had this issue.
3) Minimizing the WL8 app or the strategy windows drops the CPU usage to normal (i.e. negligible) levels.
Hope this helps in pinpointing the issue.
I don’t see this as an issue, it’s normal operation.
QUOTE:
2) I opened 2 identical strategies in WL8, WL7 and WL6.9; only WL8 had this issue.
Yes, I kind of figured this might be the case. Can you tell us what video hardware you are running? And is this on Windows 11?
@Glitch: Is the new WPF display package on WL8 using any DirectX calls? If so, I would disable that because the device drivers for DirectX are more problematic. Just avoid DirectX altogether. WL isn't doing any real-time animation, so you don't need DirectX. The "standard" video that uses the standard video drivers will be more reliable.
And Glitch, you're not going to be able to reproduce what they are seeing because you have different video hardware and drivers. (They could send their computer to you.) From what I'm seeing, the problem only shows up on Windows 11 with WL8. Apparently, the WPF display package (on WL8) is making some strange calls the video driver (for Win11) that the driver can't handle correctly. You might contact the author of that WPF package is see if he's seen this problem with some Windows 11 video hardware configurations. He's the one that needs to purse the hardware manufacture about updating the video driver. Happy computing.
We don’t have any control of any kind of “WPF Package”. WPF is part of .NET and the author is Microsoft. WL8 does use .NET6 while WL7 uses .NET3.1.
QUOTE:
We don’t have any control of any kind of “WPF Package”.
I thought WL8 was using a third-party package to implement dark screen mode. So you're saying the only change is from Core 3.1 to .NET 6.0? Well, .NET should just be using standard video calls, not DirectX. Right? So that shouldn't be an issue.
So, bottle line, the .NET 6.0 WPF routines are taxing the Windows 11 video drivers more than Core 3.1 did. That's interesting. (It's actually good because 6.0 is taking advantage of GPU hardware Core 3.1 wasn't doing.) So now the Windows 11 video drivers need to be updated.
The reason I know this is a video driver issue, other than the screenshot given in the original post (which is damming), is because no Windows 10 (or 7) user is experiencing this problem even though they are using the same application code base.
What would be useful is if Windows 11 users would post more about their video hardware, especially the video chipset employed with the problem. The video drivers are tied to that video chipset, so we would be able to identify which video driver is the culprit.
A bad driver can damage hardware, so users should be vigilant about updating new releases of their OS at the device driver level.
@superticker:
1) Windows 10 (latest build)
2) NVIDIA GeForce RTX 2070 video card
1) Windows 10 (latest build)
2) NVIDIA GeForce RTX 2070 video card
QUOTE:
@superticker:
1) Windows 10 (latest build)
That's interesting. A Windows 10 user has this problem. Is it in the WPF routines? Have you updated your video drivers since .NET 6.0 was released? And you're running .NET 6.0.6 (or better)?
I'm running Windows 7 and don't have any problems; I'm running .NET 6.0.6. But my system isn't running the more advanced GPU processors either. At any rate, this is somehow hardware related. With the same application code base, some hardware platforms are more vulnerable than others. However, it's very troubling to learn both Windows 10 and 11 have this problem because they would be using different video device drivers. Moreover, the Windows 10 video drivers would be mature enough to not have a latent bug like this; such a bug would be fixed by now unless .NET 6.0 exposed a new vulnerability.
If this is .NET 6.0.X related--and it seems to be--perhaps a Microsoft TechNet forum may be discussing this WPF issue in better detail.
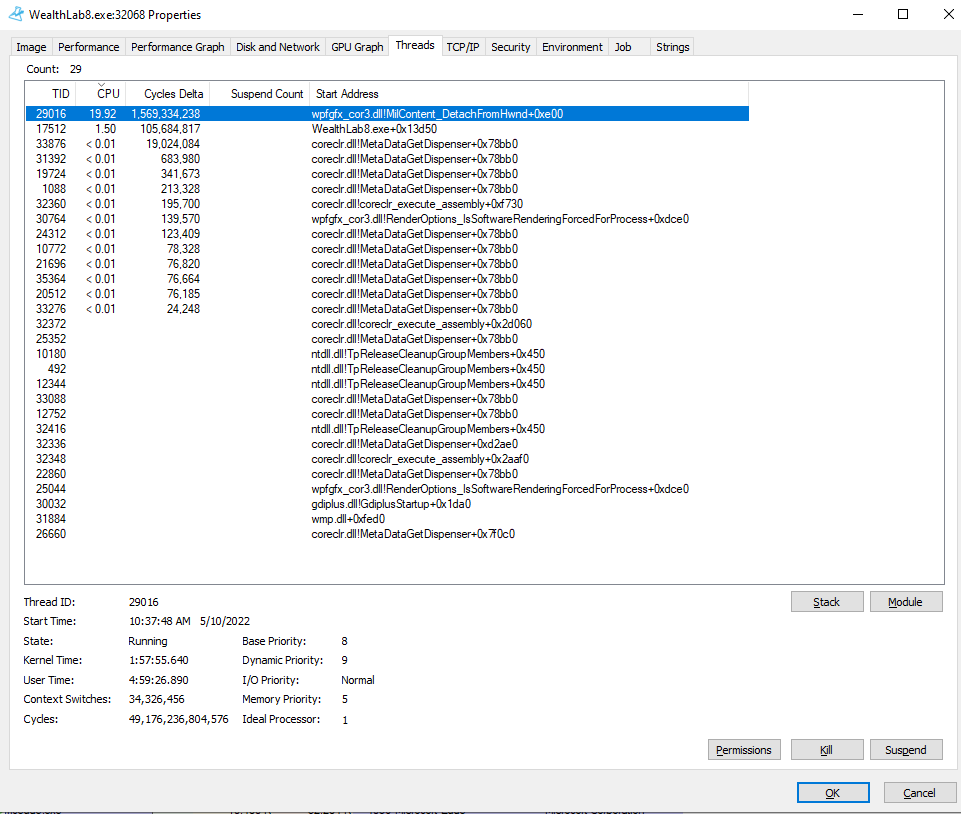
I looked into this problem some more after having experienced it again on my older laptop. I'm NOT looking for a solution, I'm just providing information here in case the WL team wants to look into this report further.
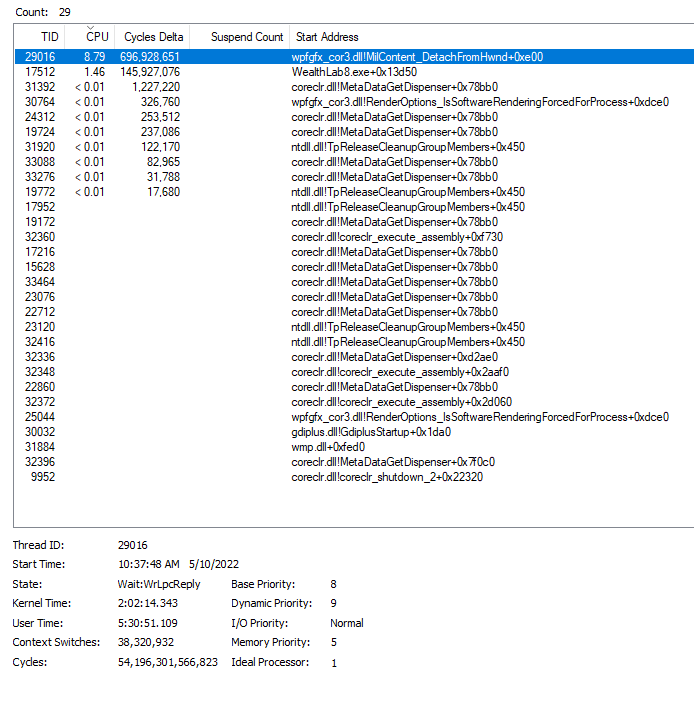
The scenario is that WL8 was utilizing little CPU. I had one chart (one-minute) streaming, and one simple strategy open. After a couple runs of the strategy, the CPU usage by WL8 went from approximately 3% to roughly 15% and stuck there. This was after completion of the simple strategy run.
So, I used Process Explorer to grab a few stack dumps of the offending WL8 thread. The thread has a start address in wpfgfx_cor3.dll. From the thread stack, it looks like DWM (Windows Desktop Window Manager) thumbnail updates may be the issue. Here, notice the DWM calls...
ntoskrnl.exe!KeSynchronizeExecution+0x6c56
ntoskrnl.exe!KeWaitForSingleObject+0x1460
ntoskrnl.exe!KeWaitForSingleObject+0x98f
ntoskrnl.exe!KeWaitForSingleObject+0x233
ntoskrnl.exe!RtlFindClearBitsAndSetEx+0xc7d
ntoskrnl.exe!KiCheckForKernelApcDelivery+0x359
ntoskrnl.exe!KeWaitForSingleObject+0x1787
ntoskrnl.exe!KeWaitForSingleObject+0x98f
ntoskrnl.exe!KeWaitForSingleObject+0x233
ntoskrnl.exe!PsGetProcessInheritedFromUniqueProcessId+0x153
ntoskrnl.exe!LpcRequestPort+0x3946
ntoskrnl.exe!LpcRequestPort+0x35ab
ntoskrnl.exe!LpcRequestPort+0x3f56
ntoskrnl.exe!setjmpex+0x82d8
ntdll.dll!NtAlpcSendWaitReceivePort+0x14
dwmapi.dll!DwmUnregisterThumbnail+0x46a
dwmapi.dll!DwmFlush+0x5e
wpfgfx_cor3.dll!MilContent_DetachFromHwnd+0x5539a
wpfgfx_cor3.dll!MilContent_DetachFromHwnd+0x54c1d
wpfgfx_cor3.dll!MilContent_DetachFromHwnd+0x54abb
wpfgfx_cor3.dll!MilContent_DetachFromHwnd+0x43eb8
wpfgfx_cor3.dll!MilContent_DetachFromHwnd+0x1059
wpfgfx_cor3.dll!MilContent_DetachFromHwnd+0x1120
wpfgfx_cor3.dll!MilContent_DetachFromHwnd+0xe43
KERNEL32.DLL!BaseThreadInitThunk+0x14
ntdll.dll!RtlUserThreadStart+0x21
A refresh of the thread's stack showed the following. Notice the ArcToBezier call...
ntoskrnl.exe!KeSynchronizeExecution+0x6c56
ntoskrnl.exe!KeWaitForSingleObject+0x1460
ntoskrnl.exe!KeWaitForSingleObject+0x98f
ntoskrnl.exe!KeWaitForSingleObject+0x233
ntoskrnl.exe!RtlFindClearBitsAndSetEx+0xc7d
ntoskrnl.exe!KiCheckForKernelApcDelivery+0x359
ntoskrnl.exe!KeSynchronizeExecution+0x3afa
wpfgfx_cor3.dll!MilContent_DetachFromHwnd+0x1e584
wpfgfx_cor3.dll!MILAddRef+0x813f
wpfgfx_cor3.dll!MilUtility_ArcToBezier+0xb717
wpfgfx_cor3.dll!MILAddRef+0x1be8a
wpfgfx_cor3.dll!MilContent_DetachFromHwnd+0x4db6b
wpfgfx_cor3.dll!MilContent_DetachFromHwnd+0x33c10
wpfgfx_cor3.dll!MilContent_DetachFromHwnd+0x30976
wpfgfx_cor3.dll!MilContent_DetachFromHwnd+0x51d94
wpfgfx_cor3.dll!MilContent_DetachFromHwnd+0x5cb9b
wpfgfx_cor3.dll!MilContent_DetachFromHwnd+0x50d03
wpfgfx_cor3.dll!MilContent_DetachFromHwnd+0x53271
wpfgfx_cor3.dll!MilContent_DetachFromHwnd+0x56186
wpfgfx_cor3.dll!MilContent_DetachFromHwnd+0x5476f
wpfgfx_cor3.dll!MilContent_DetachFromHwnd+0x43cf8
wpfgfx_cor3.dll!MilContent_DetachFromHwnd+0x43b69
wpfgfx_cor3.dll!MilContent_DetachFromHwnd+0x43c7a
wpfgfx_cor3.dll!MilContent_DetachFromHwnd+0xfae
wpfgfx_cor3.dll!MilContent_DetachFromHwnd+0x112f
wpfgfx_cor3.dll!MilContent_DetachFromHwnd+0xe43
KERNEL32.DLL!BaseThreadInitThunk+0x14
ntdll.dll!RtlUserThreadStart+0x21
Another refresh with the ArcToBezier showing up...
ntoskrnl.exe!KeSynchronizeExecution+0x6c56
ntoskrnl.exe!KeWaitForSingleObject+0x1460
ntoskrnl.exe!KeWaitForSingleObject+0x98f
ntoskrnl.exe!KeWaitForSingleObject+0x233
ntoskrnl.exe!RtlFindClearBitsAndSetEx+0xc7d
ntoskrnl.exe!KiCheckForKernelApcDelivery+0x359
ntoskrnl.exe!KiCheckForKernelApcDelivery+0x2b
ntoskrnl.exe!KeLeaveCriticalRegion+0x38
dxgkrnl.sys!NtGdiDdDDIWaitForSynchronizationObjectFromGpu+0x5027
dxgkrnl.sys!NtGdiDdDDICreateAllocation+0xd
ntoskrnl.exe!setjmpex+0x82d8
win32u.dll!NtGdiDdDDICreateAllocation+0x14
GDI32.dll!D3DKMTCreateAllocation+0xf0
d3d9.dll+0x13da4
igdumdim64.dll!GTPIN_IGC_PrepareForGTPin+0xf9f7
igdumdim64.dll!GTPIN_IGC_PrepareForGTPin+0x40c3d
igdumdim64.dll!GTPIN_IGC_PrepareForGTPin+0x43ec0
d3d9.dll+0x1c433
d3d9.dll+0x1bfc9
d3d9.dll+0x35c99
d3d9.dll+0xfff6
d3d9.dll+0xf3fe
d3d9.dll+0xf0e0
wpfgfx_cor3.dll!RenderOptions_IsSoftwareRenderingForcedForProcess+0x554af
wpfgfx_cor3.dll!RenderOptions_IsSoftwareRenderingForcedForProcess+0x730f0
wpfgfx_cor3.dll!RenderOptions_IsSoftwareRenderingForcedForProcess+0x682a5
wpfgfx_cor3.dll!RenderOptions_IsSoftwareRenderingForcedForProcess+0x69b69
wpfgfx_cor3.dll!MILAddRef+0xf236
wpfgfx_cor3.dll!MILAddRef+0xf28a
wpfgfx_cor3.dll!RenderOptions_IsSoftwareRenderingForcedForProcess+0x6f8a4
wpfgfx_cor3.dll!MILAddRef+0xefbe
wpfgfx_cor3.dll!MILAddRef+0xf994
wpfgfx_cor3.dll!MILAddRef+0x7077
wpfgfx_cor3.dll!MILAddRef+0x6f78
wpfgfx_cor3.dll!MILAddRef+0x7719
wpfgfx_cor3.dll!MILAddRef+0x72c4
wpfgfx_cor3.dll!MILAddRef+0x7995
wpfgfx_cor3.dll!MILAddRef+0x7b6c
wpfgfx_cor3.dll!MilUtility_ArcToBezier+0xb698
wpfgfx_cor3.dll!MILAddRef+0x1b904
wpfgfx_cor3.dll!MilContent_DetachFromHwnd+0x505c1
wpfgfx_cor3.dll!MilContent_DetachFromHwnd+0x4ebed
wpfgfx_cor3.dll!MilContent_DetachFromHwnd+0x51f60
wpfgfx_cor3.dll!MilContent_DetachFromHwnd+0x5cbf5
wpfgfx_cor3.dll!MilContent_DetachFromHwnd+0x50d03
wpfgfx_cor3.dll!MilContent_DetachFromHwnd+0x53271
wpfgfx_cor3.dll!MilContent_DetachFromHwnd+0x56186
wpfgfx_cor3.dll!MilContent_DetachFromHwnd+0x5476f
wpfgfx_cor3.dll!MilContent_DetachFromHwnd+0x43cf8
wpfgfx_cor3.dll!MilContent_DetachFromHwnd+0x43b69
wpfgfx_cor3.dll!MilContent_DetachFromHwnd+0x43c7a
wpfgfx_cor3.dll!MilContent_DetachFromHwnd+0xfae
wpfgfx_cor3.dll!MilContent_DetachFromHwnd+0x112f
wpfgfx_cor3.dll!MilContent_DetachFromHwnd+0xe43
KERNEL32.DLL!BaseThreadInitThunk+0x14
ntdll.dll!RtlUserThreadStart+0x21
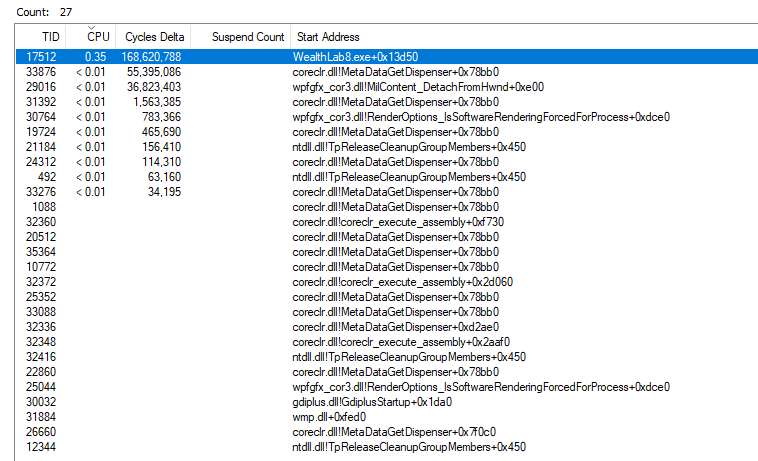
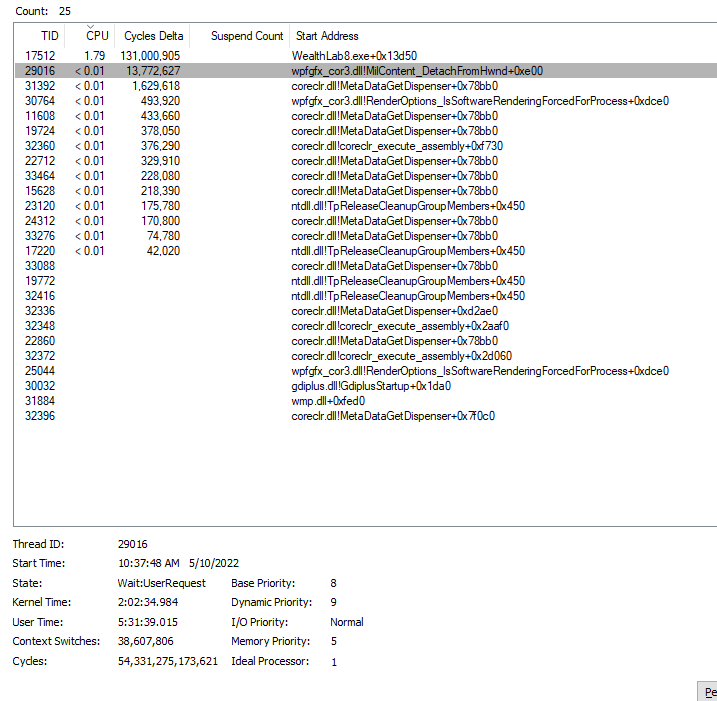
Also, if you minimize the strategy's window and/or the chart window, the CPU usage will go way down. If you minimize WL8 then CPU usage goes down some more.
The machine is running Windows 10, all updates applied and up-to-date drivers. WL8 build is 35. In chart preferences "Disable Rendering Optimizations" is NOT checked.
The CPU is an Intel I5-4200U (mobile) from circa 2013, and it has 2 cores (4 logical), and runs at 1.6 GHz base. If this issue is occurring on my AMD 5950x machine, I doubt it is noticeable due to the machine's CPU and graphics processing power.
In case the problem is related to DWM then there is this: https://learn.microsoft.com/en-us/windows/win32/dwm/thumbnail-ovw and this https://learn.microsoft.com/en-us/windows/win32/dwm/bestpractices-ovw
In any case, I'm not trying to prove the information given above as right or wrong, just supplying the information in case the WL8 team wants to look at this any further.
The scenario is that WL8 was utilizing little CPU. I had one chart (one-minute) streaming, and one simple strategy open. After a couple runs of the strategy, the CPU usage by WL8 went from approximately 3% to roughly 15% and stuck there. This was after completion of the simple strategy run.
So, I used Process Explorer to grab a few stack dumps of the offending WL8 thread. The thread has a start address in wpfgfx_cor3.dll. From the thread stack, it looks like DWM (Windows Desktop Window Manager) thumbnail updates may be the issue. Here, notice the DWM calls...
ntoskrnl.exe!KeSynchronizeExecution+0x6c56
ntoskrnl.exe!KeWaitForSingleObject+0x1460
ntoskrnl.exe!KeWaitForSingleObject+0x98f
ntoskrnl.exe!KeWaitForSingleObject+0x233
ntoskrnl.exe!RtlFindClearBitsAndSetEx+0xc7d
ntoskrnl.exe!KiCheckForKernelApcDelivery+0x359
ntoskrnl.exe!KeWaitForSingleObject+0x1787
ntoskrnl.exe!KeWaitForSingleObject+0x98f
ntoskrnl.exe!KeWaitForSingleObject+0x233
ntoskrnl.exe!PsGetProcessInheritedFromUniqueProcessId+0x153
ntoskrnl.exe!LpcRequestPort+0x3946
ntoskrnl.exe!LpcRequestPort+0x35ab
ntoskrnl.exe!LpcRequestPort+0x3f56
ntoskrnl.exe!setjmpex+0x82d8
ntdll.dll!NtAlpcSendWaitReceivePort+0x14
dwmapi.dll!DwmUnregisterThumbnail+0x46a
dwmapi.dll!DwmFlush+0x5e
wpfgfx_cor3.dll!MilContent_DetachFromHwnd+0x5539a
wpfgfx_cor3.dll!MilContent_DetachFromHwnd+0x54c1d
wpfgfx_cor3.dll!MilContent_DetachFromHwnd+0x54abb
wpfgfx_cor3.dll!MilContent_DetachFromHwnd+0x43eb8
wpfgfx_cor3.dll!MilContent_DetachFromHwnd+0x1059
wpfgfx_cor3.dll!MilContent_DetachFromHwnd+0x1120
wpfgfx_cor3.dll!MilContent_DetachFromHwnd+0xe43
KERNEL32.DLL!BaseThreadInitThunk+0x14
ntdll.dll!RtlUserThreadStart+0x21
A refresh of the thread's stack showed the following. Notice the ArcToBezier call...
ntoskrnl.exe!KeSynchronizeExecution+0x6c56
ntoskrnl.exe!KeWaitForSingleObject+0x1460
ntoskrnl.exe!KeWaitForSingleObject+0x98f
ntoskrnl.exe!KeWaitForSingleObject+0x233
ntoskrnl.exe!RtlFindClearBitsAndSetEx+0xc7d
ntoskrnl.exe!KiCheckForKernelApcDelivery+0x359
ntoskrnl.exe!KeSynchronizeExecution+0x3afa
wpfgfx_cor3.dll!MilContent_DetachFromHwnd+0x1e584
wpfgfx_cor3.dll!MILAddRef+0x813f
wpfgfx_cor3.dll!MilUtility_ArcToBezier+0xb717
wpfgfx_cor3.dll!MILAddRef+0x1be8a
wpfgfx_cor3.dll!MilContent_DetachFromHwnd+0x4db6b
wpfgfx_cor3.dll!MilContent_DetachFromHwnd+0x33c10
wpfgfx_cor3.dll!MilContent_DetachFromHwnd+0x30976
wpfgfx_cor3.dll!MilContent_DetachFromHwnd+0x51d94
wpfgfx_cor3.dll!MilContent_DetachFromHwnd+0x5cb9b
wpfgfx_cor3.dll!MilContent_DetachFromHwnd+0x50d03
wpfgfx_cor3.dll!MilContent_DetachFromHwnd+0x53271
wpfgfx_cor3.dll!MilContent_DetachFromHwnd+0x56186
wpfgfx_cor3.dll!MilContent_DetachFromHwnd+0x5476f
wpfgfx_cor3.dll!MilContent_DetachFromHwnd+0x43cf8
wpfgfx_cor3.dll!MilContent_DetachFromHwnd+0x43b69
wpfgfx_cor3.dll!MilContent_DetachFromHwnd+0x43c7a
wpfgfx_cor3.dll!MilContent_DetachFromHwnd+0xfae
wpfgfx_cor3.dll!MilContent_DetachFromHwnd+0x112f
wpfgfx_cor3.dll!MilContent_DetachFromHwnd+0xe43
KERNEL32.DLL!BaseThreadInitThunk+0x14
ntdll.dll!RtlUserThreadStart+0x21
Another refresh with the ArcToBezier showing up...
ntoskrnl.exe!KeSynchronizeExecution+0x6c56
ntoskrnl.exe!KeWaitForSingleObject+0x1460
ntoskrnl.exe!KeWaitForSingleObject+0x98f
ntoskrnl.exe!KeWaitForSingleObject+0x233
ntoskrnl.exe!RtlFindClearBitsAndSetEx+0xc7d
ntoskrnl.exe!KiCheckForKernelApcDelivery+0x359
ntoskrnl.exe!KiCheckForKernelApcDelivery+0x2b
ntoskrnl.exe!KeLeaveCriticalRegion+0x38
dxgkrnl.sys!NtGdiDdDDIWaitForSynchronizationObjectFromGpu+0x5027
dxgkrnl.sys!NtGdiDdDDICreateAllocation+0xd
ntoskrnl.exe!setjmpex+0x82d8
win32u.dll!NtGdiDdDDICreateAllocation+0x14
GDI32.dll!D3DKMTCreateAllocation+0xf0
d3d9.dll+0x13da4
igdumdim64.dll!GTPIN_IGC_PrepareForGTPin+0xf9f7
igdumdim64.dll!GTPIN_IGC_PrepareForGTPin+0x40c3d
igdumdim64.dll!GTPIN_IGC_PrepareForGTPin+0x43ec0
d3d9.dll+0x1c433
d3d9.dll+0x1bfc9
d3d9.dll+0x35c99
d3d9.dll+0xfff6
d3d9.dll+0xf3fe
d3d9.dll+0xf0e0
wpfgfx_cor3.dll!RenderOptions_IsSoftwareRenderingForcedForProcess+0x554af
wpfgfx_cor3.dll!RenderOptions_IsSoftwareRenderingForcedForProcess+0x730f0
wpfgfx_cor3.dll!RenderOptions_IsSoftwareRenderingForcedForProcess+0x682a5
wpfgfx_cor3.dll!RenderOptions_IsSoftwareRenderingForcedForProcess+0x69b69
wpfgfx_cor3.dll!MILAddRef+0xf236
wpfgfx_cor3.dll!MILAddRef+0xf28a
wpfgfx_cor3.dll!RenderOptions_IsSoftwareRenderingForcedForProcess+0x6f8a4
wpfgfx_cor3.dll!MILAddRef+0xefbe
wpfgfx_cor3.dll!MILAddRef+0xf994
wpfgfx_cor3.dll!MILAddRef+0x7077
wpfgfx_cor3.dll!MILAddRef+0x6f78
wpfgfx_cor3.dll!MILAddRef+0x7719
wpfgfx_cor3.dll!MILAddRef+0x72c4
wpfgfx_cor3.dll!MILAddRef+0x7995
wpfgfx_cor3.dll!MILAddRef+0x7b6c
wpfgfx_cor3.dll!MilUtility_ArcToBezier+0xb698
wpfgfx_cor3.dll!MILAddRef+0x1b904
wpfgfx_cor3.dll!MilContent_DetachFromHwnd+0x505c1
wpfgfx_cor3.dll!MilContent_DetachFromHwnd+0x4ebed
wpfgfx_cor3.dll!MilContent_DetachFromHwnd+0x51f60
wpfgfx_cor3.dll!MilContent_DetachFromHwnd+0x5cbf5
wpfgfx_cor3.dll!MilContent_DetachFromHwnd+0x50d03
wpfgfx_cor3.dll!MilContent_DetachFromHwnd+0x53271
wpfgfx_cor3.dll!MilContent_DetachFromHwnd+0x56186
wpfgfx_cor3.dll!MilContent_DetachFromHwnd+0x5476f
wpfgfx_cor3.dll!MilContent_DetachFromHwnd+0x43cf8
wpfgfx_cor3.dll!MilContent_DetachFromHwnd+0x43b69
wpfgfx_cor3.dll!MilContent_DetachFromHwnd+0x43c7a
wpfgfx_cor3.dll!MilContent_DetachFromHwnd+0xfae
wpfgfx_cor3.dll!MilContent_DetachFromHwnd+0x112f
wpfgfx_cor3.dll!MilContent_DetachFromHwnd+0xe43
KERNEL32.DLL!BaseThreadInitThunk+0x14
ntdll.dll!RtlUserThreadStart+0x21
Also, if you minimize the strategy's window and/or the chart window, the CPU usage will go way down. If you minimize WL8 then CPU usage goes down some more.
The machine is running Windows 10, all updates applied and up-to-date drivers. WL8 build is 35. In chart preferences "Disable Rendering Optimizations" is NOT checked.
The CPU is an Intel I5-4200U (mobile) from circa 2013, and it has 2 cores (4 logical), and runs at 1.6 GHz base. If this issue is occurring on my AMD 5950x machine, I doubt it is noticeable due to the machine's CPU and graphics processing power.
In case the problem is related to DWM then there is this: https://learn.microsoft.com/en-us/windows/win32/dwm/thumbnail-ovw and this https://learn.microsoft.com/en-us/windows/win32/dwm/bestpractices-ovw
In any case, I'm not trying to prove the information given above as right or wrong, just supplying the information in case the WL8 team wants to look at this any further.
We already know that the WPF framework uses some CPU, so the details you provided make sense and it’s interesting to see the fine grained information. But we don’t consider this a problem, it’s expected and normal operation.
The mathematical equation for a Bezier curve is significantly more complex (more fitting terms) than an arc. So if you're evaluating the Bezier curve with the general CPU, this conversion from arc-to-Bezier will significantly slow you down. However, if you have a special GPU graphics processor doing the Bezier rendering, then there should be little speed difference.
If you're encountering this problem, I would replace your graphics video adapter with a higher quality one and be sure to update your video drivers for that new adapter. If you're using a laptop, then you're screwed as far as fast video rendering; they weren't designed for that unless they have a special GPU chip installed (which will shorten your battery life).
If you're encountering this problem, I would replace your graphics video adapter with a higher quality one and be sure to update your video drivers for that new adapter. If you're using a laptop, then you're screwed as far as fast video rendering; they weren't designed for that unless they have a special GPU chip installed (which will shorten your battery life).
Yea, I know. As mentioned, I provided the information in case the WL8 team they wanted to further investigate the issue. I do not need a resolution.
99% of the time, I use my main machine that has an AMD 5950x CPU with an AMD RX6600 video card.
99% of the time, I use my main machine that has an AMD 5950x CPU with an AMD RX6600 video card.
Your Response
Post
Edit Post
Login is required