Could someone show me an example of the proper code structure for GetBarChartCompanion(PriceComponents pc).
Thank you for your help.
CODE:
public override IndicatorBase GetBarChartCompanion(PriceComponents pc)
            {
                get
                {
                    return MyOpen;
                }
            }
Thank you for your help.
Rename
Maybe something like this?
CODE:
public override IndicatorBase GetBarChartCompanion(PriceComponents pc)
        {
            if (PriceComponent == pc)
                return this;
            return MyOpen;
        }
Thank you Eugene, I am trying to construct a bar chart indicator. Can you show me how to link the price components to the proper values so that I get a bar chart? All I get is a straight line for myClose.
public enum PriceComponents
{
Open = 0,
High = 1,
Low = 2,
Close = 3,
public enum PriceComponents
{
Open = 0,
High = 1,
Low = 2,
Close = 3,
It depends on how your indicator works. Assuming your indicator is called MyOpen and it accepts two arguments...
...your GetBarChartCompanion implementation should be like this:
CODE:
public MyOpen(BarHistory source, PriceComponents pc)
...your GetBarChartCompanion implementation should be like this:
CODE:
public override IndicatorBase GetBarChartCompanion(PriceComponents pc)
        {
            if (PriceComponent == pc)
                return this;
            return new MyOpen(Parameters[0].AsBarHistory, pc);
        }
Sorry Eugene but once again I find myself in over my head. I have constructed MyOpen with two arguments but not PriceComponents which would then make three.
Do I some how need to add PriceComponents in this code.
CODE:
//for code based construction
            public Myopen(BarHistory source, Int32 len)
                : base()
            {
                Parameters[0].Value = source;
                Parameters[1].Value = len;

                Populate();
            }
Do I some how need to add PriceComponents in this code.
CODE:
//for code based construction
            public Myopen(BarHistory source, Int32 len, PriceComponents pc)
                : base()
            {
                Parameters[0].Value = source;
                Parameters[1].Value = len;
                Parameters[2].Value = pc;

                Populate();
            }
CODE:
//access price component used
        public PriceComponents PriceComponent => Parameters[2].AsPriceComponent;
Populate() also requires an adjustment dependinng on how your logic works with the PriceComponents
CODE:
public override void Populate()
Don't forget to change the body of the Series method accordingly to reflect the new parameter:
CODE:
//static method
        public static VChart Series(BarHistory source, int len, PriceComponents pc)
        {

...
I made some code changes and it all compiles ok. But when starting WL7 and it initializes indicators it fails to start giving me this error message.
So apparently I am still doing something wrong. In your last post you mention
What I have been doing was to make separate indicators for MyOpen, MyHigh, MyLow, and MyClose and I was thinking that GetBarChartCompanion(PriceComponents pc) was the method to link them together to create the bar chart indicator. Similar to Indicator Companions or BandCompanion.
Also Is this correct way to code PriceComponent in GenerateParameters()
Or just add the enum zero to it? Open = 0,
Once again thank you for your valuable help.
QUOTE:
.MissingMethodException: No parameterless constructor defined for type 'ClassLibraryWL7_Indicators.WealthLab.Indicators.Myopen'
So apparently I am still doing something wrong. In your last post you mention
QUOTE:And this statement is not very clear to me. Should I be doing else?
Don't forget to change the body of the Series method accordingly to reflect the new parameter:
What I have been doing was to make separate indicators for MyOpen, MyHigh, MyLow, and MyClose and I was thinking that GetBarChartCompanion(PriceComponents pc) was the method to link them together to create the bar chart indicator. Similar to Indicator Companions or BandCompanion.
Also Is this correct way to code PriceComponent in GenerateParameters()
CODE:
protected override void GenerateParameters()
            {
                AddParameter("Source", ParameterTypes.BarHistory, null);
                AddParameter("Len", ParameterTypes.Int32, 5);
                AddParameter("pc", ParameterTypes.PriceComponent, "Open");
            }
Or just add the enum zero to it? Open = 0,
Once again thank you for your valuable help.
GenerateParameters should look like this:
Re: .MissingMethodException: No parameterless constructor defined for type 'ClassLibraryWL7_Indicators.WealthLab.Indicators.Myopen'. You should add this:
CODE:
protected override void GenerateParameters()
            {
                AddParameter("Source", ParameterTypes.BarHistory, null);
                AddParameter("Len", ParameterTypes.Int32, 5);
                AddParameter("pc", ParameterTypes.PriceComponent, PriceComponents.Open);
            }
Re: .MissingMethodException: No parameterless constructor defined for type 'ClassLibraryWL7_Indicators.WealthLab.Indicators.Myopen'. You should add this:
CODE:
        //parameterless constructor
        public MyOpen() : base()
        {
        }
Every custom indicator needs two constructors, one parameterless and one with the associated parameters. The parameterless constructor is used to create lightweight instances to populate the indicator list. It’s documented in the Indicator API reference here on site under Support.
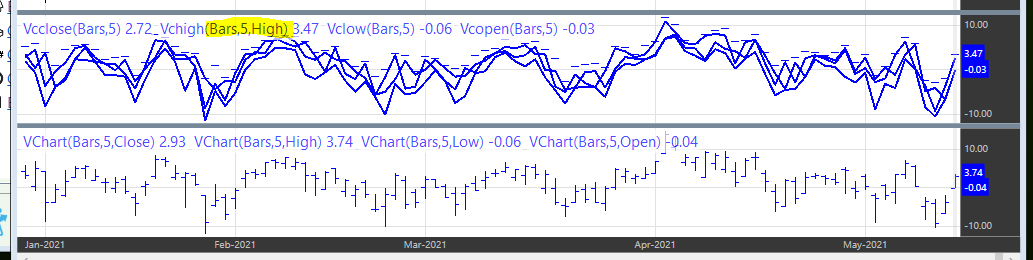
Apparently I had omitted the "parameterless constructor" while performing cut and paste while coding. I am perplexed because I can not find any difference in the code structure of my four indicators but only the high indicator is showing the price component "High". I have noticed that the Vchart indicator that is provided in WL7 has some type of container for all four {O,H,L,C} price components in a single indicator. Can you provide an example how I can code this?
Sure, here's the VChart code in its entirety.
CODE:

using WealthLab.Core;

namespace WealthLab.Indicators
{
    //the VChart indicator
    public class VChart : IndicatorBase
    {
        //parameterless constructor
        public VChart() : base()
        {
        }

        //for code based construction
        public VChart(BarHistory source, int maPeriod, PriceComponents pc)
            : base()
        {
            Parameters[0].Value = source;
            Parameters[1].Value = maPeriod;
            Parameters[2].Value = pc;
            Populate();
        }

        //static method
        public static VChart Series(BarHistory source, int maPeriod, PriceComponents pc)
        {
            string key = CacheKey("VChart", maPeriod, pc);
            if (source.Cache.ContainsKey(key))
                return (VChart)source.Cache[key];
            VChart vchart = new VChart(source, maPeriod, pc);
            source.Cache[key] = vchart;
            return vchart;
        }

        //Name
        public override string Name => "Value Chart";

        //Abbreviation
        public override string Abbreviation => "VChart";

        //description
        public override string HelpDescription => "The Value Charts indicator developed by Mark W. Helweg. Applies a volatility based detrending to the source price component.";

        //pane
        public override string PaneTag => "VChart";

        //access price component used
        public PriceComponents PriceComponent => Parameters[2].AsPriceComponent;

        //default color
        public override System.Drawing.Color DefaultColor => System.Drawing.Color.Blue;

        //default plot style
        public override PlotStyles DefaultPlotStyle => PlotStyles.BarChart;

        //populate
        public override void Populate()
        {
            //get parameter values
            BarHistory source = Parameters[0].AsBarHistory;
            if (source == null)
                return;
            int maPeriod = Parameters[1].AsInt;
            PriceComponents pc = Parameters[2].AsPriceComponent;

            //set datetimes
            DateTimes = source.DateTimes;

            //calculate floating axis
            TimeSeries floatScale = SMA.Series(source.AveragePriceHL, maPeriod);

            //calculate detrended series
            TimeSeries detrended = source.GetPriceComponent(pc) - floatScale;

            //get 5 day range
            TimeSeries range = source.High - source.Low;
            range = SMA.Series(range, maPeriod) * 0.2;

            //create value chart by dividing relative price by volatility unit
            detrended /= range;

            Values = detrended.Values;
        }

        //generate parameters
        protected override void GenerateParameters()
        {
            AddParameter("Source", ParameterTypes.BarHistory, null);
            AddParameter("Period", ParameterTypes.Int32, 5);
            AddParameter("Price Component", ParameterTypes.PriceComponent, PriceComponents.Close);
        }

        //get corresponding bar chart companion indicator
        public override IndicatorBase GetBarChartCompanion(PriceComponents pc)
        {
            if (PriceComponent == pc)
                return this;
            return new VChart(Parameters[0].AsBarHistory, Parameters[1].AsInt, pc);
        }
    }
}
Thank you for the example code. It is going to take me a while to decipher your code and implement it into mine. Any idea why my four indicators do not create a bar chart?
Have you posted the complete code? Without seeing that I wouldn’t be able to say.
Here is the High and Low. They should mirror each other other than High or Low. Let me know if you need the Open and Close.
CODE:

public class Vchigh : IndicatorBase
        {
            //parameterless constructor
            public Vchigh() : base()
            {
            }

            //for code based construction
            public Vchigh(BarHistory source, Int32 len, PriceComponents pc)
                : base()
            {
                Parameters[0].Value = source;
                Parameters[1].Value = len;
                Parameters[2].Value = pc;

                Populate();
            }

            //static Series method
            public static Vchigh Series(BarHistory source, Int32 len, PriceComponents pc)
            {
                return new Vchigh(source, len, pc);
            }

            //name
            public override string Name
            {
                get
                {
                    return "Vchigh";
                }
            }

            //abbreviation
            public override string Abbreviation
            {
                get
                {
                    return "Vchigh";
                }
            }

            //description
            public override string HelpDescription
            {
                get
                {
                    return "Value Charts High";
                }
            }

            //price pane
            public override string PaneTag
            {
                get
                {
                    return "VCpane";
                }
            }

            //default color
            public override Color DefaultColor
            {
                get
                {
                    return Color.FromArgb(255, 0, 0, 255);
                }
            }

            //default plot style
            public override PlotStyles DefaultPlotStyle
            {
                get
                {
                    return PlotStyles.BarChart;
                }
            }

            //access price component used
            public PriceComponents PriceComponent => Parameters[2].AsPriceComponent;
            public override IndicatorBase GetBarChartCompanion(PriceComponents pc)
            {
                if (PriceComponent == pc)
                    return this;
                return new Vchigh(Parameters[0].AsBarHistory, Parameters[1].AsInt, Parameters[2].AsPriceComponent);
            }

            //populate
            public override void Populate()
            {
                BarHistory source = Parameters[0].AsBarHistory;
                Int32 len = Parameters[1].AsInt;
                PriceComponents pc = Parameters[2].AsPriceComponent;

                DateTimes = source.Close.DateTimes;
                //----- Value Charts --------------------------------------
                int NumBars = len;
                int VarNumBars = 0;
                // Insure NumBars is between 2 and 1000
                if (NumBars < 2) VarNumBars = 2;
                if (NumBars > 1000) VarNumBars = 1000;
                if (NumBars >= 2 && NumBars <= 1000) VarNumBars = NumBars;
                int VarP = (int)Math.Round((VarNumBars / 5.0), 0);
                TimeSeries VarA = new TimeSeries(source.DateTimes, 0);
                TimeSeries VarB = new TimeSeries(source.DateTimes, 0);
                TimeSeries VarC = new TimeSeries(source.DateTimes, 0);
                TimeSeries VarD = new TimeSeries(source.DateTimes, 0);
                TimeSeries VarE = new TimeSeries(source.DateTimes, 0);
                TimeSeries Var0 = new TimeSeries(source.DateTimes, 0);
                TimeSeries VarR1 = new TimeSeries(source.DateTimes, 0);
                TimeSeries VarR2 = new TimeSeries(source.DateTimes, 0);
                TimeSeries VarR3 = new TimeSeries(source.DateTimes, 0);
                TimeSeries VarR4 = new TimeSeries(source.DateTimes, 0);
                TimeSeries VarR5 = new TimeSeries(source.DateTimes, 0);
                TimeSeries LRange = new TimeSeries(source.DateTimes, 0);

                //modify the code below to implement your own indicator calculation

                if (VarNumBars > 7)
                {
                    for (int n = 50; n < source.Close.Count; n++)
                    {
                        VarA[n] = Highest.Value(n, source.High, VarP) - Lowest.Value(n, source.Low, VarP);
                        if (VarA[n] == 0 & VarP == 1) VarR1[n] = Math.Abs(source.Close[n] - source.Close[n - VarP]);
                        else VarR1[n] = VarA[n];
                        VarB[n] = Highest.Value(n - (VarP + 1), source.High, VarP) - Lowest.Value(n - VarP, source.Low, VarP);
                        if ((VarB[n] == 0) & (VarP == 1)) VarR2[n] = Math.Abs(source.Close[VarP] - source.Close[VarP * 2]);
                        else VarR2[n] = VarB[n];
                        VarC[n] = Highest.Value(n - VarP * 2, source.High, VarP) - Lowest.Value(n - VarP * 2, source.Low, VarP);
                        if ((VarC[n] == 0) & (VarP == 1)) VarR3[n] = Math.Abs(source.Close[VarP * 2] - source.Close[VarP * 3]);
                        else VarR3[n] = VarC[n];
                        VarD[n] = Highest.Value(n - VarP * 3, source.High, VarP) - Lowest.Value(n - VarP * 3, source.Low, VarP);
                        if ((VarD[n] == 0) & (VarP == 1)) VarR4[n] = Math.Abs(source.Close[VarP * 3] - source.Close[VarP * 4]);
                        else VarR4[n] = VarD[n];
                        VarE[n] = Highest.Value(n - VarP * 4, source.High, VarP) - Lowest.Value(n - VarP * 4, source.Low, VarP);
                        if ((VarE[n] == 0) & (VarP == 1)) VarR5[n] = Math.Abs(source.Close[VarP * 4] - source.Close[VarP * 5]);
                        else VarR5[n] = VarE[n];
                        LRange[n] = ((VarR1[n] + VarR2[n] + VarR3[n] + VarR4[n] + VarR5[n]) / 5) * 0.2;
                    }
                }
                if (VarNumBars <= 7)
                {
                    for (int n = 1; n < source.Close.Count; n++)
                    {
                        if (Math.Abs(source.Close[n] - source.Close[n - 1]) > (source.High[n] - source.Low[n])) Var0[n] = Math.Abs(source.Close[n] - source.Close[n - 1]);
                        else Var0[n] = source.High[n] - source.Low[n];
                        if (source.High[n] == source.Low[n]) Var0[n] = Math.Abs(source.Close[n] - source.Close[n - 1]);
                    }
                    LRange = SMA.Series(Var0, 5) * 0.2;
                }
                //TimeSeries vcOpen = (source.Open - SMA.Series((source.High + source.Low) / 2, NumBars)) / LRange;
                TimeSeries vcHigh = (source.High - SMA.Series((source.High + source.Low) / 2, NumBars)) / LRange;
                //TimeSeries vcLow = (source.Low - SMA.Series((source.High + source.Low) / 2, NumBars)) / LRange;
                //TimeSeries vcClose = (source.Close - SMA.Series((source.High + source.Low) / 2, NumBars)) / LRange;
                //TimeSeries vcSMA5 = SMA.Series(vcClose, 5);
                //vcSMA5.Description = "vcSMA5";

                for (int n = 0; n < source.Close.Count; n++)
                {
                    Values[n] = vcHigh[n];
                }
            }

            //generate parameters
            protected override void GenerateParameters()
            {
                AddParameter("Source", ParameterTypes.BarHistory, null);
                AddParameter("Len", ParameterTypes.Int32, 5);
                AddParameter("pc", ParameterTypes.PriceComponent, PriceComponents.High);
            }
        }
CODE:
public class Vclow : IndicatorBase
        {
            //parameterless constructor
            public Vclow() : base()
            {
            }

            //for code based construction
            public Vclow(BarHistory source, Int32 len, PriceComponents pc)
                : base()
            {
                Parameters[0].Value = source;
                Parameters[1].Value = len;
                Parameters[2].Value = pc;

                Populate();
            }

            //static Series method
            public static Vclow Series(BarHistory source, Int32 len, PriceComponents pc)
            {
                return new Vclow(source, len, pc);
            }

            //name
            public override string Name
            {
                get
                {
                    return "Vclow";
                }
            }

            //abbreviation
            public override string Abbreviation
            {
                get
                {
                    return "Vclow";
                }
            }

            //description
            public override string HelpDescription
            {
                get
                {
                    return "Value Charts Low";
                }
            }

            //price pane
            public override string PaneTag
            {
                get
                {
                    return "VCpane";
                }
            }

            //default color
            public override Color DefaultColor
            {
                get
                {
                    return Color.FromArgb(255, 0, 0, 255);
                }
            }

            //default plot style
            public override PlotStyles DefaultPlotStyle
            {
                get
                {
                    return PlotStyles.BarChart;
                }
            }

            //access price component used
            public PriceComponents PriceComponent => Parameters[2].AsPriceComponent;
            public override IndicatorBase GetBarChartCompanion(PriceComponents pc)
            {
                if (PriceComponent == pc)
                    return this;
                return new Vclow(Parameters[0].AsBarHistory, Parameters[1].AsInt, Parameters[2].AsPriceComponent);
            }

            //populate
            public override void Populate()
            {
                BarHistory source = Parameters[0].AsBarHistory;
                Int32 len = Parameters[1].AsInt;
                PriceComponents pc = Parameters[2].AsPriceComponent;

                DateTimes = source.Close.DateTimes;
                //----- Value Charts --------------------------------------
                int NumBars = len;
                int VarNumBars = 0;
                // Insure NumBars is between 2 and 1000
                if (NumBars < 2) VarNumBars = 2;
                if (NumBars > 1000) VarNumBars = 1000;
                if (NumBars >= 2 && NumBars <= 1000) VarNumBars = NumBars;
                int VarP = (int)Math.Round((VarNumBars / 5.0), 0);
                TimeSeries VarA = new TimeSeries(source.DateTimes, 0);
                TimeSeries VarB = new TimeSeries(source.DateTimes, 0);
                TimeSeries VarC = new TimeSeries(source.DateTimes, 0);
                TimeSeries VarD = new TimeSeries(source.DateTimes, 0);
                TimeSeries VarE = new TimeSeries(source.DateTimes, 0);
                TimeSeries Var0 = new TimeSeries(source.DateTimes, 0);
                TimeSeries VarR1 = new TimeSeries(source.DateTimes, 0);
                TimeSeries VarR2 = new TimeSeries(source.DateTimes, 0);
                TimeSeries VarR3 = new TimeSeries(source.DateTimes, 0);
                TimeSeries VarR4 = new TimeSeries(source.DateTimes, 0);
                TimeSeries VarR5 = new TimeSeries(source.DateTimes, 0);
                TimeSeries LRange = new TimeSeries(source.DateTimes, 0);

                //modify the code below to implement your own indicator calculation

                if (VarNumBars > 7)
                {
                    for (int n = 50; n < source.Close.Count; n++)
                    {
                        VarA[n] = Highest.Value(n, source.High, VarP) - Lowest.Value(n, source.Low, VarP);
                        if (VarA[n] == 0 & VarP == 1) VarR1[n] = Math.Abs(source.Close[n] - source.Close[n - VarP]);
                        else VarR1[n] = VarA[n];
                        VarB[n] = Highest.Value(n - (VarP + 1), source.High, VarP) - Lowest.Value(n - VarP, source.Low, VarP);
                        if ((VarB[n] == 0) & (VarP == 1)) VarR2[n] = Math.Abs(source.Close[VarP] - source.Close[VarP * 2]);
                        else VarR2[n] = VarB[n];
                        VarC[n] = Highest.Value(n - VarP * 2, source.High, VarP) - Lowest.Value(n - VarP * 2, source.Low, VarP);
                        if ((VarC[n] == 0) & (VarP == 1)) VarR3[n] = Math.Abs(source.Close[VarP * 2] - source.Close[VarP * 3]);
                        else VarR3[n] = VarC[n];
                        VarD[n] = Highest.Value(n - VarP * 3, source.High, VarP) - Lowest.Value(n - VarP * 3, source.Low, VarP);
                        if ((VarD[n] == 0) & (VarP == 1)) VarR4[n] = Math.Abs(source.Close[VarP * 3] - source.Close[VarP * 4]);
                        else VarR4[n] = VarD[n];
                        VarE[n] = Highest.Value(n - VarP * 4, source.High, VarP) - Lowest.Value(n - VarP * 4, source.Low, VarP);
                        if ((VarE[n] == 0) & (VarP == 1)) VarR5[n] = Math.Abs(source.Close[VarP * 4] - source.Close[VarP * 5]);
                        else VarR5[n] = VarE[n];
                        LRange[n] = ((VarR1[n] + VarR2[n] + VarR3[n] + VarR4[n] + VarR5[n]) / 5) * 0.2;
                    }
                }
                if (VarNumBars <= 7)
                {
                    for (int n = 1; n < source.Close.Count; n++)
                    {
                        if (Math.Abs(source.Close[n] - source.Close[n - 1]) > (source.High[n] - source.Low[n])) Var0[n] = Math.Abs(source.Close[n] - source.Close[n - 1]);
                        else Var0[n] = source.High[n] - source.Low[n];
                        if (source.High[n] == source.Low[n]) Var0[n] = Math.Abs(source.Close[n] - source.Close[n - 1]);
                    }
                    LRange = SMA.Series(Var0, 5) * 0.2;
                }
                //TimeSeries vcOpen = (source.Open - SMA.Series((source.High + source.Low) / 2, NumBars)) / LRange;
                //TimeSeries vcHigh = (source.High - SMA.Series((source.High + source.Low) / 2, NumBars)) / LRange;
                TimeSeries vcLow = (source.Low - SMA.Series((source.High + source.Low) / 2, NumBars)) / LRange;
                //TimeSeries vcClose = (source.Close - SMA.Series((source.High + source.Low) / 2, NumBars)) / LRange;
                //TimeSeries vcSMA5 = SMA.Series(vcClose, 5);
                //vcSMA5.Description = "vcSMA5";

                for (int n = 0; n < source.Close.Count; n++)
                {
                    Values[n] = vcLow[n];
                }
            }

            //generate parameters
            protected override void GenerateParameters()
            {
                AddParameter("Source", ParameterTypes.BarHistory, null);
                AddParameter("Len", ParameterTypes.Int32, 5);
                AddParameter("pc", ParameterTypes.PriceComponent, PriceComponents.High);
            }
        }
Ok, After posting when reviewing the post I noticed the Low was set to PriceComponents.High I have correct it to Low. Now I am getting this where the High is a line.
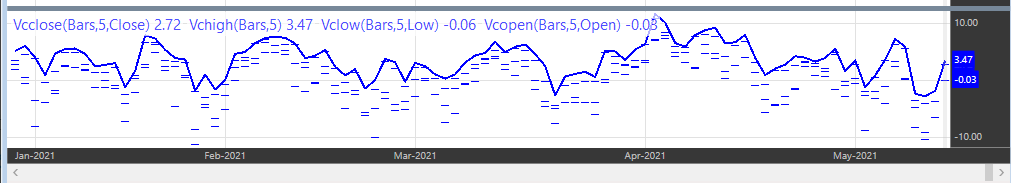
Here's a fixed version, note particularly the changes in GetBarChartCompanion. The problem was you were not passing the correct PriceComponent to the constructors, you were always passing the parameter 2 value.
Incidentally, I don't think you need to have 4 indicators. You could just do it like the VChart code I posted above, calculate a different indicator based on the PriceComponent value. If you have 4 indicators, there's really no point in having a PriceComponent value as a parameter anyway, right? I mean, Vclow will always calculate based on Low, and Vchigh on high, etc.
Vclow:
Vchigh:
Incidentally, I don't think you need to have 4 indicators. You could just do it like the VChart code I posted above, calculate a different indicator based on the PriceComponent value. If you have 4 indicators, there's really no point in having a PriceComponent value as a parameter anyway, right? I mean, Vclow will always calculate based on Low, and Vchigh on high, etc.
Vclow:
CODE:

using System;
using System.Drawing;
using WealthLab.Core;
using WealthLab.Indicators;

public class Vclow : IndicatorBase
{
    //parameterless constructor
    public Vclow() : base()
    {
    }

    //for code based construction
    public Vclow(BarHistory source, Int32 len, PriceComponents pc)
        : base()
    {
        Parameters[0].Value = source;
        Parameters[1].Value = len;
        Parameters[2].Value = pc;

        Populate();
    }

    //static Series method
    public static Vclow Series(BarHistory source, Int32 len, PriceComponents pc)
    {
        return new Vclow(source, len, pc);
    }

    //name
    public override string Name
    {
        get
        {
            return "Vclow";
        }
    }

    //abbreviation
    public override string Abbreviation
    {
        get
        {
            return "Vclow";
        }
    }

    //description
    public override string HelpDescription
    {
        get
        {
            return "Value Charts Low";
        }
    }

    //price pane
    public override string PaneTag
    {
        get
        {
            return "VCpane";
        }
    }

    //default color
    public override Color DefaultColor
    {
        get
        {
            return Color.FromArgb(255, 0, 0, 255);
        }
    }

    //default plot style
    public override PlotStyles DefaultPlotStyle
    {
        get
        {
            return PlotStyles.BarChart;
        }
    }

    //access price component used
    public PriceComponents PriceComponent => Parameters[2].AsPriceComponent;
    public override IndicatorBase GetBarChartCompanion(PriceComponents pc)
    {
        BarHistory bh = Parameters[0].AsBarHistory;
        int period = Parameters[1].AsInt;
        switch(pc)
        {
            case PriceComponents.High:
                return new Vchigh(bh, period, pc);
            case PriceComponents.Open:
                //need to return Vcopen
                return this;
            case PriceComponents.Close:
                //need to return Vcclose
                return this;
            default:
                //it's low
                return this;
        }
    }

    //populate
    public override void Populate()
    {
        BarHistory source = Parameters[0].AsBarHistory;
        if (source == null)
            return;
        Int32 len = Parameters[1].AsInt;
        PriceComponents pc = Parameters[2].AsPriceComponent;

        DateTimes = source.Close.DateTimes;
        //----- Value Charts --------------------------------------
        int NumBars = len;
        int VarNumBars = 0;
        // Insure NumBars is between 2 and 1000
        if (NumBars < 2) VarNumBars = 2;
        if (NumBars > 1000) VarNumBars = 1000;
        if (NumBars >= 2 && NumBars <= 1000) VarNumBars = NumBars;
        int VarP = (int)Math.Round((VarNumBars / 5.0), 0);
        TimeSeries VarA = new TimeSeries(source.DateTimes, 0);
        TimeSeries VarB = new TimeSeries(source.DateTimes, 0);
        TimeSeries VarC = new TimeSeries(source.DateTimes, 0);
        TimeSeries VarD = new TimeSeries(source.DateTimes, 0);
        TimeSeries VarE = new TimeSeries(source.DateTimes, 0);
        TimeSeries Var0 = new TimeSeries(source.DateTimes, 0);
        TimeSeries VarR1 = new TimeSeries(source.DateTimes, 0);
        TimeSeries VarR2 = new TimeSeries(source.DateTimes, 0);
        TimeSeries VarR3 = new TimeSeries(source.DateTimes, 0);
        TimeSeries VarR4 = new TimeSeries(source.DateTimes, 0);
        TimeSeries VarR5 = new TimeSeries(source.DateTimes, 0);
        TimeSeries LRange = new TimeSeries(source.DateTimes, 0);

        //modify the code below to implement your own indicator calculation

        if (VarNumBars > 7)
        {
            for (int n = 50; n < source.Close.Count; n++)
            {
                VarA[n] = Lowest.Value(n, source.Low, VarP) - Lowest.Value(n, source.Low, VarP);
                if (VarA[n] == 0 & VarP == 1) VarR1[n] = Math.Abs(source.Close[n] - source.Close[n - VarP]);
                else VarR1[n] = VarA[n];
                VarB[n] = Lowest.Value(n - (VarP + 1), source.Low, VarP) - Lowest.Value(n - VarP, source.Low, VarP);
                if ((VarB[n] == 0) & (VarP == 1)) VarR2[n] = Math.Abs(source.Close[VarP] - source.Close[VarP * 2]);
                else VarR2[n] = VarB[n];
                VarC[n] = Lowest.Value(n - VarP * 2, source.Low, VarP) - Lowest.Value(n - VarP * 2, source.Low, VarP);
                if ((VarC[n] == 0) & (VarP == 1)) VarR3[n] = Math.Abs(source.Close[VarP * 2] - source.Close[VarP * 3]);
                else VarR3[n] = VarC[n];
                VarD[n] = Lowest.Value(n - VarP * 3, source.Low, VarP) - Lowest.Value(n - VarP * 3, source.Low, VarP);
                if ((VarD[n] == 0) & (VarP == 1)) VarR4[n] = Math.Abs(source.Close[VarP * 3] - source.Close[VarP * 4]);
                else VarR4[n] = VarD[n];
                VarE[n] = Lowest.Value(n - VarP * 4, source.Low, VarP) - Lowest.Value(n - VarP * 4, source.Low, VarP);
                if ((VarE[n] == 0) & (VarP == 1)) VarR5[n] = Math.Abs(source.Close[VarP * 4] - source.Close[VarP * 5]);
                else VarR5[n] = VarE[n];
                LRange[n] = ((VarR1[n] + VarR2[n] + VarR3[n] + VarR4[n] + VarR5[n]) / 5) * 0.2;
            }
        }
        if (VarNumBars <= 7)
        {
            for (int n = 1; n < source.Close.Count; n++)
            {
                if (Math.Abs(source.Close[n] - source.Close[n - 1]) > (source.High[n] - source.Low[n])) Var0[n] = Math.Abs(source.Close[n] - source.Close[n - 1]);
                else Var0[n] = source.High[n] - source.Low[n];
                if (source.High[n] == source.Low[n]) Var0[n] = Math.Abs(source.Close[n] - source.Close[n - 1]);
            }
            LRange = SMA.Series(Var0, 5) * 0.2;
        }
        //TimeSeries vcOpen = (source.Open - SMA.Series((source.High + source.Low) / 2, NumBars)) / LRange;
        //TimeSeries vcHigh = (source.High - SMA.Series((source.High + source.Low) / 2, NumBars)) / LRange;
        TimeSeries vcLow = (source.Low - SMA.Series((source.High + source.Low) / 2, NumBars)) / LRange;
        //TimeSeries vcClose = (source.Close - SMA.Series((source.High + source.Low) / 2, NumBars)) / LRange;
        //TimeSeries vcSMA5 = SMA.Series(vcClose, 5);
        //vcSMA5.Description = "vcSMA5";

        for (int n = 0; n < source.Close.Count; n++)
        {
            Values[n] = vcLow[n];
        }
    }

    //generate parameters
    protected override void GenerateParameters()
    {
        AddParameter("Source", ParameterTypes.BarHistory, null);
        AddParameter("Len", ParameterTypes.Int32, 5);
        AddParameter("pc", ParameterTypes.PriceComponent, PriceComponents.Low);
    }
}
Vchigh:
CODE:

using System;
using System.Drawing;
using WealthLab.Core;
using WealthLab.Indicators;

public class Vchigh : IndicatorBase
{
    //parameterless constructor
    public Vchigh() : base()
    {
    }

    //for code based construction
    public Vchigh(BarHistory source, Int32 len, PriceComponents pc)
        : base()
    {
        Parameters[0].Value = source;
        Parameters[1].Value = len;
        Parameters[2].Value = pc;

        Populate();
    }

    //static Series method
    public static Vchigh Series(BarHistory source, Int32 len, PriceComponents pc)
    {
        return new Vchigh(source, len, pc);
    }

    //name
    public override string Name
    {
        get
        {
            return "Vchigh";
        }
    }

    //abbreviation
    public override string Abbreviation
    {
        get
        {
            return "Vchigh";
        }
    }

    //description
    public override string HelpDescription
    {
        get
        {
            return "Value Charts High";
        }
    }

    //price pane
    public override string PaneTag
    {
        get
        {
            return "VCpane";
        }
    }

    //default color
    public override Color DefaultColor
    {
        get
        {
            return Color.FromArgb(255, 0, 0, 255);
        }
    }

    //default plot style
    public override PlotStyles DefaultPlotStyle
    {
        get
        {
            return PlotStyles.BarChart;
        }
    }

    //access price component used
    public PriceComponents PriceComponent => Parameters[2].AsPriceComponent;
    public override IndicatorBase GetBarChartCompanion(PriceComponents pc)
    {
        BarHistory bh = Parameters[0].AsBarHistory;
        int period = Parameters[1].AsInt;
        switch (pc)
        {
            case PriceComponents.Low:
                return new Vclow(bh, period, pc);
            case PriceComponents.Open:
                //need to return Vcopen
                return this;
            case PriceComponents.Close:
                //need to return Vcclose
                return this;
            default:
                //it's high
                return this;
        }
    }

    //populate
    public override void Populate()
    {
        BarHistory source = Parameters[0].AsBarHistory;
        if (source == null)
            return;
        Int32 len = Parameters[1].AsInt;
        PriceComponents pc = Parameters[2].AsPriceComponent;

        DateTimes = source.Close.DateTimes;
        //----- Value Charts --------------------------------------
        int NumBars = len;
        int VarNumBars = 0;
        // Insure NumBars is between 2 and 1000
        if (NumBars < 2) VarNumBars = 2;
        if (NumBars > 1000) VarNumBars = 1000;
        if (NumBars >= 2 && NumBars <= 1000) VarNumBars = NumBars;
        int VarP = (int)Math.Round((VarNumBars / 5.0), 0);
        TimeSeries VarA = new TimeSeries(source.DateTimes, 0);
        TimeSeries VarB = new TimeSeries(source.DateTimes, 0);
        TimeSeries VarC = new TimeSeries(source.DateTimes, 0);
        TimeSeries VarD = new TimeSeries(source.DateTimes, 0);
        TimeSeries VarE = new TimeSeries(source.DateTimes, 0);
        TimeSeries Var0 = new TimeSeries(source.DateTimes, 0);
        TimeSeries VarR1 = new TimeSeries(source.DateTimes, 0);
        TimeSeries VarR2 = new TimeSeries(source.DateTimes, 0);
        TimeSeries VarR3 = new TimeSeries(source.DateTimes, 0);
        TimeSeries VarR4 = new TimeSeries(source.DateTimes, 0);
        TimeSeries VarR5 = new TimeSeries(source.DateTimes, 0);
        TimeSeries LRange = new TimeSeries(source.DateTimes, 0);

        //modify the code below to implement your own indicator calculation

        if (VarNumBars > 7)
        {
            for (int n = 50; n < source.Close.Count; n++)
            {
                VarA[n] = Highest.Value(n, source.High, VarP) - Lowest.Value(n, source.Low, VarP);
                if (VarA[n] == 0 & VarP == 1) VarR1[n] = Math.Abs(source.Close[n] - source.Close[n - VarP]);
                else VarR1[n] = VarA[n];
                VarB[n] = Highest.Value(n - (VarP + 1), source.High, VarP) - Lowest.Value(n - VarP, source.Low, VarP);
                if ((VarB[n] == 0) & (VarP == 1)) VarR2[n] = Math.Abs(source.Close[VarP] - source.Close[VarP * 2]);
                else VarR2[n] = VarB[n];
                VarC[n] = Highest.Value(n - VarP * 2, source.High, VarP) - Lowest.Value(n - VarP * 2, source.Low, VarP);
                if ((VarC[n] == 0) & (VarP == 1)) VarR3[n] = Math.Abs(source.Close[VarP * 2] - source.Close[VarP * 3]);
                else VarR3[n] = VarC[n];
                VarD[n] = Highest.Value(n - VarP * 3, source.High, VarP) - Lowest.Value(n - VarP * 3, source.Low, VarP);
                if ((VarD[n] == 0) & (VarP == 1)) VarR4[n] = Math.Abs(source.Close[VarP * 3] - source.Close[VarP * 4]);
                else VarR4[n] = VarD[n];
                VarE[n] = Highest.Value(n - VarP * 4, source.High, VarP) - Lowest.Value(n - VarP * 4, source.Low, VarP);
                if ((VarE[n] == 0) & (VarP == 1)) VarR5[n] = Math.Abs(source.Close[VarP * 4] - source.Close[VarP * 5]);
                else VarR5[n] = VarE[n];
                LRange[n] = ((VarR1[n] + VarR2[n] + VarR3[n] + VarR4[n] + VarR5[n]) / 5) * 0.2;
            }
        }
        if (VarNumBars <= 7)
        {
            for (int n = 1; n < source.Close.Count; n++)
            {
                if (Math.Abs(source.Close[n] - source.Close[n - 1]) > (source.High[n] - source.Low[n])) Var0[n] = Math.Abs(source.Close[n] - source.Close[n - 1]);
                else Var0[n] = source.High[n] - source.Low[n];
                if (source.High[n] == source.Low[n]) Var0[n] = Math.Abs(source.Close[n] - source.Close[n - 1]);
            }
            LRange = SMA.Series(Var0, 5) * 0.2;
        }
        //TimeSeries vcOpen = (source.Open - SMA.Series((source.High + source.Low) / 2, NumBars)) / LRange;
        TimeSeries vcHigh = (source.High - SMA.Series((source.High + source.Low) / 2, NumBars)) / LRange;
        //TimeSeries vcLow = (source.Low - SMA.Series((source.High + source.Low) / 2, NumBars)) / LRange;
        //TimeSeries vcClose = (source.Close - SMA.Series((source.High + source.Low) / 2, NumBars)) / LRange;
        //TimeSeries vcSMA5 = SMA.Series(vcClose, 5);
        //vcSMA5.Description = "vcSMA5";

        for (int n = 0; n < source.Close.Count; n++)
        {
            Values[n] = vcHigh[n];
        }
    }

    //generate parameters
    protected override void GenerateParameters()
    {
        AddParameter("Source", ParameterTypes.BarHistory, null);
        AddParameter("Len", ParameterTypes.Int32, 5);
        AddParameter("pc", ParameterTypes.PriceComponent, PriceComponents.High);
    }
}
Your Response
Post
Edit Post
Login is required