I can't figure it out how do make a EMA of a given period using the result of the formula bellow:
(source.Close[n] - source.Close[n - 1]) * source.Volume[n]
This would represente the Force Index Indicator...
(source.Close[n] - source.Close[n - 1]) * source.Volume[n]
This would represente the Force Index Indicator...
Rename
CODE:
var ds = (bars.Close - (bars.Close>>1)) * bars.Volume);
var fi = EMA.Series(ds,period);
Looks like your formula is correct.
https://school.stockcharts.com/doku.php?id=technical_indicators:force_index
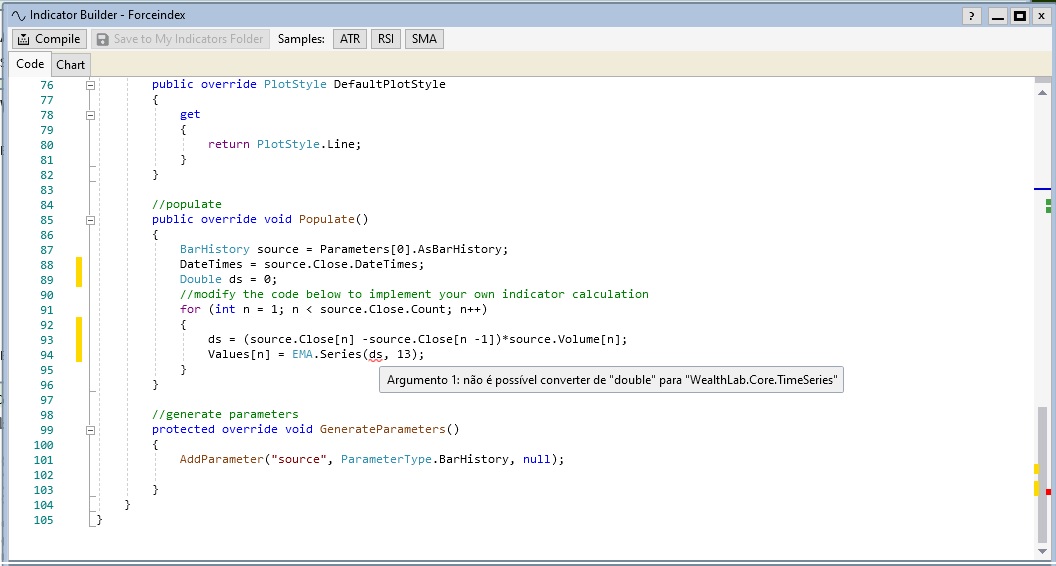
It didn't work... I think I'm still missing something... this is the code:
The snippet above is for plotting an indicator on-the-fly. You didn't tell you were creating a Custom Indicator (C#), this changes things.
CODE:
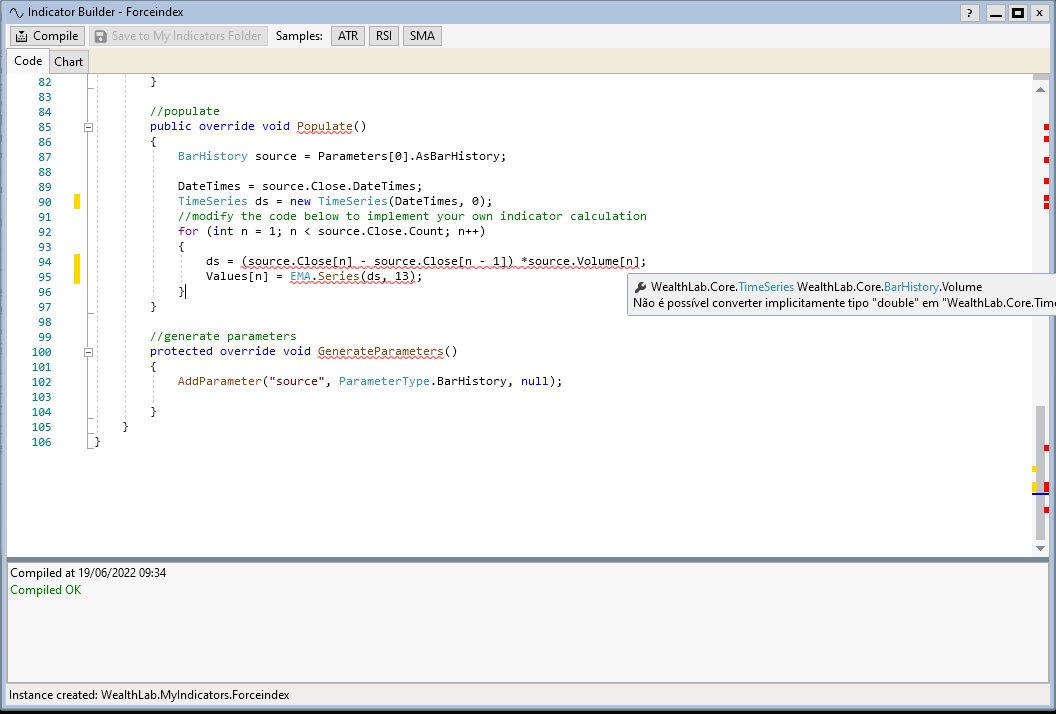
//Double ds = 0; //replace with: TimeSeries ds = new TimeSeries(DateTimes, 0);
Still not working
CODE:
using WealthLab.Core;
using System;
using System.Drawing;
using WealthLab.Indicators;

namespace WealthLab.MyIndicators
{
    public class Forceindex : IndicatorBase
    {
        //parameterless constructor
        public Forceindex() : base()
        {
        }

        //for code based construction
        public Forceindex(BarHistory source)
            : base()
        {
         Parameters[0].Value = source;

            Populate();
        }

      //static Series method
      public static Forceindex Series(BarHistory source)
      {
         return new Forceindex(source);
      }

        //name
        public override string Name
        {
            get
            {
                return "Forceindex";
            }
        }

        //abbreviation
        public override string Abbreviation
        {
            get
            {
                return "Forceindex";
            }
        }

        //description
        public override string HelpDescription
        {
            get
            {
                return "";
            }
        }

        //price pane
        public override string PaneTag
        {
            get
            {
                return "Force index";
            }
        }

      //default color
      public override WLColor DefaultColor
      {
         get
         {
            return WLColor.FromArgb(255,0,0,255);
         }
      }

      //default plot style
      public override PlotStyle DefaultPlotStyle
      {
         get
         {
            return PlotStyle.Line;
         }
      }

        //populate
        public override void Populate()
        {
         BarHistory source = Parameters[0].AsBarHistory;

            DateTimes = source.Close.DateTimes;
         TimeSeries ds = new TimeSeries(DateTimes, 0);
         //modify the code below to implement your own indicator calculation
            for (int n = 1; n < source.Close.Count; n++)
         {
            ds = (source.Close[n] - source.Close[n - 1]) *source.Volume[n];
            Values[n] = EMA.Series(ds, 13);
         }
        }

        //generate parameters
        protected override void GenerateParameters()
        {
         AddParameter("source", ParameterType.BarHistory, null);

        }
    }
}
Replace Populate() with this:
CODE:
      public override void Populate()
      {
         BarHistory source = Parameters[0].AsBarHistory;

         DateTimes = source.Close.DateTimes;
         TimeSeries ds = (source.Close - source.Close>>1) * source.Volume;
         for (int n = 0; n < source.Close.Count; n++)
         {
            Values[n] = EMA.Series(ds, 13)[n];
         }
      }
UPDATE: edited the code to fix a bug.
And maybe expose the lookback parameter; here's complete code:
And maybe expose the lookback parameter; here's complete code:
CODE:
using WealthLab.Core;
using System;
using System.Drawing;
using WealthLab.Indicators;

namespace WealthLab.MyIndicators
{
   public class Forceindex : IndicatorBase
   {
      public Forceindex() : base() { }
      public Forceindex(BarHistory source, int emaPeriod)
         : base()
      {
         Parameters[0].Value = source;
         Parameters[1].Value = emaPeriod;

         Populate();
      }

      public static Forceindex Series(BarHistory source, int emaPeriod) => new Forceindex(source, emaPeriod);
      public override string Name => "Force index";
      public override string Abbreviation => "Forceindex";
      public override string HelpDescription => "Force index";
      public override string PaneTag => "Force index";
      public override WLColor DefaultColor => WLColor.FromArgb(255, 0, 0, 255);
      public override PlotStyle DefaultPlotStyle => PlotStyle.Line;

      //populate
      public override void Populate()
      {
         BarHistory source = Parameters[0].AsBarHistory;
         int emaPeriod = Parameters[1].AsInt;

         DateTimes = source.Close.DateTimes;
         //TimeSeries ds = (source.Close - source.Close>>1) * source.Volume;
         TimeSeries ds = (source.Close - (source.Close>>1)) * source.Volume;
         for (int n = 0; n < source.Close.Count; n++)
         {
            Values[n] = EMA.Series(ds, emaPeriod)[n];
         }
      }

      protected override void GenerateParameters()
      {
         AddParameter("source", ParameterType.BarHistory, null);
         AddParameter("emaPeriod", ParameterType.Int32, 13);
      }
   }
}
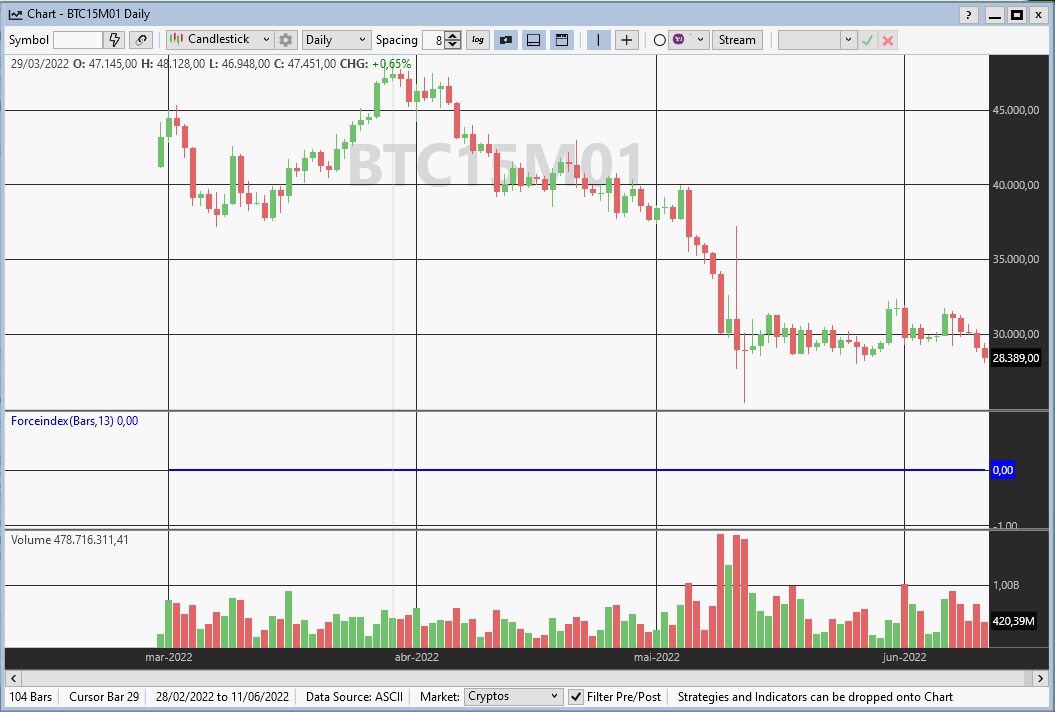
I simply copied and pasted the code and it returned a flat line on the graph.
Looks like some caching issue in WL8. You can try to remane the type globally to e.g. ForceIndex1 and restart WL.

I've changed de indicator's name, more than once, I've changed the Symbol, and even restarted my computer and nothing happened. You can check the last code I used bellow, as well the resulted graph.

CODE:
using WealthLab.Core;
using System;
using System.Drawing;
using WealthLab.Indicators;

namespace WealthLab.MyIndicators
{
    public class Test123 : IndicatorBase
    {
        //parameterless constructor
        public Test123() : base()
        {
        }

        //for code based construction
        public Test123(BarHistory source, Int32 emaperiod)
            : base()
        {
         Parameters[0].Value = source;
         Parameters[1].Value = emaperiod;

            Populate();
        }

      //static Series method
      public static Test123 Series(BarHistory source, Int32 emaperiod)
      {
         return new Test123(source, emaperiod);
      }

        //name
        public override string Name
        {
            get
            {
                return "test123";
            }
        }

        //abbreviation
        public override string Abbreviation
        {
            get
            {
                return "Test123";
            }
        }

        //description
        public override string HelpDescription
        {
            get
            {
                return "";
            }
        }

        //price pane
        public override string PaneTag
        {
            get
            {
                return "test123";
            }
        }

      //default color
      public override WLColor DefaultColor
      {
         get
         {
            return WLColor.FromArgb(255,0,0,255);
         }
      }

      //default plot style
      public override PlotStyle DefaultPlotStyle
      {
         get
         {
            return PlotStyle.Line;
         }
      }

      //populate
      public override void Populate()
      {
         BarHistory source = Parameters[0].AsBarHistory;
         int emaPeriod = Parameters[1].AsInt;

         DateTimes = source.Close.DateTimes;
         TimeSeries ds = (source.Close - source.Close >>1) * source.Volume;
         for (int n = 0; n < source.Close.Count; n++)
         {
            Values[n] = EMA.Series(ds, emaPeriod)[n];
         }
      }

        //generate parameters
        protected override void GenerateParameters()
        {
         AddParameter("source", ParameterType.BarHistory, null);
         AddParameter("emaPeriod", ParameterType.Int32, 13);

        }
    }
}
I spotted a subtle bug in my code. The parentheses do matter:
This should work:
CODE:
//TimeSeries ds = EMA.Series( (source.Close - source.Close >>1) * source.Volume, emaPeriod);
TimeSeries ds = EMA.Series( (source.Close - (source.Close >>1)) * source.Volume, emaPeriod);
This should work:
CODE:
using WealthLab.Core;
using System;
using System.Drawing;
using WealthLab.Indicators;

namespace WealthLab.MyIndicators
{
   public class Forceindex : IndicatorBase
   {
      public Forceindex() : base() { }
      public Forceindex(BarHistory source, int emaPeriod)
         : base()
      {
         Parameters[0].Value = source;
         Parameters[1].Value = emaPeriod;

         Populate();
      }

      public static Forceindex Series(BarHistory source, int emaPeriod) => new Forceindex(source, emaPeriod);
      public override string Name => "Force index";
      public override string Abbreviation => "Forceindex";
      public override string HelpDescription => "Force index";
      public override string PaneTag => "Force index";
      public override WLColor DefaultColor => WLColor.FromArgb(255, 0, 0, 255);
      public override PlotStyle DefaultPlotStyle => PlotStyle.Line;

      //populate
      public override void Populate()
      {
         BarHistory source = Parameters[0].AsBarHistory;
         int emaPeriod = Parameters[1].AsInt;

         DateTimes = source.Close.DateTimes;
         TimeSeries ds = EMA.Series( (source.Close - (source.Close >>1)) * source.Volume, emaPeriod);
         Values = ds.Values;
      }

      protected override void GenerateParameters()
      {
         AddParameter("source", ParameterType.BarHistory, null);
         AddParameter("emaPeriod", ParameterType.Int32, 13);
      }
   }
}
I have a weird question. If the EMA and "this" (or "base") are both indicators, then why can't you replace ... or can you?
or maybe ...
I guess the answer depends on the IndicatorBase constructor and whether or not it will allocate memory (with the "new" operator) and initialize all the data structures.
CODE:
         //DateTimes = source.Close.DateTimes;
         //TimeSeries ds = EMA.Series( (source.Close - (source.Close>>1)) * source.Volume, emaPeriod);
         //Values = ds.Values;

         this = new EMA( (source.Close - (source.Close>>1)) * source.Volume, emaPeriod);
or maybe ...
CODE:
         base = EMA( (source.Close - (source.Close>>1)) * source.Volume, emaPeriod);
I guess the answer depends on the IndicatorBase constructor and whether or not it will allocate memory (with the "new" operator) and initialize all the data structures.
In C#, "this" refers to the instance of the object you're working on, and the language doesn't allow you to assign it for reference types. "base" allows you to reference members of the ancestor class, maybe because you overrode a method in your class and want to call the version in the base class, so it doesn't make sense to assign a value to "base".
QUOTE:
... "this" refers to the instance of the object you're working on, and the language doesn't allow you to assign it for reference types.
Well, I appreciate you need a "new" operator in there somewhere to allocate storage for the new "this" object. We want a new object with storage and not simply assign a reference without storage. So it sounds like one can't make this work in C#.
It worked!!
Thank you very much Eugene!
Thank you very much Eugene!
Your Response
Post
Edit Post
Login is required