I need help converting this WL6 code to WL7:
CODE:
   public class FillSeriesWithColor
   {
      WealthScript obj;
      private int bar;
      private double Value, PrevValue;

      public void FillSeries( WealthScript obj, ChartPane Pane,  DataSeries ds,
         double Level, bool bAboveLevel, Color fillClr, bool bBehindBars )
      {
         PrevValue = ds[0];
         for( bar = obj.Bars.FirstActualBar + 1; bar < obj.Bars.Count; bar++ )
         {
            Value = ds[bar];
            double[] rectangle = { bar-1, PrevValue, bar-1, Level, bar, Level, bar, Value };
            if( ( bAboveLevel && Value >= Level && PrevValue >= Level )
               || (!bAboveLevel && Value <= Level && PrevValue <= Level ) )
               obj.DrawPolygon( Pane, fillClr, fillClr, LineStyle.Solid, 1, bBehindBars, rectangle );
            PrevValue = Value;
         }
      }
   }
Rename
See the QuickRef entry for DrawPolygon. One more example:
Hope this helps you translate your code.
CODE:
using WealthLab.Backtest;
using System;
using WealthLab.Core;
using WealthLab.Indicators;
using System.Drawing;
using System.Collections.Generic;

namespace WealthScript1
{
   public class ChartPoint : IChartPoint
   {
      public int XIndex { get; set; }
      public double YValue { get; set; }

      public ChartPoint(int x, Double y)
      {
         XIndex = x; YValue = y;
      }
   }

   public class MyStrategy : UserStrategyBase
    {
        public override void Initialize(BarHistory bars)
        {
        }

        public override void Execute(BarHistory bars, int idx)
        {
         if (idx == bars.Count-1 && bars.Count > 10)
         {
            int b1 = idx -10, b2 = idx;
            double p1 = bars.High[b1], p2 = bars.High[idx];

            double[] rectangle = { b1, p1, b1, p2, b2, p2, b2, p1 };
            List<IChartPoint> points = new List<IChartPoint>()
            {
               new ChartPoint(b1, p1),
               new ChartPoint(b1, p2),
               new ChartPoint(b2, p2),
               new ChartPoint(b2, p1)
            };

            Color line = Color.Blue, fill = Color.FromArgb(20,Color.Blue);

            DrawPolygon(points, line, 1, LineStyles.Solid);
            FillPolygon(points, fill);
         }
      }
    }
}
Hope this helps you translate your code.
This looks like an old workaround that was used before PlotSeriesOscillator became available in v6.9.
PlotTimeSeriesOscillator and PlotIndicatorOscillator are ready for Build 7, coming soon.
PlotTimeSeriesOscillator and PlotIndicatorOscillator are ready for Build 7, coming soon.
@Eugene,
Thank you! Let me study it and see how to incorporate into my series.
@Cone,
That's good news! Kindly consider adding Gradient fills (gradient blocks are not quite the same).
And yes, my version is based on one posted by gbeltrame (remember him?) - I added the ability to plot it in front of or behind bars. And it has stood the test of time and hence I continue to use it lol.
A sneak peek of PlotTimeSeriesOscillator in Build 7:
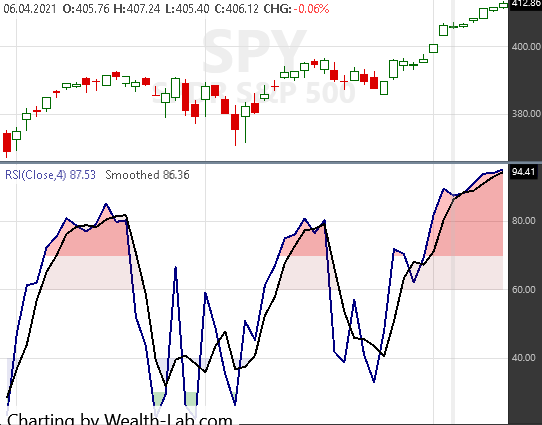
Cool!
So I created my custom indicator:
Here's a sample plot of Year-to-Date Change series which has been filled in:
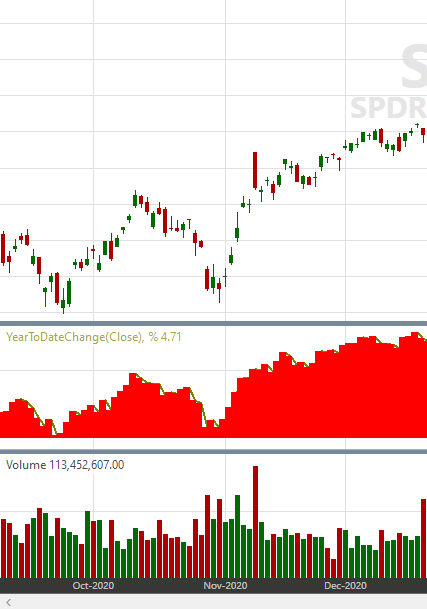
Issues:
1) The edges are jagged, not smooth.
2) There's an unsightly gap between the plotted series and the fill.
These issues were non-existent in WL6.
How to resolve?
CODE:
using WealthLab.Backtest;
using System;
using WealthLab.Core;
using WealthLab.Indicators;
using System.Drawing;
using System.Collections.Generic;

namespace WealthScript7
{
   public class ChartPoint : IChartPoint
   {
      public int XIndex { get; set; }
      public double YValue { get; set; }

      public ChartPoint(int x, Double y)
      {
         XIndex = x; YValue = y;
      }
   }

   public class FillSeriesWithColor
   {
      UserStrategyBase obj;
      private BarHistory bars;
      private int bar, idx;
      private double Value, PrevValue;

      public void FillSeries(UserStrategyBase obj, TimeSeries ts, double Level, bool bAboveLevel, Color fillClr, string pane)
      {
         PrevValue = ts[0];
         for (bar = ts.FirstValidIndex + 1; bar < ts.Count; bar++)
         {
            Value = ts[bar];
            if (bAboveLevel && Value >= Level && PrevValue >= Level)
            {
               List<IChartPoint> points = new List<IChartPoint>()
               {
                  new ChartPoint(bar -1, Math.Min(PrevValue, Level)),
                  new ChartPoint(bar -1, Value),
                  new ChartPoint(bar, Value),
                  new ChartPoint(bar, Math.Min(PrevValue, Level))
               };
               obj.DrawPolygon(points, fillClr, 1, LineStyles.Solid, pane);
               obj.FillPolygon(points, fillClr, pane);
            }
            if (!bAboveLevel && Value <= Level && PrevValue <= Level)
            {
               List<IChartPoint> points = new List<IChartPoint>()
               {
                  new ChartPoint(bar -1, Math.Max(PrevValue, Level)),
                  new ChartPoint(bar -1, Value),
                  new ChartPoint(bar, Value),
                  new ChartPoint(bar, Math.Max(PrevValue, Level))
               };
               obj.DrawPolygon(points, fillClr, 1, LineStyles.Solid, pane);
               obj.FillPolygon(points, fillClr, pane);
            }
            PrevValue = Value;
         }
      }
   }


   public class MyStrategy : UserStrategyBase
    {
        //create indicators and other objects here, this is executed prior to the main trading loop
        public override void Initialize(BarHistory bars)
        {
         FillSeriesWithColor fs = new FillSeriesWithColor();
         TimeSeries cls = bars.Close;

         //Year to Date Change
         TimeSeries YTD = bars.Close.ReturnYTD();
         PlotTimeSeries(YTD, "YearToDateChange(" + cls.Description + "), %", "pYTD", Color.Olive, PlotStyles.Line, false);
         fs.FillSeries(this, YTD, 0, true, Color.Red, "pYTD");

      }

        //execute the strategy rules here, this is executed once for each bar in the backtest history
        public override void Execute(BarHistory bars, int idx)
        {
            if (!HasOpenPosition(bars, PositionType.Long))
            {
                //code your buy conditions here
            }
            else
            {
                //code your sell conditions here
            }
        }

        //declare private variables below

    }
}
Here's a sample plot of Year-to-Date Change series which has been filled in:
Issues:
1) The edges are jagged, not smooth.
2) There's an unsightly gap between the plotted series and the fill.
These issues were non-existent in WL6.
How to resolve?
QUOTE:Even on the surface, this is clearly an error in your code. If you draw a rectangle, you'll get rectangles instead of polygons.
These issue were non-existent in WL6
Here's the section of code to replace with a correction, and, you have to make the same correction for the "below" part.
CODE:
         for (bar = ts.FirstValidIndex + 1; bar < ts.Count; bar++)
         {
            Value = ts[bar];
            Value1 = ts[bar-1];
            if (bAboveLevel && Value >= Level && PrevValue >= Level)
            {
               List<IChartPoint> points = new List<IChartPoint>()
               {
                 new ChartPoint(bar -1, Math.Min(PrevValue, Level)),
                 new ChartPoint(bar -1, Value1),
Thank you!!
A request:
Please bring back the (bool behindBars) parameter in the drawn objects (polygon, circle, etc.), was really useful.
A request:
Please bring back the (bool behindBars) parameter in the drawn objects (polygon, circle, etc.), was really useful.
You're welcome. Okay, I'll add that to the wish list.
Your Response
Post
Edit Post
Login is required