Hello!
I am using the PlotBarHistory function to draw hourly candles on a 1 minute chart. I want the candles to be colored depending on whether they are rising or falling in green and red, respectively.
To do this, I tried to get red and green candles separately and draw them separately. However, PlotBarHistory ignores the timestamps in the BarHistory and draws everything without spaces, even if there are any in the timestamps.
Can you please tell me how I can achieve my goal without manually drawing candles using functions like DrawLine?
Rename
Leave the WLColor parameter null.
Probably for this case it would be better (less distracting) to write a little routine to draw the candle yourself on the last bar of the hour.
Probably for this case it would be better (less distracting) to write a little routine to draw the candle yourself on the last bar of the hour.
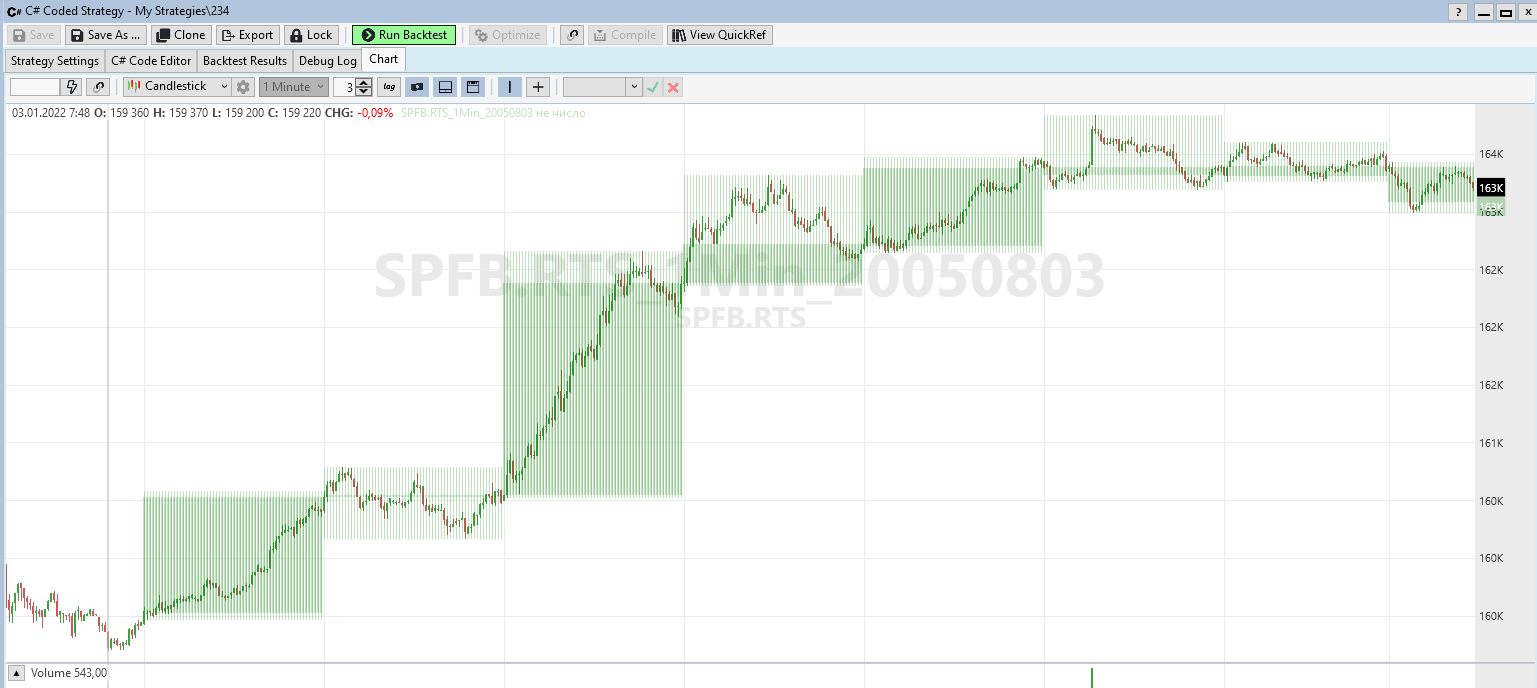
If you're just bracketing the candles with a high/low range, then just use PlotIndicatorBands(...).
CODE:You can play with the color opacity and superimpose plots with PlotIndicatorCloud as well, but that could get messy. Keep it simple.
public override void Initialize(BarHistory bars) { IndicatorBase high = new Highest(bars.High, 60); IndicatorBase low = new Lowest(bars.Low, 60); PlotIndicatorBands(high, low, WLColor.LightGreen, 0, 20); }
Here's an idea that I don't really like, but someone else might.
This plots the scaled bar only once on top of the base scale. The triangle points to the low of the bar in the base scale, and also indicates that it's a bar in a higher scale.
This plots the scaled bar only once on top of the base scale. The triangle points to the low of the bar in the base scale, and also indicates that it's a bar in a higher scale.
CODE:
using WealthLab.Backtest; using WealthLab.Core; using System.Drawing; namespace WealthScript3 { public class MyStrategy123 : UserStrategyBase { public override void Initialize(BarHistory bars) { BarHistory hourly = BarHistoryCompressor.ToMinute(bars, 60); PlotScaledBars(hourly, bars); // use the sync'd reference in the script _hourlySync = BarHistorySynchronizer.Synchronize(hourly, bars); } public override void Execute(BarHistory bars, int idx) { double lasthourHigh = _hourlySync.High[idx]; } // synchronizes the scaled bars for plotting public void PlotScaledBars(BarHistory scaledBH, BarHistory master) { //make a new Bar History just for plotting BarHistory plotter = new BarHistory(scaledBH); int n = 0; for (int k = 0; k < scaledBH.Count; k++) { int syncbar = master.IndexOf(scaledBH.DateTimes[k]); while (n < syncbar) { plotter.Add(master.DateTimes[n], double.NaN, double.NaN, double.NaN, double.NaN, double.NaN); n++; } plotter.Add(scaledBH.DateTimes[k], scaledBH.Open[k], scaledBH.High[k], scaledBH.Low[k], scaledBH.Close[k], scaledBH.Volume[k]); DrawBarAnnotation(TextShape.TriangleUp, n, false, WLColor.Cyan, 14); n++; } PlotBarHistory(plotter, "Price"); } BarHistory _hourlySync; } }
QUOTE:
Leave the WLColor parameter null.
I tried to draw hourly candles with "null" color. Candles are multicolored. But they cover minute candles. Then I tried to draw minute candles on top of hourly candles. It has become better, but candles of the same color merge with each other: green hourly candles with green minute candles, red hourly candles with red minute candles.
Of course, I could draw them on another panel, but I need all the candles to be on one panel.
I wish there was an opportunity to make hourly candles translucent.
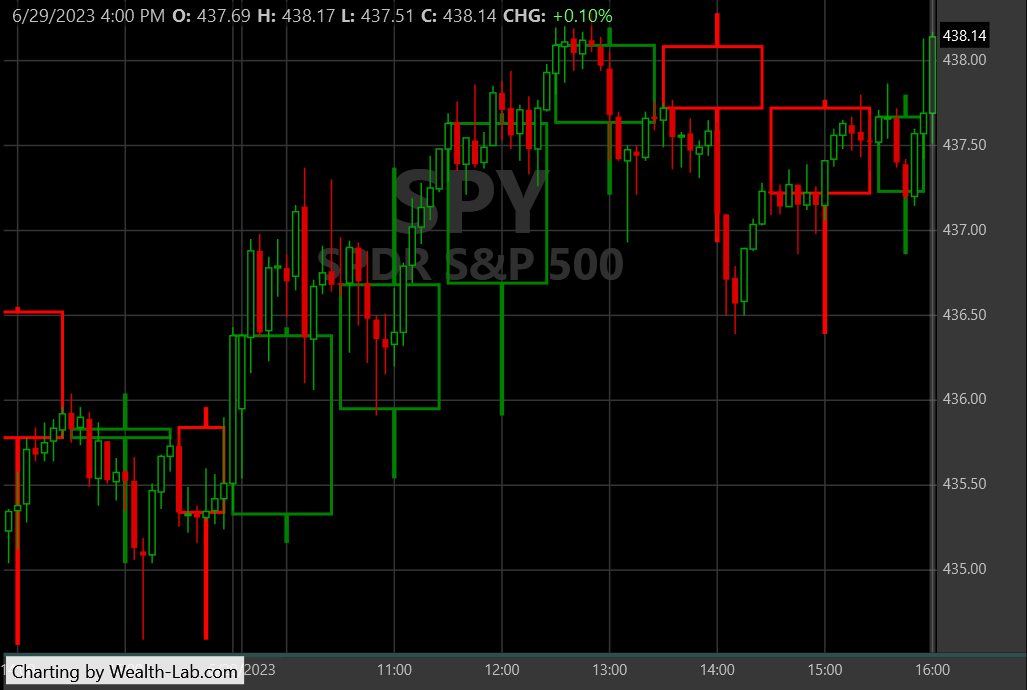
Try this one - it gets them all except the last one. An advantage to using the Draw* methods is that you can put it behind the bars too.
CODE:
using WealthLab.Backtest; using WealthLab.Core; using System.Drawing; namespace WealthScript3 { public class MyStrategy123 : UserStrategyBase { public override void Initialize(BarHistory bars) { BarHistory hourly = BarHistoryCompressor.ToMinute(bars, 60); DrawScaledBars(hourly, bars); // use the sync'd reference in the script _hourlySync = BarHistorySynchronizer.Synchronize(hourly, bars); } public override void Execute(BarHistory bars, int idx) { double lasthourHigh = _hourlySync.High[idx]; } // Draw a wide, extended candle public void DrawScaledBars(BarHistory scaledBH, BarHistory master) { int n = 0; BarData bdLast = new BarData(scaledBH, 0); for (int k = 1; k < scaledBH.Count; k++) { int syncbar = master.IndexOf(scaledBH.DateTimes[k]); BarData barData = new BarData(scaledBH, k); WLColor clr = bdLast.Close >= bdLast.Open ? WLColor.Green : WLColor.Red; int ctrBar = n + (syncbar - n) / 2; DrawRectangle(n, bdLast.Open, syncbar - 1, bdLast.Close, clr, 2, behindBars: true); double b = bdLast.Close >= bdLast.Open ? bdLast.Open : bdLast.Close; double t = bdLast.Close >= bdLast.Open ? bdLast.Close : bdLast.Open; DrawLine(ctrBar, b, ctrBar, bdLast.Low, clr, 3, behindBars: true); DrawLine(ctrBar, t, ctrBar, bdLast.High, clr, 3, behindBars: true); n = syncbar; bdLast = barData; } } BarHistory _hourlySync; } }
QUOTE:
If you're just bracketing the candles with a high/low range, then just use PlotIndicatorBands(...).
CODE:
        public override void Initialize(BarHistory bars)
        {
         IndicatorBase high = new Highest(bars.High, 60);
         IndicatorBase low = new Lowest(bars.Low, 60);
         PlotIndicatorBands(high, low, WLColor.LightGreen, 0, 20);
        }
You can play with the color opacity and superimpose plots with PlotIndicatorCloud as well, but that could get messy. Keep it simple.
Hello, Superticker!
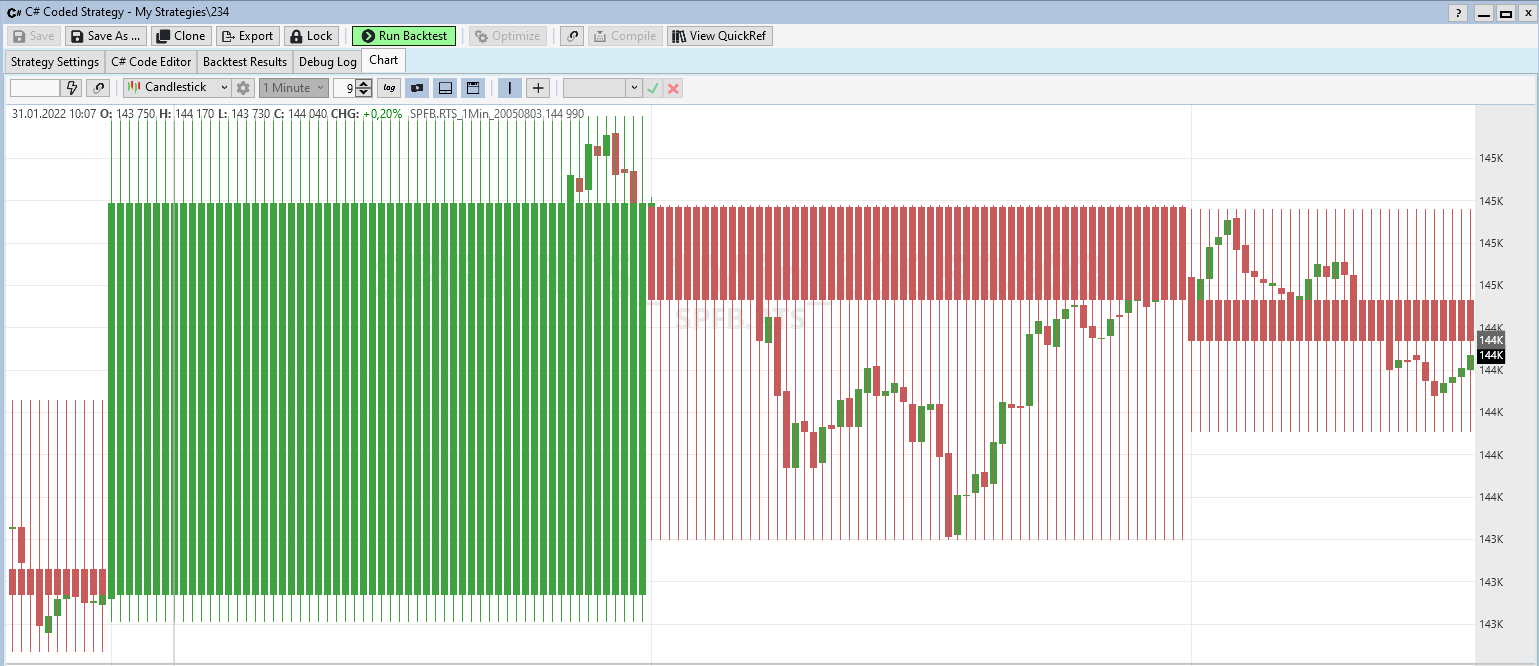
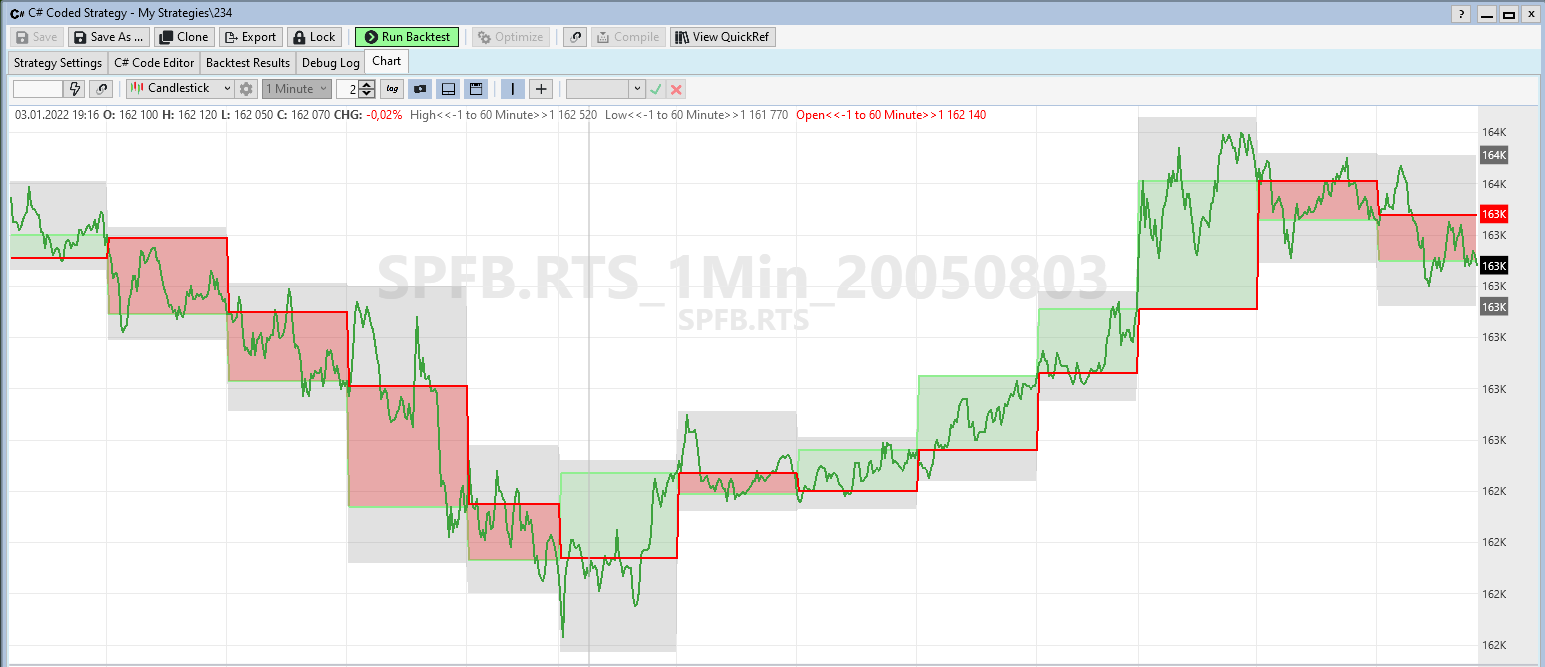
I tried to use "PlotIndicatorBands" and "PlotIndicatorCloud" functions. I liked the result.
Thanks for the help.
CODE:

indicatorOpen =new OffsetInd(bars, new ScaledInd(bars,new OffsetInd(bars,new TimeSeriesIndicatorWrapper(bars.Open),-1),
HistoryScale.Minute60),1);
indicatorHigh= new OffsetInd(bars,new ScaledInd(bars, new OffsetInd(bars, new TimeSeriesIndicatorWrapper(bars.High),-1),
HistoryScale.Minute60),1);
indicatorLow = new OffsetInd(bars,new ScaledInd(bars, new OffsetInd(bars, new TimeSeriesIndicatorWrapper(bars.Low),-1),
HistoryScale.Minute60),1);
indicatorClose = new OffsetInd(bars,new ScaledInd(bars, new OffsetInd(bars, new TimeSeriesIndicatorWrapper(bars.Close),-1),
HistoryScale.Minute60),1);

PlotIndicatorBands(indicatorHigh, indicatorLow, WLColor.LightGray, 0, 20,false,"Price");

PlotIndicatorCloud(indicatorOpen,indicatorClose, WLColor.Red, WLColor.LightGreen, 2,LineStyle.Solid,25,false,"Price");
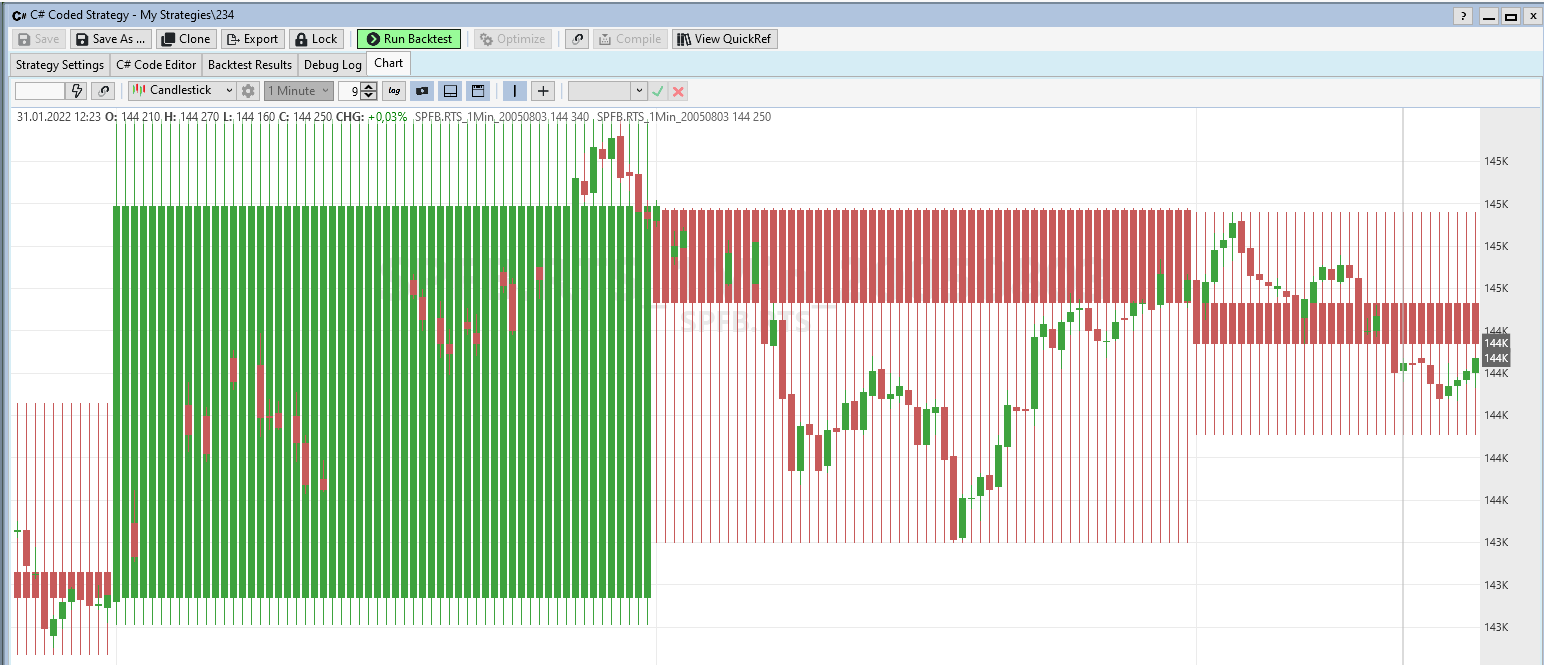
This is the way.
It's definitely the way to peek.
Just get rid of the OffsetInd part.
Just get rid of the OffsetInd part.
QUOTE:
Try this one - it gets them all except the last one. An advantage to using the Draw* methods is that you can put it behind the bars too.
Hello Cone!
Your implementation looks pretty. However, during the test, I came across the fact that candles are drawn only for about the last 14 months, while I want to watch more than 10 years. Apparently there is some limit on drawing lines and other shapes in WL8.
Is there any way to increase this limit?
As for peeping, I understand everything and take this into account in the analysis. Of course, you cannot look at the High, Low and Close values before the hour is over. However, I do not really understand why I have to shift the chart not only an hour ago, but also a minute ahead in order to get a complete match between the two charts (minute and hour). Where does this minute come from?
Thanks for the help.
QUOTE:It's true. As an optimization only the last 10,000 drawing objects are plotted (which is about 3,333 hours since each candle is 3 drawings). Usually that's quite enough!
Apparently there is some limit on drawing lines and other shapes in WL8.
If you're interested to see this further back in the history, it's easy to adjust the date range to end at that point so you don't have to scroll back so far.
Re: shifting
You don't have to shift at all, just use this instead for the other method - look, no peeking! (pun intended)
CODE:
            indicatorOpen = new ScaledInd(bars, new TimeSeriesIndicatorWrapper(bars.Open), HistoryScale.Minute60);
            indicatorHigh = new ScaledInd(bars, new TimeSeriesIndicatorWrapper(bars.High), HistoryScale.Minute60);
            indicatorLow = new ScaledInd(bars, new TimeSeriesIndicatorWrapper(bars.Low), HistoryScale.Minute60);
            indicatorClose = new ScaledInd(bars, new TimeSeriesIndicatorWrapper(bars.Close), HistoryScale.Minute60);
Your Response
Post
Edit Post
Login is required