Hopefully I can provide useful information. This type of error occurs with different strategies. To report the issue, I chose the "OneNight" strategy as shown below. The equity curve jumps up unexpectedly. The figures shown are the values from WL supplemented with a column with the profit balance.
Please let me know if you need more information to follow up.


I removed image 4 because the information did not belong to the backtest i discuss (sorry for the confusion)
Please let me know if you need more information to follow up.
I removed image 4 because the information did not belong to the backtest i discuss (sorry for the confusion)
Rename
Looks to me like a bad Datapoint, just look at the positions sort them and find the one whats causing it. Then use the data manager to correct the issue. often, reloading the data for the problem symbol fixes it too.
The positions are already sorted by entry date and there is (should be) maximum one trade at a time because of 100% position sizing. (This happens too if there is a different setting for pos sizing).
I have chosen a familiar strategy so that you can quickly reproduce the process on your site. Please do so.
This always occurs. The time span can also be increased from 3 years to 5 or 10.
I used the latest WealthLab data.
I have chosen a familiar strategy so that you can quickly reproduce the process on your site. Please do so.
This always occurs. The time span can also be increased from 3 years to 5 or 10.
I used the latest WealthLab data.
I did so. And it's not occurring for me. Like I said earlier, it looks like a data error. Please attempt to locate the erroneous data point. I suggested sorting the positions by profit % to find the offending one.
Ok. I did so and i ask you what should i find what i did not already have found?

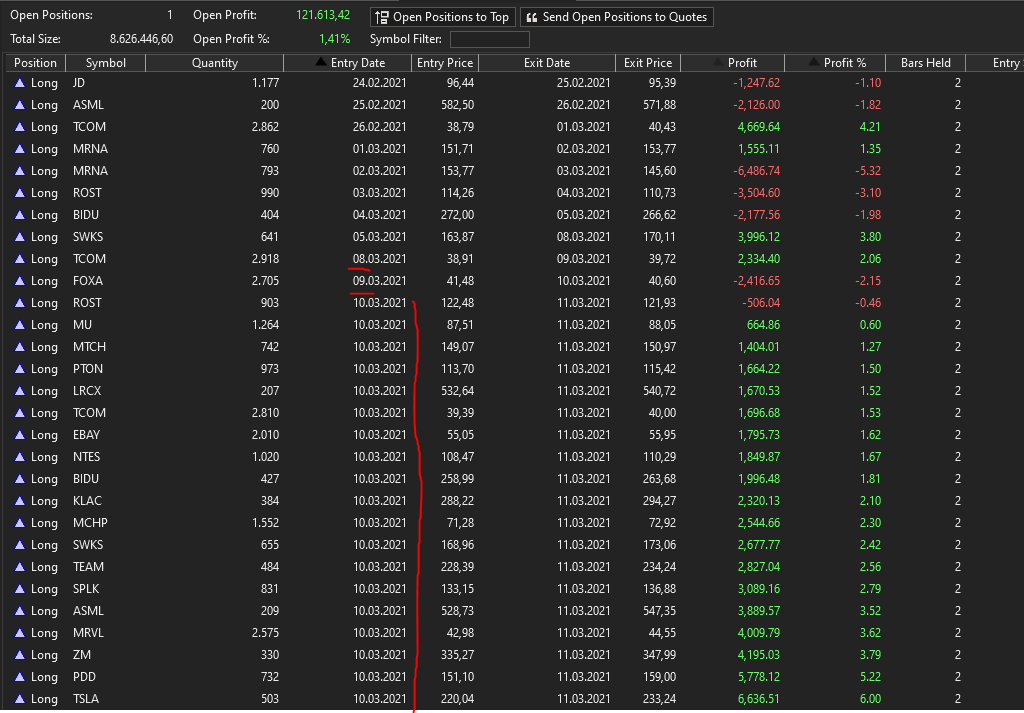
If you look at the first post you can see that the equity curve jumps from 08.03. to 09.03. Directly after these date there are executed a bunch of trades on the same date (10.03) as you can see in the position listing below. After that day the equity has exploded which can be seen for the next trades where the number of shares is extremley high.
1. How can that be with 100% position sizing? (but this happens too with lower %)
From this point/date/trades something goes wrong. I can not figure out something special with the data points from 08.03. to 15.03. But for sure, there is the problem, obviously.
That you are not able to reproduce the errors is amazing. I can produce this error type at anytime with different data and strategies and settings. I wonder what we do differently.
Maybe the backtest settings play a role. Here they are attached to my last post.

Try reloading all of your wealth data by right clicking in the historical provider in the data manager and selecting the refresh option. if it keeps occurring after that write support@wealth-lab.com so we can schedule a zoom session to troubleshoot.
Ok, i will contact you. Thanks.
Also try with futures mode off to see if its not some incorrect setting in your Symbols tool.
I am speechless. It is gone and i have no clue what changed. As you suggested i simply did (another) update for the data. The last one was shortly before i opened the discussion.
The only shot in the dark is that I did the first update when I had a second instance of WL running. I hope it was really just a data problem.
I'll keep an eye on it and if I notice anything I'll bring it up again.
Thanks a lot for now.
The only shot in the dark is that I did the first update when I had a second instance of WL running. I hope it was really just a data problem.
I'll keep an eye on it and if I notice anything I'll bring it up again.
Thanks a lot for now.
I don’t believe the strategy uses a Transaction weight, so the results will change each time you run it. Perhaps this time you didn’t get the corrupted symbol included?
try the data manager data integrity checker for the NASDAQ 100 data set.
try the data manager data integrity checker for the NASDAQ 100 data set.
Ok, I will do that in the next two days. I have to go to bed now.
Unfortunately here with a different strategy and the SP500 the same issue. It "feels" like there is something with the position sizer. If you look at the settings (95%), actually only one position can occur at a time. The symptoms are as above.


I will have a closer look at the data as soon as possible. Even if i do not produce 1:1 backtest (which would be managable of course), there are the same symptoms.
Until the next days.
Unfortunately here with a different strategy and the SP500 the same issue. It "feels" like there is something with the position sizer. If you look at the settings (95%), actually only one position can occur at a time. The symptoms are as above.
I will have a closer look at the data as soon as possible. Even if i do not produce 1:1 backtest (which would be managable of course), there are the same symptoms.
Until the next days.
I still think it’s a data issue. The position sizing has been exhaustively tested and i’ve never seen this kind of symptom other than some bad data somewhere. you know what they say: GIGO.
Sort the Position returns to find the largest gains, then double-click to see the chart - the data error will be obvious I would think.
Hello Cone, thanks for your suggestion. I did it after you suggested it and when Glitch suggested it. Believe me, i already did it before i opened the discussion. I was not able to spot a single data point with unusual output.
That is why i checked the equity curve for the date when the breakout occured. Then i sorted it by date to check the datapoints on that point and around that point (includes looking at the charts). I can not exclude that there is broken data, but i certainly found something else.
This is an EOD strategy with maximum one trade a day because the position sizer uses 100% (used 95% also). Just some minutes before, i did another test with the OneNight strategy and WL Nasdaq data with the same error.
1. Number of trades (more than one)
Please look at the fact that there are days including more than one trade. This effects the equity curve of course, but i can not explain to me how this behaviour can be triggered by a broken data point. With 100% position sizing the equity should not influence the number of trades. Of course, the other way around, more trades will effect the equity curve. This is at least one point that should not occur, even if it would not belong to the problem we look for. But this symtom pops up every time when the equity breakout-error occurs. You can also see that the equity breakout happend because the day after, the number of shares raised enormously too.

2. Reproducability (no transaction weight)
At this point i did not use transaction weights because this error does not happen with every backtest. Sometimes you can get it with the first run, sometimes the second run, or you need to run the backtest five or six times in a row. Looking at the equity curve after the run, you can immediatelly jump to the corresponding datapoints because of the strategy setup when such a suspicious breakout occurs.
Always checking the data points around the breakout.
Or course you can do each run with different but controlled weights and if you hit on the error we would be able to repeat this special backtest. To find any error of this type i simply run the backtest more than once until i find something. It never took me more than five or six runs. You can give it a try on your side if you like.
3. Different symbols
It still can be like you and Glitch pointed out, a simple data error. But in different runs, as i mentioned before, there are also different symbols included. I don't think and at least i hope there are not so many different kind of broken data points for different symbols.
3. Minor stuff
I copied the positions to the clipboard and opened them with libre office. I introduced a column including the running equity+current profit. It did not help so far but i thought it might be useful to see something like that in the position tab of WL too. Although i am not able to see an effect on the problem, i noticed that the strategy runs with negative balance. I am not sure how margins are handled. But with a cash account the strategy should stop imo. Another idea is that this introduce some weird sign issue on the way to the equity breakout.
Maybe you can get some useful ideas. Imo you should be able to create the issue on you side too. Here is the last output i created today before my post.

That is why i checked the equity curve for the date when the breakout occured. Then i sorted it by date to check the datapoints on that point and around that point (includes looking at the charts). I can not exclude that there is broken data, but i certainly found something else.
This is an EOD strategy with maximum one trade a day because the position sizer uses 100% (used 95% also). Just some minutes before, i did another test with the OneNight strategy and WL Nasdaq data with the same error.
1. Number of trades (more than one)
Please look at the fact that there are days including more than one trade. This effects the equity curve of course, but i can not explain to me how this behaviour can be triggered by a broken data point. With 100% position sizing the equity should not influence the number of trades. Of course, the other way around, more trades will effect the equity curve. This is at least one point that should not occur, even if it would not belong to the problem we look for. But this symtom pops up every time when the equity breakout-error occurs. You can also see that the equity breakout happend because the day after, the number of shares raised enormously too.
2. Reproducability (no transaction weight)
At this point i did not use transaction weights because this error does not happen with every backtest. Sometimes you can get it with the first run, sometimes the second run, or you need to run the backtest five or six times in a row. Looking at the equity curve after the run, you can immediatelly jump to the corresponding datapoints because of the strategy setup when such a suspicious breakout occurs.
Always checking the data points around the breakout.
Or course you can do each run with different but controlled weights and if you hit on the error we would be able to repeat this special backtest. To find any error of this type i simply run the backtest more than once until i find something. It never took me more than five or six runs. You can give it a try on your side if you like.
3. Different symbols
It still can be like you and Glitch pointed out, a simple data error. But in different runs, as i mentioned before, there are also different symbols included. I don't think and at least i hope there are not so many different kind of broken data points for different symbols.
3. Minor stuff
I copied the positions to the clipboard and opened them with libre office. I introduced a column including the running equity+current profit. It did not help so far but i thought it might be useful to see something like that in the position tab of WL too. Although i am not able to see an effect on the problem, i noticed that the strategy runs with negative balance. I am not sure how margins are handled. But with a cash account the strategy should stop imo. Another idea is that this introduce some weird sign issue on the way to the equity breakout.
Maybe you can get some useful ideas. Imo you should be able to create the issue on you side too. Here is the last output i created today before my post.
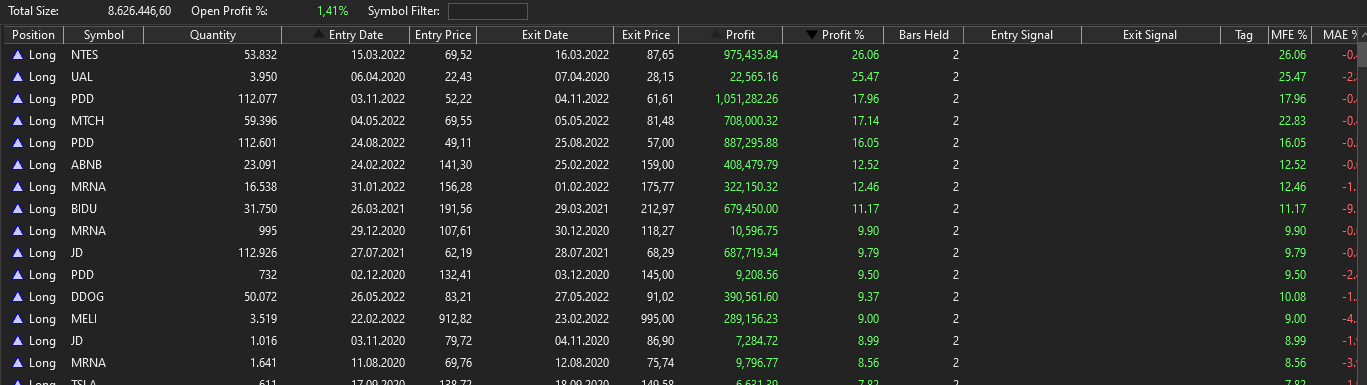
Can you please sort the positions by Profit % and report the largest one.
Here you are.

Further screenshots on this specific run won't be possible because i closed the window by accident at this moment. I wanted to show the chart with the important trades.
Further screenshots on this specific run won't be possible because i closed the window by accident at this moment. I wanted to show the chart with the important trades.
What happens if you change your language settings from de to us?
DrKoch, that would likely lead to problems because WL8 would read the settings file and run into exceptions trying to convert the saved information.
Let's try to set up that zoom call so I can work with you on the issue live.
Let's try to set up that zoom call so I can work with you on the issue live.
I wrote an e-mail to support@wealth-lab.com. Thanks.
Ok I will write back later. Until then, in order to rule out other things, please turn off commission, dividends, and futures mode. The less variables we have to consider the better. After re running it over 100 times I still have not had it occur at my end.
At this point the most likely culprit is dividends, I believe there was some parsing issue with regional settings in a prior build so we might need to have job reset your fundamental events data.
At this point the most likely culprit is dividends, I believe there was some parsing issue with regional settings in a prior build so we might need to have job reset your fundamental events data.
Good gut feeling.
I played with the public strategies to find commonalities and gradually activated or deactivated the backtest settings. I was able to produce this error again and again until I deactivated the option Collect Dividends on backtest Positions I am not 100% sure, but it looks good. So far I have not been able to produce the reported behaviour again. I'll keep my fingers crossed, but it seems to be about this point.
It's certainly not a waste of time to take a closer look. The backtest results of the strategies are massively affected by the reported effect.
If this is dividends, which is what i suspected, then when you see the equity spike you’ll see a corresponding spike in the reported dividends in the metrics report.
In the data manager you’ll need to clear the dividends by right clicking the Event Providers and select the Delete Local Data.
We rectified the problem many builds ago so once you clear the corrupted info you should be good going forward.
In the data manager you’ll need to clear the dividends by right clicking the Event Providers and select the Delete Local Data.
We rectified the problem many builds ago so once you clear the corrupted info you should be good going forward.
Your Response
Post
Edit Post
Login is required