I want a custom indicator to use the Price pane when it's Dragged-and-Dropped. But in spite of it being defined that way, the pop-up menu tries to put it into the Volume pane instead. If I use the pull-down menu to redirect it into the Price pane, it puts it into the Volume pane anyway. However, if I makeup a "unique pane" name in the menu, it works as expected.
What's weird is that I can't reproduce this Volume-pane obsession problem with my other indicators. The only thing "special" about the indicators with Volume-pane obsession is that they take two TimeSeries as their first two parameters. But I can't see how that relates to Volume-pane obsession. Can you? I'm running WL7 Build 15.
What's weird is that I can't reproduce this Volume-pane obsession problem with my other indicators. The only thing "special" about the indicators with Volume-pane obsession is that they take two TimeSeries as their first two parameters. But I can't see how that relates to Volume-pane obsession. Can you? I'm running WL7 Build 15.
CODE:
namespace WealthLab.Indicators
{
    public class VWEMA : IndicatorBase  //Volume-Weighted Exponential Moving Average; VWEMA indicator
    {
      string sourceDescription = "srcDes";
      string weightsDescription = "wtsDes";

      public VWEMA() : base() { }

      public VWEMA(TimeSeries source, TimeSeries weights, int period, string description = null) : base()
      {
         Parameters[0].Value = source;
         Parameters[1].Value = weights;
         Parameters[2].Value = period;
         Parameters[3].Value = description;
         Populate();
      }

      public override void Populate()
      {
         TimeSeries source = Parameters[0].AsTimeSeries;
         TimeSeries weights = Parameters[1].AsTimeSeries;
         sourceDescription = source.Description;
         weightsDescription = weights.Description;
         int period = Parameters[2].AsInt;
         string description = Parameters[3].AsString;
         if (description != null) { Description = description; }
         DateTimes = source.DateTimes;

         FirstValidIndex = period-1 + source.FirstValidIndex;
            double alpha = 1.0 - 2.0/(period+1);
            double oneMinusAlpha = 1.0 - alpha; ...

      public override string Name => "Volume-Weighted EMA";
      public override string Abbreviation => "VWEMA";
      public override string HelpDescription => @"The Volume-Weighted EMA indicator, VWEMA, performs an EMA of price weighted by volume.";
      public override string PaneTag => "Price";
      public override bool IsSmoother => false;
      public override Color DefaultColor => Color.LawnGreen;
      public override PlotStyles DefaultPlotStyle => PlotStyles.Line;

      protected override void GenerateParameters()
      {
         AddParameter("Source", ParameterTypes.TimeSeries, PriceComponents.Close);
         AddParameter("Volume|Weights", ParameterTypes.TimeSeries, PriceComponents.Volume);
         AddParameter("Period", ParameterTypes.Int32, 10); //RangeBoundInt32(14,2,Int32.MaxValue)
         AddParameter("Description", ParameterTypes.String, "VWEMA(" + sourceDescription + "," + weightsDescription + "," + Parameters[2].AsInt + ")");
      }
Rename
The Indicators are designed such that they can really only have one source parameter, that is, the TimeSeries they are dropped on, or the BarHistory being charted.
What's the idea behind the "weights" parameter?
I believe you want to capture the volume? If you change the parameter type to BarHistory, you can then use some code like this in the Populate method to get at the volume:
What's the idea behind the "weights" parameter?
I believe you want to capture the volume? If you change the parameter type to BarHistory, you can then use some code like this in the Populate method to get at the volume:
CODE:

BarHistory bars = Parameters[N].AsBarHistory; //replace N with parameter index
TimeSeries vol = bars.Volume;
QUOTE:
The Indicators are designed such that they can really only have one source parameter, that is, the TimeSeries they are dropped on,...
In all case, I'm dropping the indicator on the candlesticks of the Price pane.
QUOTE:
What's the idea behind the "weights" parameter?
This is a Volume-Weighted EMA indicator. It's always weighted by Volume for Drag-and-Drop, but a weighting TimeSeries other than Volume can be used in Strategy code, so there's a second TimeSeries parameter for that. Are you saying that's a problem for plotting the weighted EMA on the Price pane? (I don't see the connection.)
Some price changes fit a statistical model better than others. For example, one may want to weight the EMA against the StdDev instead of Volume and plot that on the Price pane. Is that not doable with WL7 indicators? That would be a weird limitation.
can we stick to one imagined limitation at a time? did you try out my suggested code change and see if it works for you?
I don't understand your suggestion. Please include code for the entire method, not just two lines. I'm not even sure which method I need to insert these suggested lines in.
Honestly, I don't even understand the problem. Why does passing two TimeSeries make a difference on which pane the indicator appears on when that choice is clearly defined in the indicator code itself?
Honestly, I don't even understand the problem. Why does passing two TimeSeries make a difference on which pane the indicator appears on when that choice is clearly defined in the indicator code itself?
The reason that it's plotting in the Volume pane is due to some logic that the drag and drop system has to auto-detect volume-based indicators. It sees the TimeSeries parameter defaulting to Volume and so it concludes that the indicator should be plotted in the volume pane.
Here is complete indicator code illustrating my suggested way to incorporate volume in a custom indicator.
Here is complete indicator code illustrating my suggested way to incorporate volume in a custom indicator.
CODE:

using WealthLab.Core;
using System;
using System.Drawing;
using WealthLab.Indicators;

namespace WealthLab.Indicators
{
    public class St : IndicatorBase
    {
        //parameterless constructor
        public St() : base()
        {
        }

        //for code based construction
        public St(TimeSeries source, BarHistory bars, Int32 period)
            : base()
        {
         Parameters[0].Value = source;
         Parameters[1].Value = bars;
         Parameters[2].Value = period;
            Populate();
        }

      //static Series method
      public static St Series(TimeSeries source, BarHistory bars, Int32 period)
      {
         return new St(source, bars, period);
      }

        //name
        public override string Name
        {
            get
            {
                return "ST";
            }
        }

        //abbreviation
        public override string Abbreviation
        {
            get
            {
                return "St";
            }
        }

        //description
        public override string HelpDescription
        {
            get
            {
                return "ST";
            }
        }

        //price pane
        public override string PaneTag
        {
            get
            {
                return "Price";
            }
        }

      //default color
      public override Color DefaultColor
      {
         get
         {
            return Color.FromArgb(255,0,0,255);
         }
      }

      //default plot style
      public override PlotStyles DefaultPlotStyle
      {
         get
         {
            return PlotStyles.Line;
         }
      }

        //populate
        public override void Populate()
        {
         TimeSeries source = Parameters[0].AsTimeSeries;
         BarHistory bars = Parameters[1].AsBarHistory;
         Int32 period = Parameters[2].AsInt;
            DateTimes = source.DateTimes;

         //modify the code below to implement your own indicator calculation
            for (int n = 0; n < source.Count; n++)
         {
            Values[n] = Value(n, source, period, bars);
         }
        }

      public static double Value(int idx, TimeSeries source, int period, BarHistory bars)
      {
         if (period <= 0 || idx >= source.Count || (idx - period + 1) < 0)
            return Double.NaN;
         double sum = 0;
         double sumVols = 0;
         for (int n = 0; n < period; n++)
         {
            var i = idx - n;
            sum += source[i] * bars.Volume[i];
            sumVols += bars.Volume[i];
         }
         return sum / sumVols;
      }

        //generate parameters
        protected override void GenerateParameters()
        {
         AddParameter("source", ParameterTypes.TimeSeries, PriceComponents.Close);
         AddParameter("weights", ParameterTypes.BarHistory, null);
         AddParameter("period", ParameterTypes.Int32, 14);

        }
    }
}
QUOTE:
The reason that it's plotting in the Volume pane is due to some logic that the drag and drop system has to auto-detect volume-based indicators. It sees the TimeSeries parameter defaulting to Volume and so it concludes that the indicator should be plotted in the volume pane.
Thank you for this eye opening explanation. That gives me a brilliant idea. The GenerateParameters() routine shouldn't be targeting the primary constructor for this indicator. Rather, there's a secondary constructor, which calls the primary constructor, that GenerateParameters() routine needs to be targeting instead.
CODE:Let me try re-targeting the GenerateParameters() routine to the above (secondary) constructor and see if that fixes the Volume-pane obsession problem.
public VWEMA(BarHistory bars, int period, string description) : this(bars.Close, bars.Volume, period, description) { }
In practice, I want to pass a TimeSeries (such as StdDev) as the second weighting parameter. But that requirement is only relevant to strategy code, not Drag-and-Drop. I just didn't realize that GenerateParameters() targets only the Drag-and-Drop situation. That should be better clarified in the help docs.
I'm sorry if I left the wrong impression. I never said GenerateParameters is only called in a drag & drop situation. It's called in all cases, it's where the Indicator instance gets its Parameter instances created after all.
It gets called in other constructors because GenerateParameters is called in the IndicatorBase class parameterless constructor. All the other indicator constructors call the base constructor so it eventually gets called and the Parameter instances get created there.
It gets called in other constructors because GenerateParameters is called in the IndicatorBase class parameterless constructor. All the other indicator constructors call the base constructor so it eventually gets called and the Parameter instances get created there.
QUOTE:
I never said GenerateParameters is only called in a drag & drop situation. It's called in all cases, it's where the Indicator instance gets its Parameter instances created after all.
Okay, I didn't know that. Well, the below code fixes the Volume-pane obsession problem as show in the screenshot below.
CODE:
      protected override void GenerateParameters()
      {
         AddParameter("Bars", ParameterTypes.BarHistory, null);
         //AddParameter("Source", ParameterTypes.TimeSeries, PriceComponents.Close);
         //AddParameter("Volume|Weights", ParameterTypes.TimeSeries, PriceComponents.Volume);
         AddParameter("Period", ParameterTypes.Int32, 10); //RangeBoundInt32(14,2,Int32.MaxValue)
         AddParameter("Description", ParameterTypes.String, "VWEMA(" + sourceDescription + "," + weightsDescription + "," + Parameters[1].AsInt + ")");
      }
But, as you pointed out, GenerateParameters() is called in non-Drag-and-Drop cases, so the above fix fails to plot anything. Not a satisfying result.
I don't need a "marginal" workaround. I need a way to pass a weighting TimeSeries (like StdDev) into this Weighted EMA indicator. The weighting can be with Volume for Drag-and-Drop, but it needs to be second parameter (like StdDev) for strategy code. I'm not in a rush for this fix, so take your time coming up with a long-term solution.
The original solution works fine if it only employed the paneTag parameter that's set to "Price" in the indicator definition as expected.
---
Numerical analysis note: Typically we weight by the "reciprocal of the variance," so don't take weighting by the StdDev too literally. Let's just say there are other weighting TimeSeries (e.g., a function of ATR, MeanAbsoluteDeviation) besides Volume to apply here. That's for the strategy code to determine.
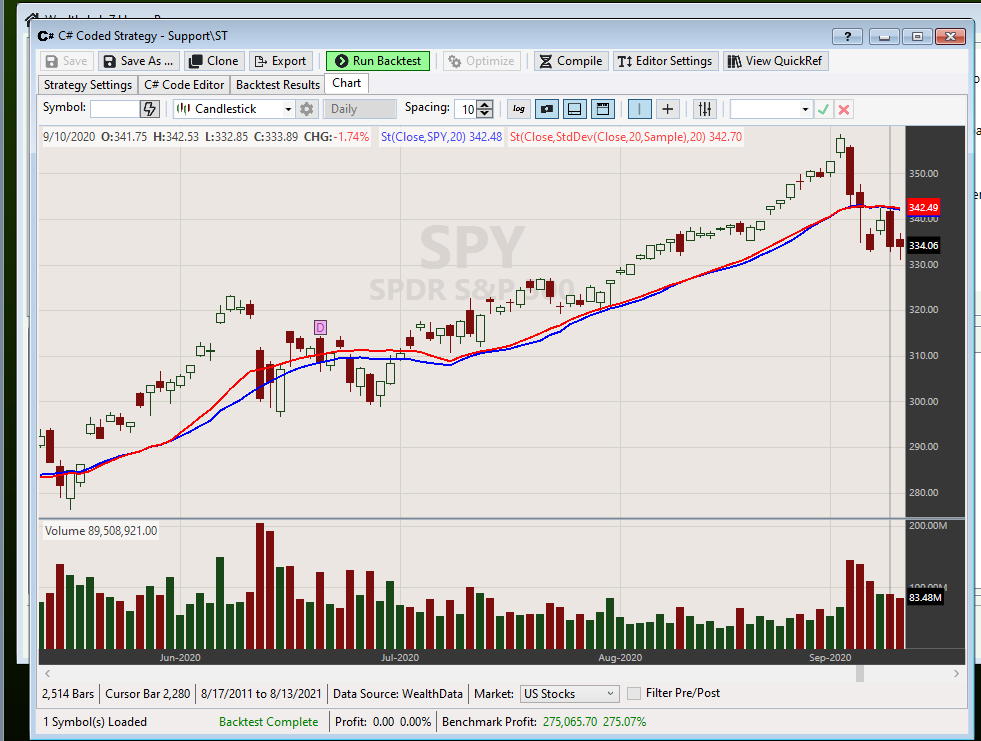
Here you go, the full solution using Volume as default for drag and drop but providing a new constructor for code based strategies to provide a different weight series. Blue line is Volume weight and red is StdDev.
CODE:

using WealthLab.Backtest;
using System;
using WealthLab.Core;
using WealthLab.Indicators;
using System.Drawing;
using System.Collections.Generic;

namespace WealthScript1
{
    public class MyStrategy : UserStrategyBase
    {
        //Initialize
        public override void Initialize(BarHistory bars)
        {
         St st1 = St.Series(bars.Close, bars, 20);
         PlotIndicator(st1);
         St st2 = St.Series(bars.Close, StdDev.Series(bars.Close, 20), 20);
         PlotIndicator(st2, Color.Red);
        }

        //Execute
        public override void Execute(BarHistory bars, int idx)
        {
        }
    }

   public class St : IndicatorBase
   {
      //parameterless constructor
      public St() : base()
      {
      }

      //for code based construction
      public St(TimeSeries source, BarHistory bars, int period)
         : base()
      {
         Parameters[0].Value = source;
         Parameters[1].Value = bars;
         Parameters[2].Value = period;
         Populate();
      }

      //new constructor to pass different weight TimeSeries
      public St(TimeSeries source, TimeSeries weights, int period)
         : base()
      {
         Parameters[0].Value = source;
         Parameters[1].Value = null;
         Parameters[2].Value = period;
         _weightSeries = weights;
         Populate();
      }

      //static Series method
      public static St Series(TimeSeries source, BarHistory bars, int period)
      {
         string key = CacheKey("Volume", period);
         if (source.Cache.ContainsKey(key))
            return (St)source.Cache[key];
         St st = new St(source, bars, period);
         source.Cache[key] = st;
         return st;
      }
      public static St Series(TimeSeries source, TimeSeries weights, int period)
      {
         string key = CacheKey(weights.Description, period);
         if (source.Cache.ContainsKey(key))
            return (St)source.Cache[key];
         St st = new St(source, weights, period);
         source.Cache[key] = st;
         return st;
      }

      //name
      public override string Name
      {
         get
         {
            return "ST";
         }
      }

      //abbreviation
      public override string Abbreviation
      {
         get
         {
            return "St";
         }
      }

      //description
      public override string HelpDescription
      {
         get
         {
            return "ST";
         }
      }

      //price pane
      public override string PaneTag
      {
         get
         {
            return "Price";
         }
      }

      //default color
      public override Color DefaultColor
      {
         get
         {
            return Color.FromArgb(255, 0, 0, 255);
         }
      }

      //default plot style
      public override PlotStyles DefaultPlotStyle
      {
         get
         {
            return PlotStyles.Line;
         }
      }

      //populate
      public override void Populate()
      {
         TimeSeries source = Parameters[0].AsTimeSeries;
         BarHistory bars = Parameters[1].AsBarHistory;
         Int32 period = Parameters[2].AsInt;
         DateTimes = source.DateTimes;

         //modify the code below to implement your own indicator calculation
         for (int bar = period; bar < source.Count; bar++)
         {
            double sum = 0;
            double sumVols = 0;
            TimeSeries weightSeries = _weightSeries;
            if (weightSeries == null)
               weightSeries = bars.Volume;
            for (int n = 0; n < period; n++)
               {
                  var i = bar - n;
                  sum += source[i] * weightSeries[i];
                  sumVols += weightSeries[i];
               }
            Values[bar] = sum / sumVols;
         }

         //modify description
         if (bars == null)
            Description = "St(" + source.Description + "," + _weightSeries.Description + "," + period + ")";
      }

      //generate parameters
      protected override void GenerateParameters()
      {
         AddParameter("source", ParameterTypes.TimeSeries, PriceComponents.Close);
         AddParameter("weights", ParameterTypes.BarHistory, null);
         AddParameter("period", ParameterTypes.Int32, 14);

      }

      //private members
      private TimeSeries _weightSeries = null;
   }
}
Edit: Was looking at this while Glitch posted.
======
Glitch's code works for me. Not you?
There are (were?) only 2 options -
1. Create a "unique" PaneTag for your indicator.
2. Specify "Price" or "Volume"
In any case, if you want to plot your indicator in the Price or Volume pane after drag and drop, you can select a different pane at the bottom of the drag & drop dialog.
Here's Glitch's code with a unique PaneTag, but dragged and dropped in 3 different panes.
I don't follow why you need a source TimeSeries for Drag-and-Drop when one bars BarHistory object has everything needed for Drag-and-Drop?
What's wrong with simply using the paneTag parameter that's set to "Price" in the indicator definition to determine that Drag-and-Drop should go into the Price pane as expected? Could a DragAndDropPaneTag parameter be added to force this?
CODE:I would just remove the "TimeSeries source" parameter. Would that be a problem?
//for code based construction public St(TimeSeries source, BarHistory bars, int period) : base() { Parameters[0].Value = source; Parameters[1].Value = bars; Parameters[2].Value = period; Populate(); }
What's wrong with simply using the paneTag parameter that's set to "Price" in the indicator definition to determine that Drag-and-Drop should go into the Price pane as expected? Could a DragAndDropPaneTag parameter be added to force this?
Well, I just discovered something. If I set the paneTag in the indicator definition to anything except "Price" in the original implementation shown in Reply# 6, it works just fine. The catch is that the default pane will not be Price, but one can use the pull-down menu to change it to Price successfully.
So GenerateParameters() setups up the default paneTag values wrong, but one can override that provided the paneTag is not set to "Price". With the current WL7 Build 15 design, setting the paneTag to "Price" confuses WL7 when there are two TimeSeries sources. Weird.
So GenerateParameters() setups up the default paneTag values wrong, but one can override that provided the paneTag is not set to "Price". With the current WL7 Build 15 design, setting the paneTag to "Price" confuses WL7 when there are two TimeSeries sources. Weird.
QUOTE:
I don't follow why you need a source TimeSeries for Drag-and-Drop when one bars BarHistory object has everything needed for Drag-and-Drop?
This particular indicator is a moving average, so its needs a specific source TimeSeries, not a BarHistory.
To clarify, the drag and drop needs a way to select open, high, low, close, volume, or even another indicator, as the source, so this is why using a BarHistory wouldn’t work.
QUOTE:
This particular indicator is a moving average, so its needs a specific source TimeSeries, not a BarHistory. To clarify, the drag and drop needs a way to select open, high, low, close, volume,
I see. My indicator(s), volume-weighted EMA, are "somewhat" of a TimeSeries too, but the code in Reply# 6 (reproduced below) splits the BarHistory out into two TimeSeries so my indicator has these two TimeSeries items intrinsically.
CODE:The solution of simply setting the indicator paneTag to something other than "Price", then selecting "Price" in the pull-down menu seems to work okay (for me anyway), although following the paneTag="Price" setting as expected would be much preferred.
public VWEMA(BarHistory bars, int period, string description) : this(bars.Close, bars.Volume, period, description) { }
Thanks for all the explanation and help on this one. It's been interesting.
OK, but what if you wanted to apply your Volume-Weighted EMA to something else, like an RSI or a ROC, for example?
Maybe that's unlikely, but you might want to apply it to Open, High, etc, instead of defaulting to Close. The TimeSeries parameter is a way to let the user select that.
Maybe that's unlikely, but you might want to apply it to Open, High, etc, instead of defaulting to Close. The TimeSeries parameter is a way to let the user select that.
QUOTE:For Drag-and-Drop, the Volume-Weighted EMA must be weighted by volume. The user has no drop-down menu choice for weights.
OK, but what if you wanted to apply your Volume-Weighted EMA to something else, like an RSI or a ROC, for example?
If they want to apply the weighting as a function of RSI or ROC, then they are going to have to call it from strategy code. There's no other choice with my implementation.
The weighting function will probably be an equation anyway. For example, we typically weight a least-squares fit with the "reciprocal of the variance," but there isn't an indicator for that. So for computing the weighting function, you're going to have to use strategy code anyway.
Weighting functions can be somewhat complicated depending on the factors in play. So that's why I coded this indicator in the first place. I want to try several weighting methods to see if some weighting functions smooth the EMA better than others.
"Theoretically," the Kalman filter would weight the interactions between the inputs the best through its covariant matrix. But to take advantage of this, one would want a Kalman filter with about 4 inputs or so. The finantic.Kalman only allows 2 inputs, so this is very limited. And a 4 input Kalman may take too many CPU cycles to solve.
I wasn’t suggesting that the weight would be selectable. Rather, the target (source) TimeSeries.
What if you wanted to volume smooth the High or Low, or maybe even an RSI?
What if you wanted to volume smooth the High or Low, or maybe even an RSI?
QUOTE:Well, you wouldn't be able to do that with Drag-and-Drop with my BarHistory implementation. That would have to be done from strategy code.
What if you wanted to volume smooth the High or Low, or maybe even an RSI?
So ideally, both source and weight inputs should be a TimeSeries and the source TimeSeries should be selectable from a drop-down menu for maximum flexibility during a Drag-and-Drop; whereas, the weight input can be fixed as Volume for Drag-and-Drop. Let me think more on that.
I made a few improvements for Build 16 ...
1) I tweaked the logic so that it only considers the first parameter when seeing if it needs to target the volume pane.
2) You can now target other dropped indicators in a TimeSeries parameter.
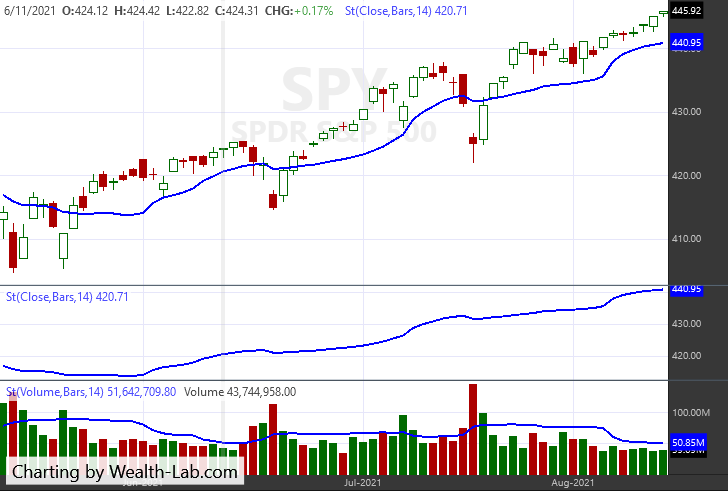
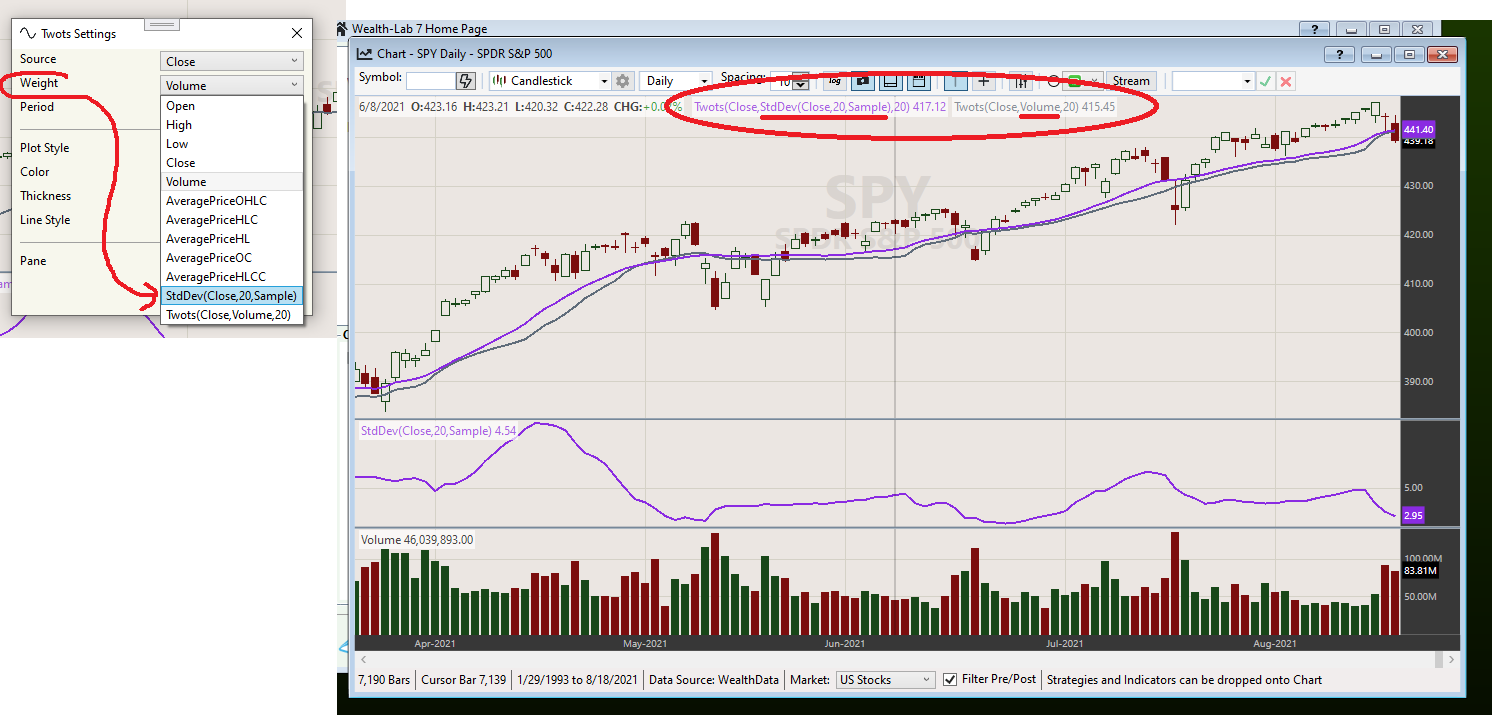
Here's a minimal example of a weighted MA with the weight determined by the second parameter, which is a TimeSeries. The gray line is using Volume, which is the default. The purple line is using StdDev (which I dropped earlier) as the weight.
1) I tweaked the logic so that it only considers the first parameter when seeing if it needs to target the volume pane.
2) You can now target other dropped indicators in a TimeSeries parameter.
Here's a minimal example of a weighted MA with the weight determined by the second parameter, which is a TimeSeries. The gray line is using Volume, which is the default. The purple line is using StdDev (which I dropped earlier) as the weight.
CODE:

using WealthLab.Core;
using System;
using System.Drawing;
using WealthLab.Indicators;

namespace WealthLab.Indicators
{
    public class Twots : IndicatorBase
    {
        //parameterless constructor
        public Twots() : base()
        {
        }

        //for code based construction
        public Twots(TimeSeries source, TimeSeries weight, Int32 period)
            : base()
        {
         Parameters[0].Value = source;
         Parameters[1].Value = weight;
         Parameters[2].Value = period;
            Populate();
        }

      //static Series method
      public static Twots Series(TimeSeries source, TimeSeries weight, Int32 period)
      {
         return new Twots(source, weight, period);
      }

        //name
        public override string Name
        {
            get
            {
                return "TwoTS";
            }
        }

        //abbreviation
        public override string Abbreviation
        {
            get
            {
                return "Twots";
            }
        }

        //description
        public override string HelpDescription
        {
            get
            {
                return "Testing 2 Time Series";
            }
        }

        //price pane
        public override string PaneTag
        {
            get
            {
                return "Price";
            }
        }

      //default color
      public override Color DefaultColor
      {
         get
         {
            return Color.FromArgb(255,119,136,153);
         }
      }

      //default plot style
      public override PlotStyles DefaultPlotStyle
      {
         get
         {
            return PlotStyles.Line;
         }
      }

        //populate
        public override void Populate()
        {
         TimeSeries source = Parameters[0].AsTimeSeries;
         TimeSeries weight = Parameters[1].AsTimeSeries;
         Int32 period = Parameters[2].AsInt;
            DateTimes = source.DateTimes;

         //modify the code below to implement your own indicator calculation
            for (int bar = period; bar < source.Count; bar++)
         {
            double sum = 0;
            double sumVols = 0;
            for (int n = 0; n < period; n++)
            {
               var i = bar - n;
               sum += source[i] * weight[i];
               sumVols += weight[i];
            }
            Values[bar] = sum / sumVols;
         }
        }

        //generate parameters
        protected override void GenerateParameters()
        {
         AddParameter("Source", ParameterTypes.TimeSeries, PriceComponents.Close);
         AddParameter("Weight", ParameterTypes.TimeSeries, PriceComponents.Volume);
         AddParameter("Period", ParameterTypes.Int32, 20);
        }
    }
}
QUOTE:
I made a few improvements for Build 16 ...
1) I tweaked the logic so that it only considers the first parameter when seeing if it needs to target the volume pane.
I can see it's targeting the Price pane now. That's great. Can't wait to try it on Build 16.
QUOTE:And does this include "companion indicators"?
2) You can now target other dropped indicators in a TimeSeries parameter.
For devising companion indicators for the weighting function, it has never been numerically determined what weighting functions would best minimize random behavior in Price and such. This feature is fore-running the numerical research. We aren't ready for "companion indicators" for weighting functions as yet.
I tried the original indicator code (reproduced below without the Series methods) with Build 17B, and it all works as expected for Drag-and-Drop even when using BarHistory as the sole input source! Thanks a whole bunch; I'm impressed. And it puts the indicator on the Price pane as the default as directed.
I suppose one could add some "companion indicators" as possible weighting choices, but that sounds very advanced at this point since proper weighting functions haven't yet been established.
I suppose one could add some "companion indicators" as possible weighting choices, but that sounds very advanced at this point since proper weighting functions haven't yet been established.
CODE:
namespace WealthLab.Indicators
{
    public class VWEMA : IndicatorBase  //Volume-Weighted Exponential Moving Average; VWEMA indicator
    {
      string sourceDescription = "srcDes";
      string weightsDescription = "wtsDes";

      public VWEMA() : base() { }

      public VWEMA(TimeSeries source, TimeSeries weights, int period, string description = null) : base()
      {
         Parameters[0].Value = source;
         Parameters[1].Value = weights;
         Parameters[2].Value = period;
         Parameters[3].Value = description;
         Populate();
      }

      public override void Populate()
      {
         TimeSeries source = Parameters[0].AsTimeSeries;
         TimeSeries weights = Parameters[1].AsTimeSeries;
         sourceDescription = source.Description;
         weightsDescription = weights.Description;
         int period = Parameters[2].AsInt;
         string description = Parameters[3].AsString;
         if (description != null) { Description = description; }
         DateTimes = source.DateTimes;

         FirstValidIndex = period-1 + source.FirstValidIndex;
            double alpha = 1.0 - 2.0/(period+1);
            double oneMinusAlpha = 1.0 - alpha;
            double numerator = oneMinusAlpha * weights[0] * source[0];
            double denominator = oneMinusAlpha * weights[0];
            Values[0] = numerator / denominator; //VWEMA[0]

            for (int bar = 1; bar < base.Count; bar++)
            {
                numerator = alpha*numerator + oneMinusAlpha*weights[bar]*source[bar];
                denominator = alpha*denominator + oneMinusAlpha*weights[bar];
                Values[bar] = numerator / denominator;
            }
        }

        public VWEMA(BarHistory bars, int period, string description) : this(bars.Close, bars.Volume, period, description) { }

      public override string Name => "Volume-Weighted EMA";
      public override string Abbreviation => "VWEMA";
      public override string HelpDescription => @"The Volume-Weighted EMA indicator, VWEMA, performs an EMA of price weighted by volume.";
      public override string HelpURL => @"www.financialwisdomforum.org/gummy-stuff/EMA.htm";
      public override string PaneTag => "Price";
      public override bool IsSmoother => false; //technically, it's a smoother
      public override Color DefaultColor => Color.LawnGreen;
      public override PlotStyles DefaultPlotStyle => PlotStyles.Line;

      protected override void GenerateParameters()
      {
         AddParameter("Source", ParameterTypes.TimeSeries, PriceComponents.Close);
         AddParameter("Volume|Weights", ParameterTypes.TimeSeries, PriceComponents.Volume);
         AddParameter("Period", ParameterTypes.Int32, 10); //RangeBoundInt32(14,2,Int32.MaxValue)
         AddParameter("Description", ParameterTypes.String, "VWEMA(" + sourceDescription + "," + weightsDescription + "," + Parameters[2].AsInt + ")");
      }
Your Response
Post
Edit Post
Login is required