Hello all!
Brand new premium subscriber with lots to learn about the software's capabilities.
I have scoured the indicators and don't see much in the way of divergence.
Is there any available or are most scripting their own?
Brand new premium subscriber with lots to learn about the software's capabilities.
I have scoured the indicators and don't see much in the way of divergence.
Is there any available or are most scripting their own?
Rename
The PeakTroughCalculator has a divergence [extension] function. The script below detects divergence between price and RSI. Gold arrows are drawn (best seen in the dark theme) on the bar of detection, and green and red lines are drawn for bullish and bearish divergence, respectively.
CODE:
using WealthLab.Backtest;
using System;
using WealthLab.Core;
using WealthLab.Indicators;
using System.Collections.Generic;

namespace WealthScript3
{
   public class DivergenceDetector : UserStrategyBase
   {
      public DivergenceDetector()
      {
         AddParameter("Reversal", ParameterType.Double, 8, 1, 40, 1);
      }


      public override void Initialize(BarHistory bars)
      {
         _rsi = new RSI(bars.Close, 14);
         PlotIndicator(_rsi, WLColor.FromArgb(255, 120, 120, 248), PlotStyle.Line);

         //create the PeakTroughCalculator for an Indicator or TimeSeries
         double reversal = Parameters[0].AsDouble;
         PeakTroughReversalType reversalType = PeakTroughReversalType.Point;
         _ptc = new PeakTroughCalculator(_rsi, reversal, reversalType);

         //start after at least 2 peaks and 2 troughs
         PeakTrough pt = _ptc.PeakTroughs[3];
         StartIndex = pt.DetectedAtIndex;
      }


      public override void Execute(BarHistory bars, int idx)
      {
         PeakTrough pt = null;
         PeakTrough pt2 = null;

         if (_ptc.Divergence(idx, bars.High, out pt, out pt2) == DivergenceType.Bearish)
         {
            WLColor bearClr = WLColor.Red;
            DrawBarAnnotation(TextShape.ArrowDown, idx, true, WLColor.Gold, 36);
            DrawLine(pt.XIndex, pt.YValue, pt2.XIndex, pt2.YValue, bearClr, 2, default, _rsi.PaneTag);
            DrawLine(pt.XIndex, bars.High[pt.XIndex], pt2.XIndex, bars.High[pt2.XIndex], bearClr, 2, default, "Price");
         }
         else if (_ptc.Divergence(idx, bars.Low, out pt, out pt2) == DivergenceType.Bullish)
         {
            WLColor bullClr = WLColor.Green;
            DrawBarAnnotation(TextShape.ArrowUp, idx, false, WLColor.Gold, 36);
            DrawLine(pt.XIndex, pt.YValue, pt2.XIndex, pt2.YValue, bullClr, 2, default, _rsi.PaneTag);
            DrawLine(pt.XIndex, bars.Low[pt.XIndex], pt2.XIndex, bars.Low[pt2.XIndex], bullClr, 2, default, "Price");
         }

      }

      PeakTroughCalculator _ptc;
      RSI _rsi;
   }
}
Thank you very much Cone.
I couldnt find the Peaktrough in my indicators. Perhaps I haven't loaded all the extensions.
What are the steps to get this code into my system? Or a link to the education for this please.
I couldnt find the Peaktrough in my indicators. Perhaps I haven't loaded all the extensions.
What are the steps to get this code into my system? Or a link to the education for this please.
QUOTE:
I couldn't find the Peaktrough in my indicators.
PeakTrough and PeakTroughCalculator are datatypes, not indicators. And they come installed with WL7/8. Look in the QuickRef guide for them.
You can plot the ZigZag indicator for Peaks and Troughs. But you'll need to use a C# strategy with the PeakTroughCalculator for Divergence - it's not available in the blocks. We might be able to add one (I'll think about), but it would be a pretty involved Condition!
QUOTE:
you'll need to use a C# strategy with the PeakTroughCalculator for Divergence - it's not available in the blocks.
Just to add ... doing complex stuff in code (e.g. C#) is much easier than using blocks. I would reserve using blocks for simple stuff.
This would be a useful block to have - maybe I can get it done in time for the next build of the PowerPack!
That would be great Cone. Divergence can be a useful if coupled with other indicators for confirmation.
I envy you people that can code. I suppose I should try to pick it up one of these days. As a farmer I don't find a big need to code and as such will rely on (and pay if needed) you good people to "build" script.
I envy you people that can code. I suppose I should try to pick it up one of these days. As a farmer I don't find a big need to code and as such will rely on (and pay if needed) you good people to "build" script.
We're gearing up for the next round of builds now - look for it in Power Pack Build 9.
The rule is based on the code above. You can set it up to detect Bullish divergence (rising indicator troughs vs. lower price lows) or Bearish divergence (falling indicator peaks vs. higher price highs)
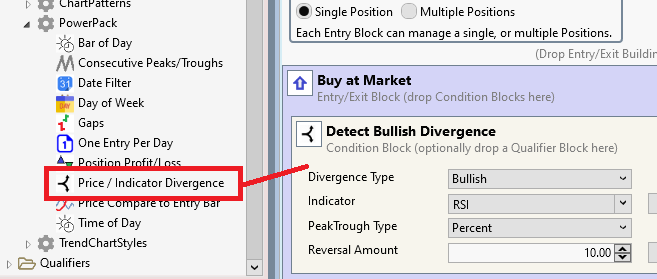
Furthermore, like the code above, it draws the divergence lines and indicates the bar at which divergence was detected with a fuchsia arrow.
The rule is based on the code above. You can set it up to detect Bullish divergence (rising indicator troughs vs. lower price lows) or Bearish divergence (falling indicator peaks vs. higher price highs)
Furthermore, like the code above, it draws the divergence lines and indicates the bar at which divergence was detected with a fuchsia arrow.
Fantastic Cone. Look forward to it.
This is a simple pic of my divergence. I use the set-ups (both hidden and regular) along with some confirmation indicator,usually volume spikes. In this pic I am using Sequential.
But looking forward to backtesting with WL to see what has a good fit.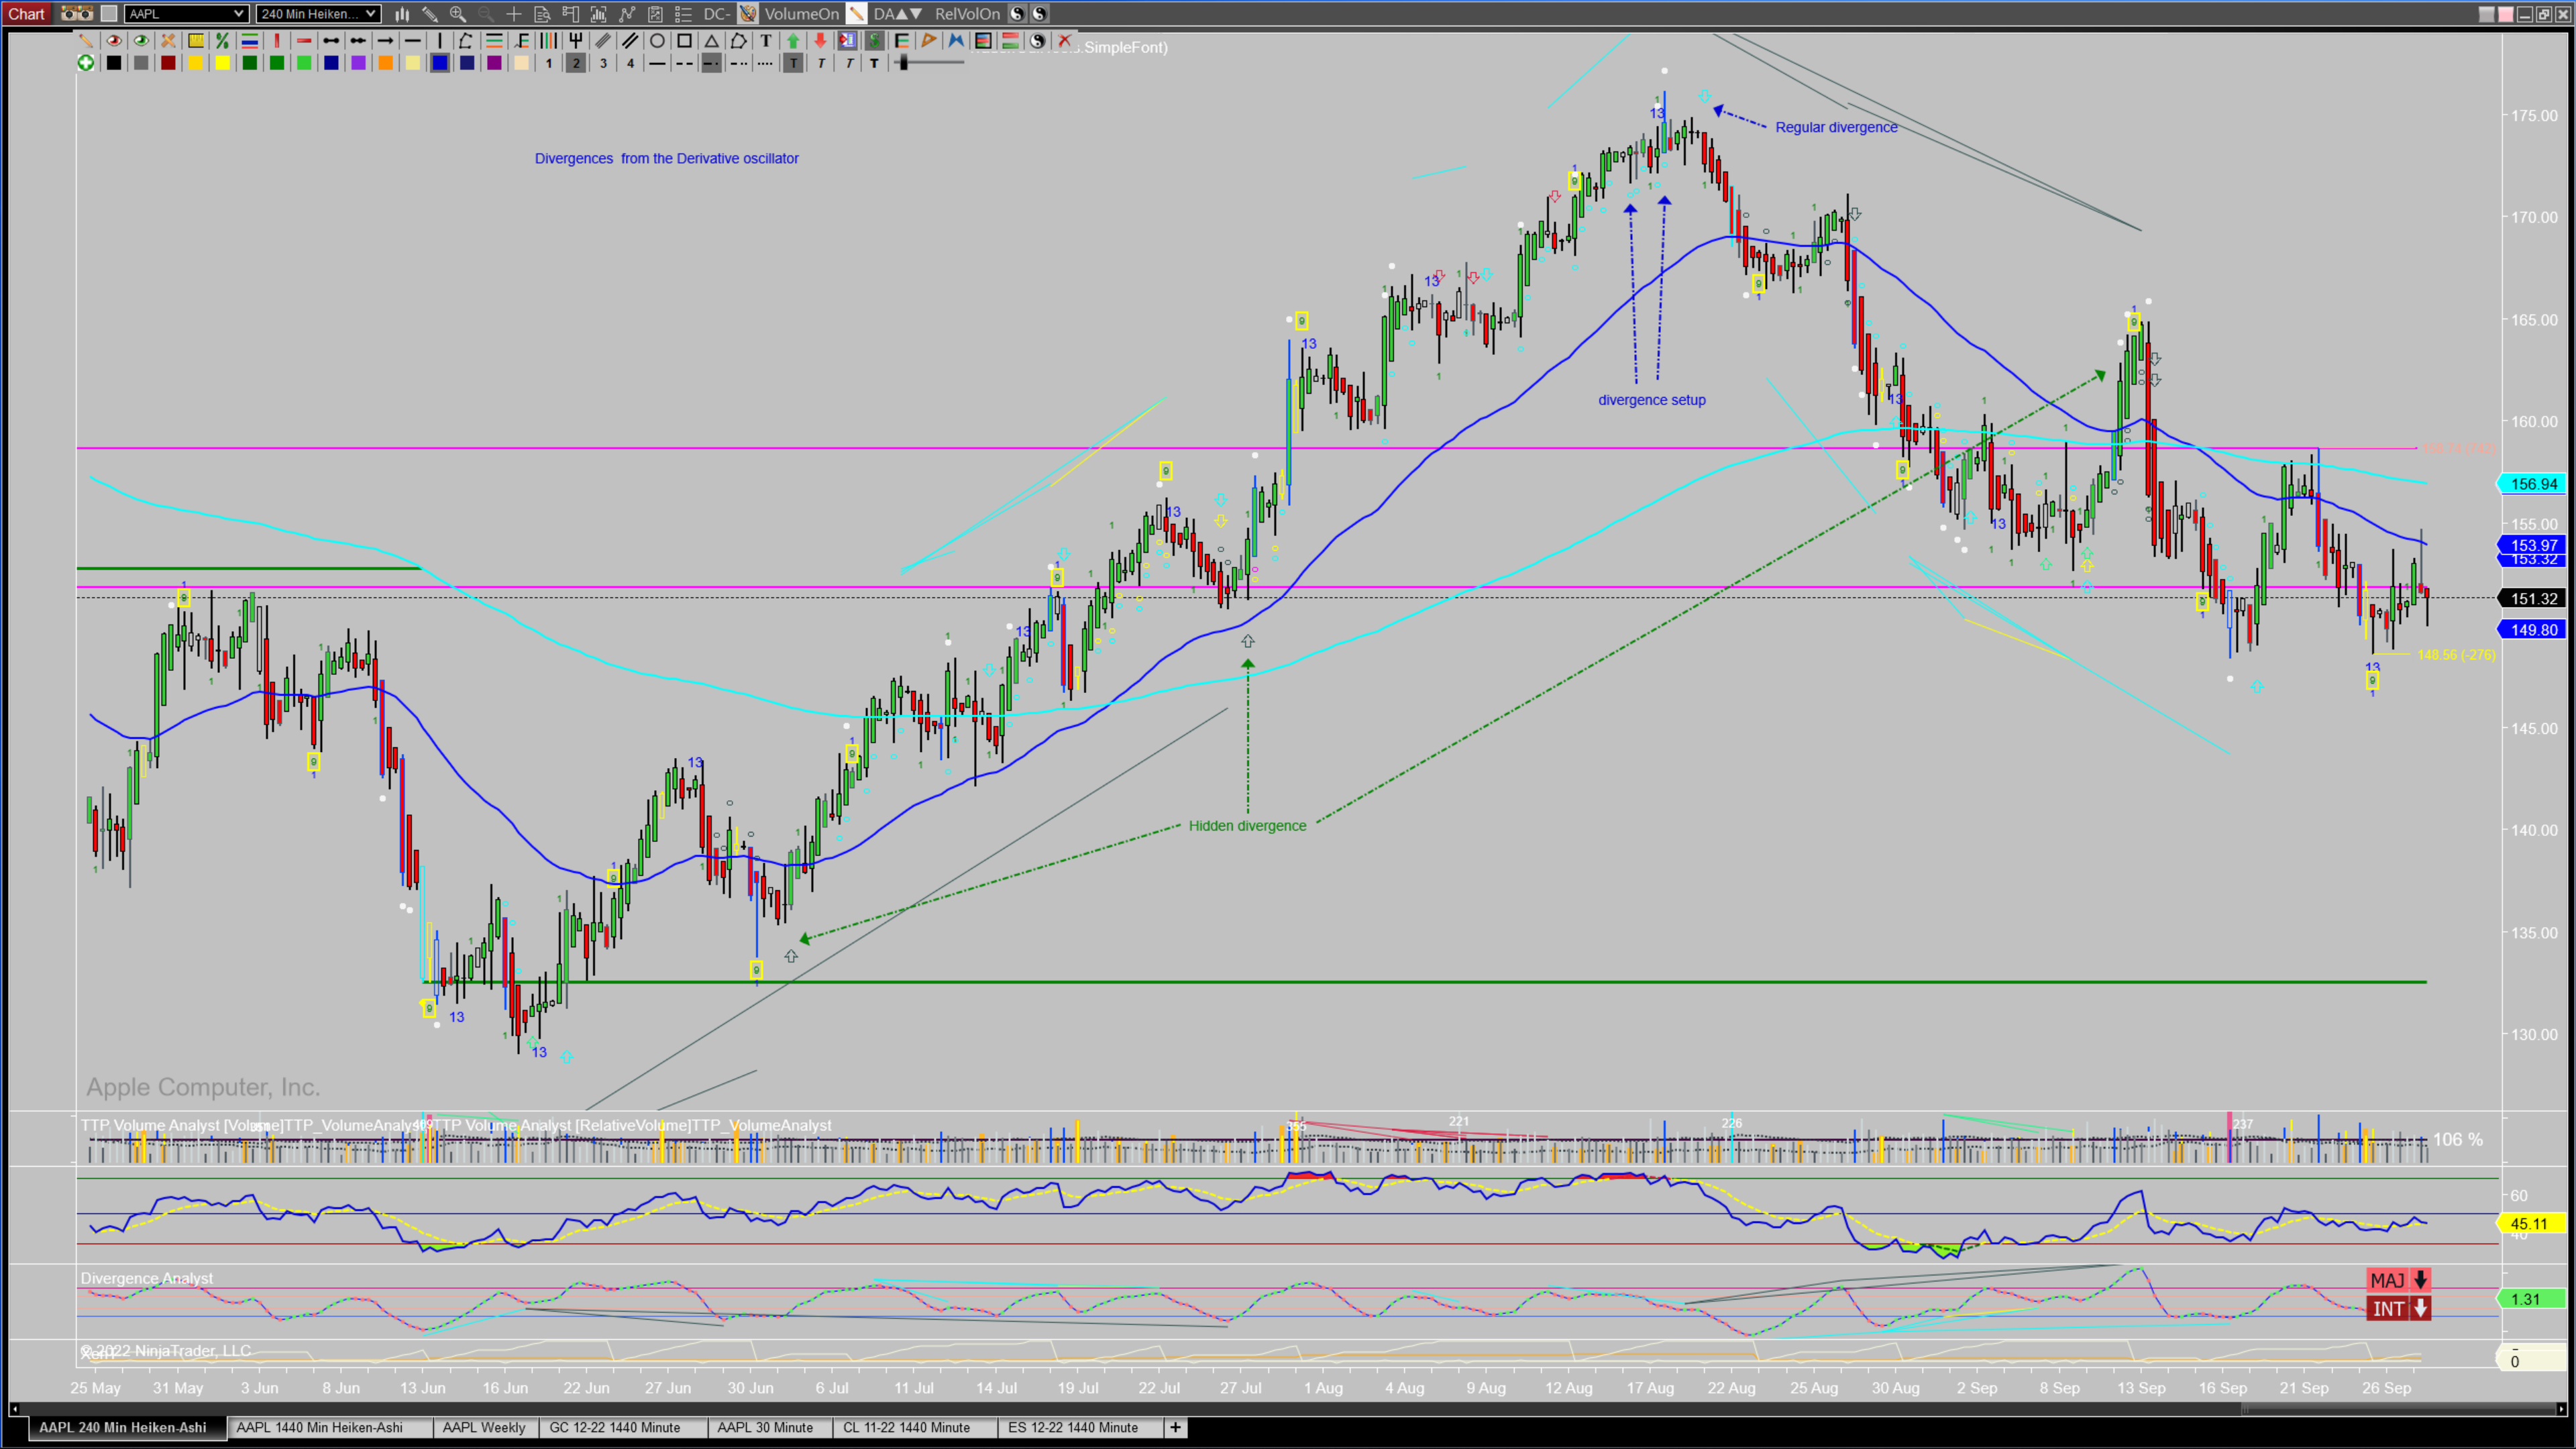
This is a simple pic of my divergence. I use the set-ups (both hidden and regular) along with some confirmation indicator,usually volume spikes. In this pic I am using Sequential.
But looking forward to backtesting with WL to see what has a good fit.
Your Response
Post
Edit Post
Login is required