TLDR;
What tool or metrics are used to determine if a back tested strategy will perform equally well in live trading? What are some of the pitfalls specifically of live trading a dip buyer with limit entries? Would it be possible for a follow-up video on the topic of dip buyers as alluded to here:
https://youtu.be/Yyny4_38UVE?si=ZoZYMApuAwe_0kum&t=380
I chose a dip buying strategy to live trade with for my first foray into algorithmic trading using Wealth-lab. I chose this strategy since it optimised well on my local market - and because Dion trades one! https://youtu.be/Yyny4_38UVE?si=ziS3EJ8G0VzNQAkz&t=20
I am interested in discussing or further researching why dip buyer back testing results can differ from live trading results.
The base strategy is the knife juggler strategy optimised to a sell after 1 bar exit only and a different buy at limit %. No other exits. Position size is optimised to 15% of equity. Dataset is back test friendly (no survivorship bias).
In order to stabilise the back testing results, a transaction weight has been added favouring the highest high. ie non-penny stocks. Significant NSF positions remain (NSF ratio is 1.5) but still the results are stable. If I experiment with adding margin to take all the NSF signals, the results are still stable, but reduced quite a lot. This is a clue to what is happening.
In order to reduce slippage l added a condition to only consider stocks with a turnover high enough to ensure liquidity. I also experimented with Preferences->back test->other settings->Volume % limit, but currently have it turned off in favor of the above mentioned liquidity filter.
Slippage has not been measured yet with live trading, but currently set to 0.10% in trading preferences. Commission is set accurately in back test preferences.
Results:
APR: is in the too good to be true range.
Equity curve: super smooth.
Time frames: Back testing on multiple timeframes produced very consistent results.
Average profit per trade: 0.6% (after slippage and commission?)
Max Drawdown 13%.
Win rate: 58%
Average profit 2.56%
Average loss 2.20%
Position count: ~1,500/year.
My observation so far in live trading a dip buyer is that the rapid falling knives at the start of the trading day severely skew the actual results versus back testing results. An example: Assume on an arbitrary trade day the back test results for each stock considered were as follows:
Back test results available to the system. Return per trade.
AA = 5%
BB = 2.56%
CC = 0%
DD = -2.20%
EE = -13% (ouch)
However due to NSF positions only stocks AA to DD are bought/considered in the back test. This means that EE is not included in the results and thus the results have a positive bias.
What I have seen so far in live trading is that trade EE occurs first since some negative news event has caused a stock to fall sharply on market open.
Actual results of trades in live trading:
EE = -13% (ouch)
DD = -2.20%
BB = 2.56%
CC = 0%
AA = 5%
Trade EE is sampled and AA is not. The lack of buying power has skewed the results and there is a sampling bias between the back test results and the live results in this strategy.
Dion talks about limitations of limit order systems here:
https://youtu.be/pY95U-8UbEA?si=VY5IXc4N3hxXA9_Q&t=2947
Volker indicates here that small profit per trades (0.2%) could be realised by hedge funds that have day trading desks:
https://youtu.be/pY95U-8UbEA?si=VqOrmMBzbY517w2v&t=2699
I had the same thought: because as I am staging the results from this dip buyer in the quotes window, I could remove these sharply falling stocks (like EE) manually. ie. Not take the trades.
(BTW I did not know Volker was a founder until I read this just recently: https://www.turtletrader.com/wealth-lab/ I put more transaction weight on Volkers' comments now :D.)
It seems like a dip buyer with a 1 day hold period is difficult to backtest/model since the limit order entry is operating at/near intraday timeframes. Maybe it would be better back testing with intraday data?
My other thoughts to more accurately back test this and get more realistic simulation results were to decrease the positions size dramatically to take in all trades/reduce NSF positions.
My thoughts to deal with a trade like EE, would be to use Maximum Adverse Excursion (MAE) to try to mitigate it.
I tried MonteCarlo analysis and determined that the results do seem stable. No big clues there.
Once I get more data I may import the trades for analysis within Wealth Lab itself. I understand that is possible.
And finally, would it be possible to get a follow-up video on dip buyers as alluded to here? :
https://youtu.be/Yyny4_38UVE?si=ZoZYMApuAwe_0kum&t=380
I notice dip buying and limit order buy strategies appear quite often in Wealth-lab Videos. Part of the reason I chose to take one for a spin.
Rename
Backtesting strategies that use Limit orders, dip-buyers especially, are sensitive to data spikes that create trades that could never be filled in real life. Our Wealth-Data DataSets go a long way in reducing these trades in backtests. It's discussed here with examples: https://www.wealth-data.com/faq
Still it can happen that even when Auto-Trading with the Quotes tool, the market moves too quickly to get filled. It happened once to me last week - but I was using TDAmeritrade, which I've seen take up to 10 seconds to activate an order. (IB activates API orders nearly instantaneously.) Even though I don't do it, this would be one reason to use a Threshold less than 100% so that the order is triggered before the limit/stop price is reached.
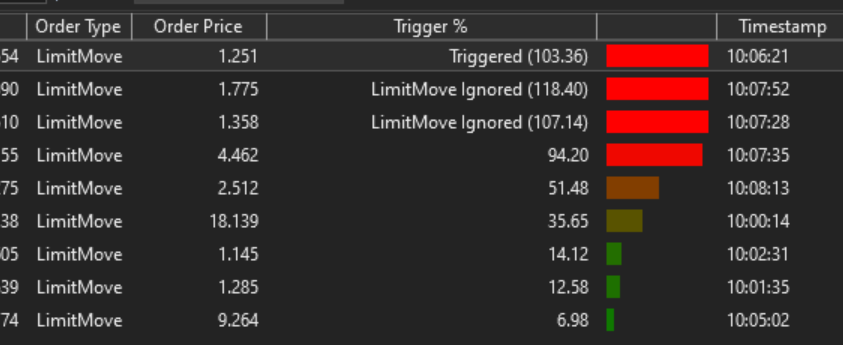
As for the trades like EE -13%, you can try using WealthLab's LimitMove signal to filter out trades when the market Opens below your limit price. It works for backtesting and with the Quotes tool for live trading. It's certainly effective - but you'll also find that many of those trades you filtered turn out to be outsized winners.
Finally, it's amazing how many times your Limit order will be precisely the Low price of the day, but your order doesn't get filled. You can simulate this in a backtest by applying Limit order slippage in your Backtesting Preferences. Just note that slippage always works against you in backtesting, whereas in real life it's more of a split 75/25?
Backtesting isn't going to be perfect simulation for these and other reasons. Electronic paper trading gets you a step closer... and then nothing's like having real skin in the game. Let's see VR do that!
Still it can happen that even when Auto-Trading with the Quotes tool, the market moves too quickly to get filled. It happened once to me last week - but I was using TDAmeritrade, which I've seen take up to 10 seconds to activate an order. (IB activates API orders nearly instantaneously.) Even though I don't do it, this would be one reason to use a Threshold less than 100% so that the order is triggered before the limit/stop price is reached.
As for the trades like EE -13%, you can try using WealthLab's LimitMove signal to filter out trades when the market Opens below your limit price. It works for backtesting and with the Quotes tool for live trading. It's certainly effective - but you'll also find that many of those trades you filtered turn out to be outsized winners.
Finally, it's amazing how many times your Limit order will be precisely the Low price of the day, but your order doesn't get filled. You can simulate this in a backtest by applying Limit order slippage in your Backtesting Preferences. Just note that slippage always works against you in backtesting, whereas in real life it's more of a split 75/25?
Backtesting isn't going to be perfect simulation for these and other reasons. Electronic paper trading gets you a step closer... and then nothing's like having real skin in the game. Let's see VR do that!
QUOTE:
APR: is in the too good to be true range.
This is indeed a serious problem which undermines confidence in backtest results of limit order systems.
One method to tackle the problem (or at least determine the amount of "error" more precisely) is Granular Processing which is explained in this video:
https://www.youtube.com/watch?v=TajAJ4htNb0&t=250s (Wealth-Lab 7 - Build 7 Highlights, start at 250s)
Granular Processing requires intraday data and produces rather reliable results.
For limit order strategies running on daily data results with Granular Processing are usually way worse than the reults shown after a backtest without Granular Processing.
Te reason is unclear to me.
Of course this does not mean that Granular Processing is flawed. It means that our usual backtest on daily data produces results that are (way) too optimistic.
So the question arises: What is wrong here?
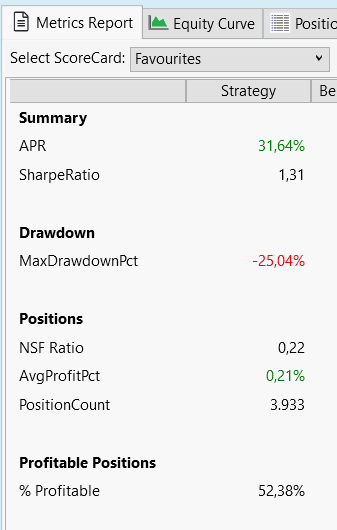
I made a backtest on EOD data with the "OneNIght" (published) strategy.
Just 14 symbols, pos.size 15% of equity:
Same backtest with Granular Processing (1-Min Intraday Data available):
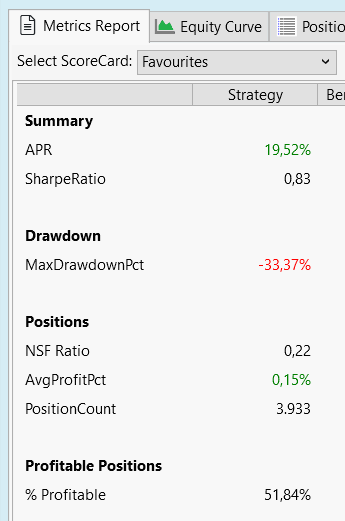
Big difference!
There is the idea, that early trades are bad and these are picked in realtime trading (or a backtest with granular processing).
And an EOD backtest would pick trades randomly, i.e. later trades on average.
To check the hypothesis that early trades are worse than later trades I used ScottPlot to produce this plot:
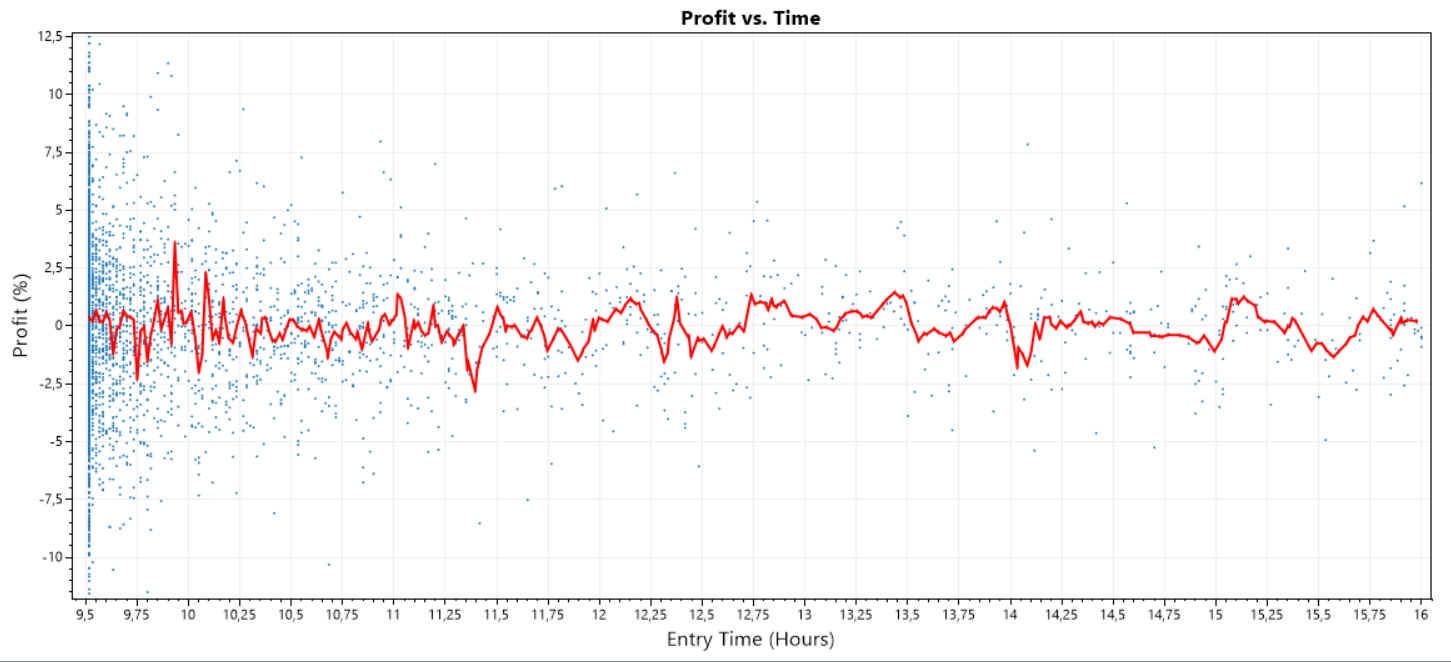
Each dot is a trade. X-Axis show entry time in hours (9.5 is 9:30). Y-Axis shows profit in percent.
The red line (Average Line) is a centered moving average. There is no obvious deviation form zero visible with the red line. Here is the sane plot but zoomed around 9:30. (This one needs the finantic.InteractiveGraphics extension):
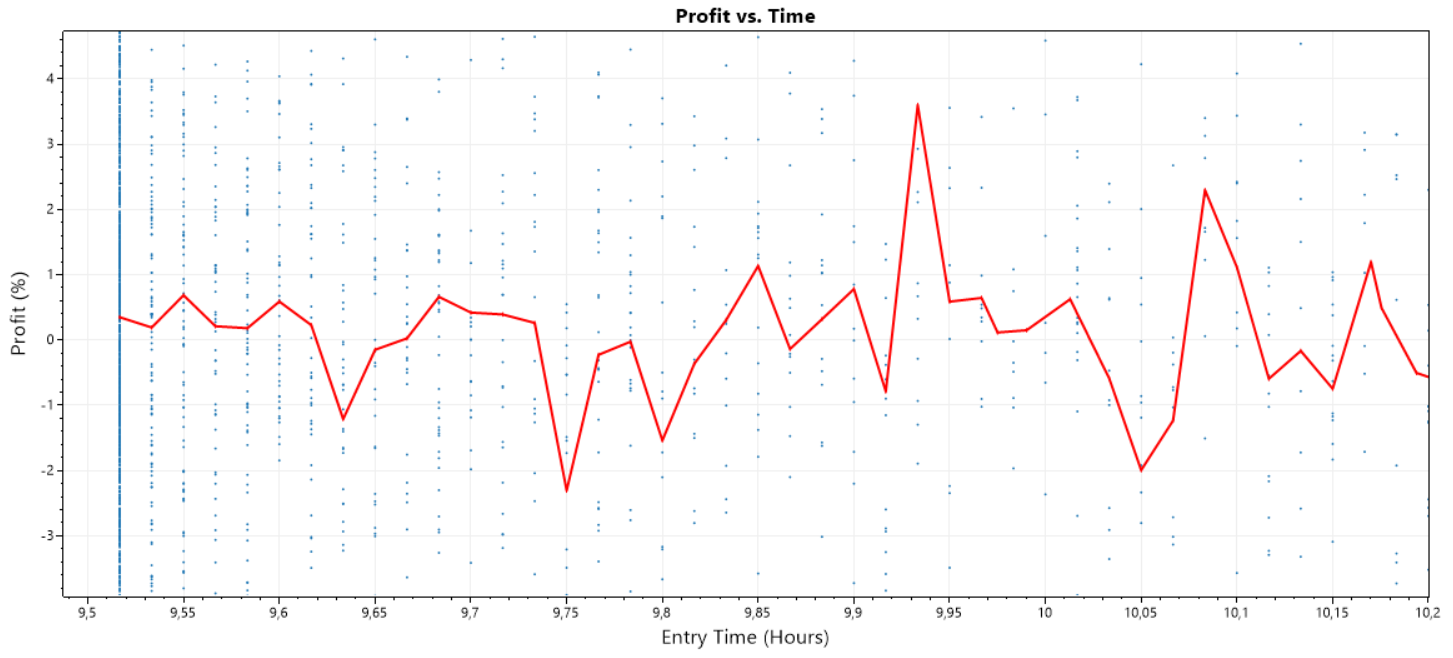
The red line is close to zero. This means: on average the early trades are just as good (or bad) as the later trades. Hypothesis discarded.
Something else must be wrong!
Ideas? Suggestions anyone?
Just 14 symbols, pos.size 15% of equity:
Same backtest with Granular Processing (1-Min Intraday Data available):
Big difference!
There is the idea, that early trades are bad and these are picked in realtime trading (or a backtest with granular processing).
And an EOD backtest would pick trades randomly, i.e. later trades on average.
To check the hypothesis that early trades are worse than later trades I used ScottPlot to produce this plot:
Each dot is a trade. X-Axis show entry time in hours (9.5 is 9:30). Y-Axis shows profit in percent.
The red line (Average Line) is a centered moving average. There is no obvious deviation form zero visible with the red line. Here is the sane plot but zoomed around 9:30. (This one needs the finantic.InteractiveGraphics extension):
The red line is close to zero. This means: on average the early trades are just as good (or bad) as the later trades. Hypothesis discarded.
Something else must be wrong!
Ideas? Suggestions anyone?
It is rather simple to produce the plots shown above because Granular Processing adds the entry time to the Position List:
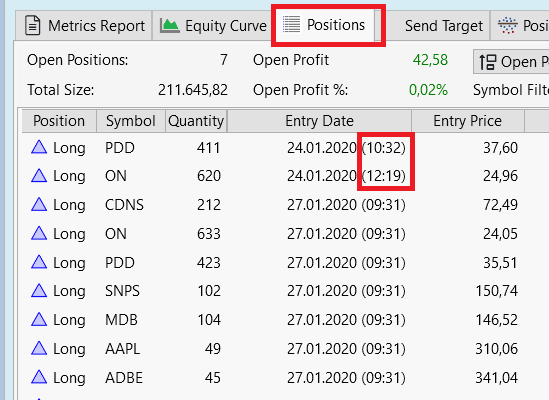
A very welcome feature!
A very welcome feature!
Does the difference between granular processing and EoD trading still exist if there are no NSF positions? Honestly, I would think any differences would average out.
QUOTE:For a backtest with 0 NSF Positions, the results will not change with granular processing.
Does the difference between granular processing and EoD trading still exist if there are no NSF positions?
"Granular" assigns Transaction.Weight by the time of day for the first granular bar where a limit or stop order would have occurred.
Earlier times are given a value with higher priority, so those trades are processed first.
QUOTE:
you can try using WealthLab's LimitMove signal
Thanks for that tip Cone. Got it working by effortlessly converting the strategy to a C# one and changing OrderType.Limit to OrderType.LimitMove. Will add C# coder to my resume now ;).
Perhaps LimitMove could be added to the buy at limit or stop building block so user does not have to resort to code for this order type change.
So LimitMove worked exactly as intended in live trading.
Avoided a ~5% loss on the first day implemented. However dip buying strategy still performing very poorly compared to back testing though. The experiment continues...
QUOTE:Blocks will never be "limitless" like C# code. This seems reasonable though, so we can study it to see if adding that OrderType would have any negative effects to that block.
so user does not have to resort to code
To find out more about this effect I did the following:
Run a backtest with granular Processing and the Performance Visualizer "Periodic Returns". here I seleceted Analysis Period: Daily and copied the data (daily Returns) to Excel.
The same without Granular Processing (i.e. a good old EOD backtest).
Then, in Excel, I calculated the daily profit differences and created a plot: Looks like this:
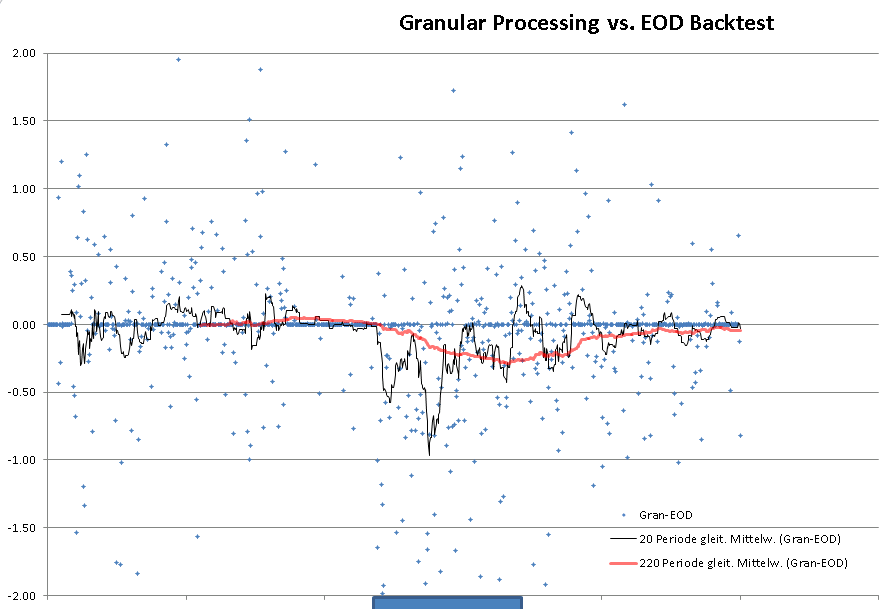
An image says more than a thousand words.
Every blue dot is a day.
X-Axis is 2020-01-01 to 2023-12-31
Y-Axis is difference in Profit at that day between Granular Processing and EOD backtest
Black and Blue lines are moving averages of 20 days and 220 days respectively.
(The moving averages are not centered but shifted by 10 and 110 days, a weakness of Excel)
It is obvious that there are big systematic differences between Granular Processing and EOD backtest. But to my big surprise these differences happen mainly between 2021-12-01 and 2022-09-01 (blue rectangle on X-Axis)
Looks like the plot struggles with Long Covid....
Very strange!
Run a backtest with granular Processing and the Performance Visualizer "Periodic Returns". here I seleceted Analysis Period: Daily and copied the data (daily Returns) to Excel.
The same without Granular Processing (i.e. a good old EOD backtest).
Then, in Excel, I calculated the daily profit differences and created a plot: Looks like this:
An image says more than a thousand words.
Every blue dot is a day.
X-Axis is 2020-01-01 to 2023-12-31
Y-Axis is difference in Profit at that day between Granular Processing and EOD backtest
Black and Blue lines are moving averages of 20 days and 220 days respectively.
(The moving averages are not centered but shifted by 10 and 110 days, a weakness of Excel)
It is obvious that there are big systematic differences between Granular Processing and EOD backtest. But to my big surprise these differences happen mainly between 2021-12-01 and 2022-09-01 (blue rectangle on X-Axis)
Looks like the plot struggles with Long Covid....
Very strange!
Post #9 seems misplaced - like it should be part of another thread.
QUOTE:
seems misplaced
No.
It is all about the exceptional performance of Dip-Buyers aka limit order strategies.
And why this performance is not real.
Post #9 uses Granular Processing to quantify the differences between a "normal" backtest (which is way too optimistic) and the same backtest with activated Granular Processing (which is rather realistic)
QUOTE:
So the question arises: What is wrong here?
I have been experimenting with different parameters in the limit buyer dip system to answer this question. Also been trading it live with a tiny account. Had a quick muck about with the OneNight system also.
I don’t have access to intraday data for the ASX (AU) so I have no experience yet with granular processing. I will look at granular processing at some point.
Difference between back testing and real world could be:
1. Data quality
2. NSF. The more this is reduced the worse the system performs. There seems to be a bias towards losing positions in the NSF trades.
3. Slippage on the sell side may be huge.
4. An unidentified sampling bias
5. ...and a dozen others.
The observations from Cone that the market moves too quickly for limit orders to be filled limit buyers (in practice) have proven accurate:
I have also noticed in practice that the buying power is not always maximised in the quotes and price trigger tool since orders that are not filled stay active and reduce buying power of subsequent triggers.
I also have a transaction weight based on a higher stock price (ie not-penny stocks). This has no basis in the real world since the dip buyer buys whatever stock hits the -3% mark first. I may have to remove that weight.
Next steps are to increase the filter parameters on stock liquidity to try to improve the chances of limit orders getting filled. I will also try backing off the dip buying from what is optimal (3%) to what is realistic (2.8%). I will also keep adding filters until the NSFs are near zero.
I have been looking at and understanding the charts being posted in this thread, but alas I don't have any insightful ideas as to the underlying causes.
So apologies I cannot answer “What is wrong here?” I have after all, only been using the software for 3 weeks!
QUOTE:Definitely. For a limit system, there's really no place for weights to be used that way except to keep a single backtest results from changing.
I may have to remove that weight.
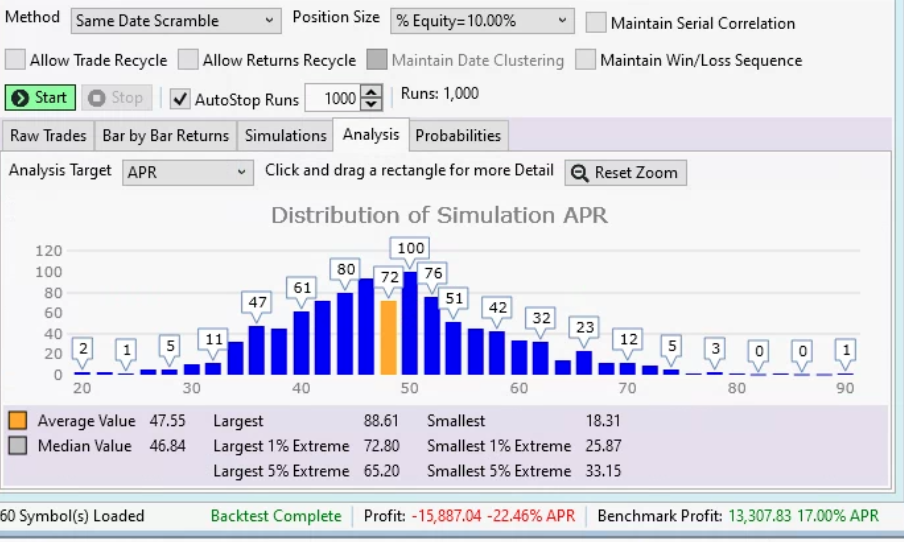
To see a distribution of outcomes using all the trades (NSF too) in a backtest, use Monte Carlo-Lab. For dip buyers, the Same-Date Scramble will mix the trades a backtest tests on days that NSFs occur.
I asked a question on another post that was very similar to this topic. It was my understanding that doing a Monte Carlo analysis using Same Date Scramble should give an accurate representation of a system like this (I've been running a dip buyer for 2 months that exits after one day). I haven't found the Same Date Scramble to give remotely accurate results, in fact they seem even more optimistic than my backtests. I'm not sure why the Same Date Scramble isn't working for this?
To the OP, my wildly optimistic system backtest and optimization looked horrible once I got access to intraday data. and did granular processing. In real life I'm up a couple percent, but nowhere near where my backtest says I should be. I just don't understand why the Monte Carlo isn't showing these poor results as a possibility?
To the OP, my wildly optimistic system backtest and optimization looked horrible once I got access to intraday data. and did granular processing. In real life I'm up a couple percent, but nowhere near where my backtest says I should be. I just don't understand why the Monte Carlo isn't showing these poor results as a possibility?
QUOTE:
To see a distribution of outcomes using all the trades (NSF too) in a backtest, use Monte Carlo-Lab. For dip buyers, the Same-Date Scramble will mix the trades a backtest tests on days that NSFs occur.
The problem is Same Date Scramble isn't giving accurate assessments compared to granular backtesting or live trading. See example below show granular backtest results at the bottom versus the monte carlo
granular backtest -22.46% apr, lowest result of 1000 runs 18.31%
whole strategy posted here: https://www.wealth-lab.com/Discussion/Why-are-backtest-results-of-a-dip-buyer-strategy-so-different-with-Granular-Processing-10739
Your test uses "Current & Past S&P 600 Small Caps" for the last 24 months.
Where are you getting intraday data for all the symbols that have been delisted from that index?
In that DataSet for stocks that have history after 2021, 144 companies are delisted. Another 1000 of them are still trading.
It's not really a valid comparison, although the delisted stocks for which you have no intraday data would be put at the end of the queue.
QUOTE:
Your test uses "Current & Past S&P 600 Small Caps" for the last 24 months.
Where are you getting intraday data for all the symbols that have been delisted from that index?
In that DataSet for stocks that have history after 2021, 144 companies are delisted. Another 1000 of them are still trading.
It's not really a valid comparison, although the delisted stocks for which you have no intraday data would be put at the end of the queue.
I was assuming the intra-data for those symbols would be pulled from EODHD which is my intra-day provider, I'm assuming that is incorrect? Also, my backtest loads 760 symbols so I'm assuming thats 600 still in the SP600 and 160 that are no longer in the index?
What does this mean for the usefulness of Granular Scale Backtesting? Should it only be done on a stable listing of stocks with no members coming or going?
I would think that if I wasn't getting data for symbols that were delisted from the index, those would be symbols most likely to perform poorly anyways and the granular backtest should be higher?
QUOTE:
I was assuming the intra-data for those symbols would be pulled from EODHD which is my intra-day provider, I'm assuming that is incorrect?
Have you checked EODHD's website for presence of data for the delisted symbols? I mean, your subscription might not include it and/or they may not have the data available?
QUOTE:It's always meant that you need the intraday granularity to do the test. If you don't have the data, those symbols automatically go to the back of the line.
What does this mean for the usefulness of Granular Scale Backtesting?
And, while Norgate data allows you to test survivorship free, it's not Wealth-Data. You're testing with all the outlier ticks/trades that you would unlikely be able to filled live.
Wealth-Data is definitely the best for a more realistic backtest for a Limit/Stop system, but it's limited to the large cap indices. If you want to compare live trading, with a granular backtest, do it with Wealth-Data.
Here's an example of an Quotes-triggered Auto-Trade I missed today. This order at 509.13 is live at TDA -
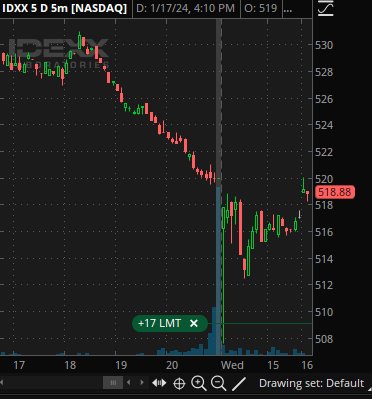
Look at how this occurred. Below, at 09:30:27 a large group of a full-lot and old-lot trades occurred (and many more not shown). Because the 3 around $507.61 were full-lot trades, so these will show up in all charts, with a 507.605 low, which is the low of the day (so far). To have been filled the order would have already had to be live with FINRA.
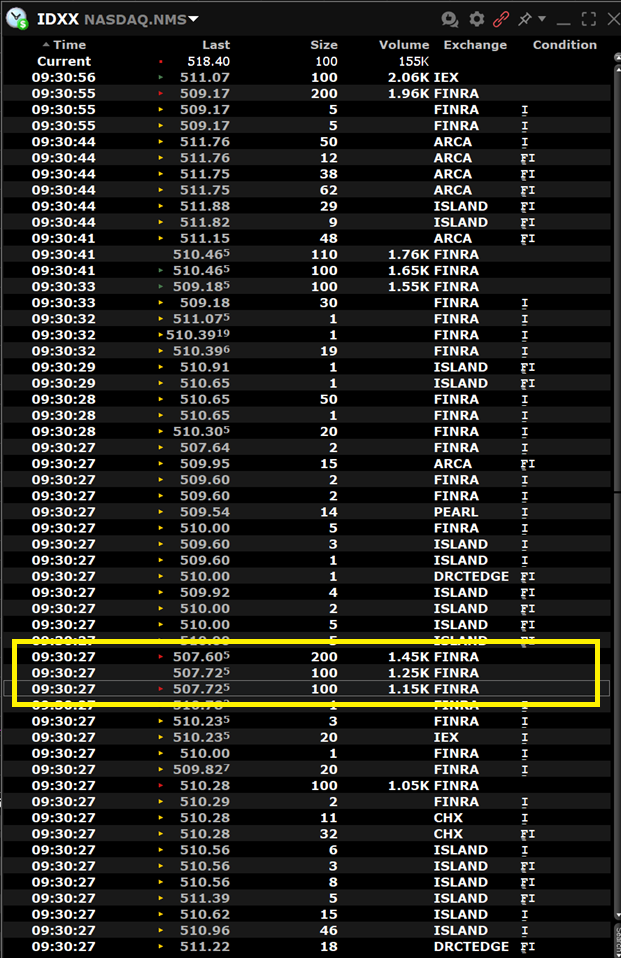
After Wealth-Data runs its statistical filter tonight, we'll see if these trades show up as the low. The market was trading at the $510 level, but because there were more than 2 full-lot trades at that level, there's actually a fair chance that even Wealth-Data will report a 507.605 low.
Look at how this occurred. Below, at 09:30:27 a large group of a full-lot and old-lot trades occurred (and many more not shown). Because the 3 around $507.61 were full-lot trades, so these will show up in all charts, with a 507.605 low, which is the low of the day (so far). To have been filled the order would have already had to be live with FINRA.
After Wealth-Data runs its statistical filter tonight, we'll see if these trades show up as the low. The market was trading at the $510 level, but because there were more than 2 full-lot trades at that level, there's actually a fair chance that even Wealth-Data will report a 507.605 low.
Your Response
Post
Edit Post
Login is required