Sometimes you may need to look at this type or equity curve (fixed profit/loss equity). It also may be useful to compare them for some cases.
Rename
I had already started adding a Closed equity option to the Equity Curve visualizer but postponed it due to lack of demand. Let's see if this request gets some following. Note that closed equity is computationally intensive even with formula tweaks and can slow down intraday backtests.
From what I read:
“Closed equity: The value of your trading account without open profits/losses. This is the amount of money you have in your account. It shows the development of your closed trades.”
Isn’t this the same as our Cash Curve?
“Closed equity: The value of your trading account without open profits/losses. This is the amount of money you have in your account. It shows the development of your closed trades.”
Isn’t this the same as our Cash Curve?
QUOTE:
“Closed equity: The value of your trading account without open profits/losses. This is the amount of money you have in your account. It shows the development of your closed trades.”
Isn’t this the same as our Cash Curve?
I think no.
I mean this:
- first candle - starting capital.
- second candle if any position closed on it - starting capital + total closed positions profit.
- third candle - if no closed positions here - previous value.
- fourth candle - if no closed - previous value (even if there are positions being open).
- fifth candle - if 1 position closed on it - previous value + profit of this position.
Actually, I don't know what kind of computationally intensiveness Eugene is talking about, as I think of it as a:
All positions sorted by exit date, then getting expanding sum - and then plot it. Maybe some extra calculations are needed in WL7, but in Python it would be very fast)).
So you ignore the day to day fluctuations of the open positions? Sounds like not very intensive to calculate.
QUOTE:
So you ignore the day to day fluctuations of the open positions? Sounds like not very intensive to calculate.
Something like this.
When looping bar by bar, the nested loop by all positions (sorted by exit date) makes the closed profit calculation slow in any language. Fortunately, in MS123 Visualizers for WL6 the algo was optimized so one could have a chance to notice some slowdown in intraday backtests with large number of positions only.
I think we can optimize that, much like i did for the By Symbol also in the recent build.
But I'm having trouble understanding what the practical benefit of this request is? I can't imagine ever wanting to see the equity curve that way. What is the appeal?
The exact trigger to post this request was:
I use some kind of positions' post processing using Python scripts. I tried to compare WL7 equity curve to the one inside my script to make sure I didn't make an error. So I couldn't do that as I use this close method and you do not.
In more common sence, something like: this type of equity curve is a representation of positions'results. So it's a visual instrument to see/control of what's going on with positions'results. Falling equity will tell you undoubtedly about negative trades. You may also compare these two curves - I think a large deviation is reason to think about more efficient trailing or something.
ok, fair enough.
If you have any good web pages describing or illustrating this paste them here too.
Suggestion with respect to time-loss in sorting, lopping etc:
Perhaps this could be a user preference to include or not (for backtest or optimizations).
If selected then show/enable the additional checkbox on the Equity visualiser tab - otherwise leave it diabled.
That would retain optimal speed for those who don't require the additional calcualtions.
Perhaps this could be a user preference to include or not (for backtest or optimizations).
If selected then show/enable the additional checkbox on the Equity visualiser tab - otherwise leave it diabled.
That would retain optimal speed for those who don't require the additional calcualtions.
QUOTE:
If you have any good web pages describing or illustrating this paste them here too.
Our own Wiki page for WL6:
http://www2.wealth-lab.com/WL5WIKI/PVClosedEq.ashx
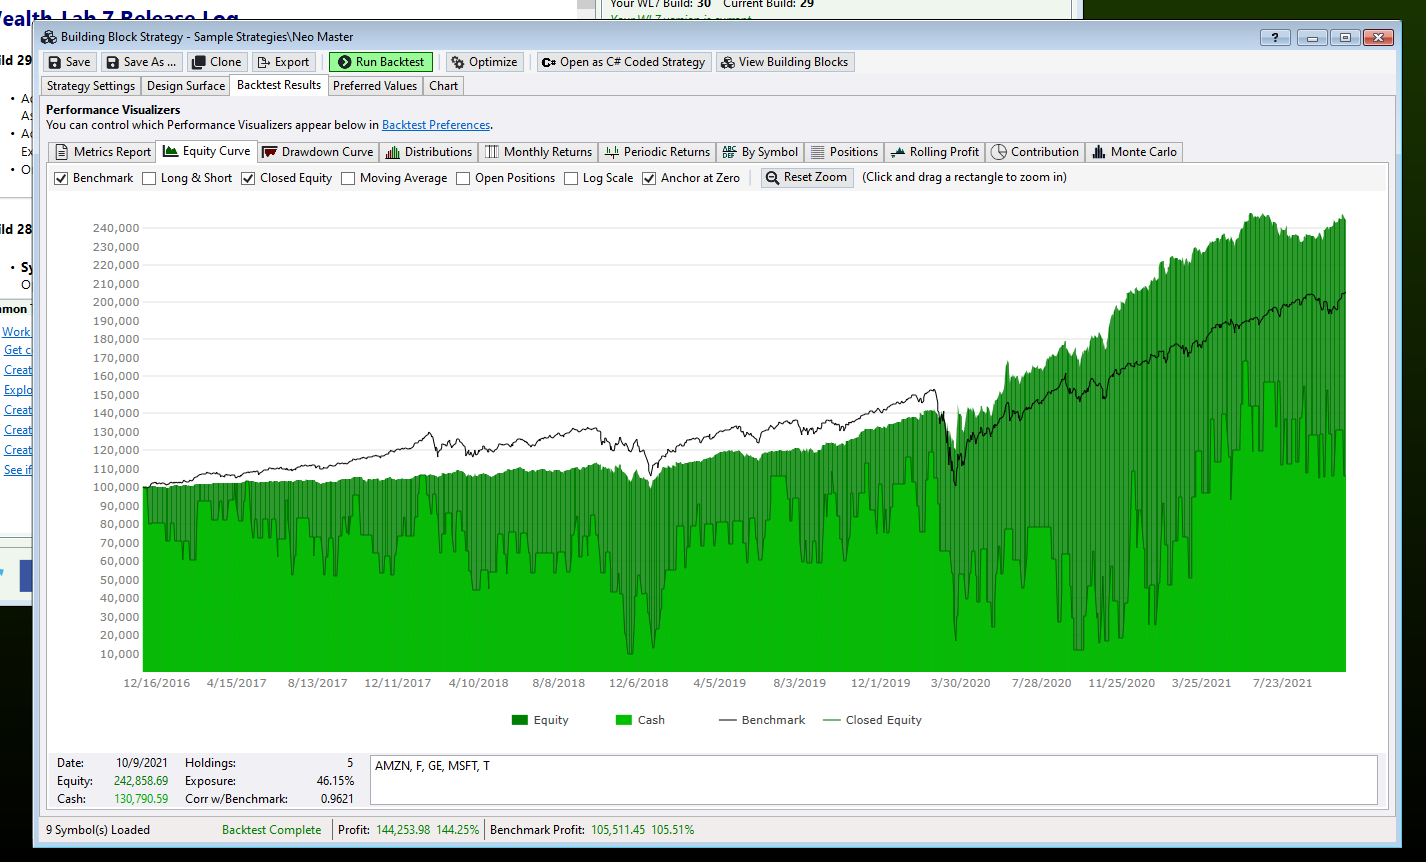
The screenshot illustrates Replikant's idea quite graphically: "You may also compare these two curves - I think a large deviation is reason to think about more efficient trailing or something."
Activating the item.
Check out B29 for closed equity curve and see if you cand find something - almost sure you can :)
Personally I think it should be rendered as a line over the current equity curve.
QUOTE:
Check out B29 for closed equity curve and see if you cand find something - almost sure you can :)
Mmm, adding a bit of gamification))).
QUOTE:
Personally I think it should be rendered as a line over the current equity curve.
Agree!
And this new color (blue? green?) does not fit the other two in my opinion.
I would also like to turn on/off equity, closed equity, cash independently. But of course it's not something you can't live without).
If you think there are too many checkboxes) - I think MA one is a bit usless with this fixed rolling window size.
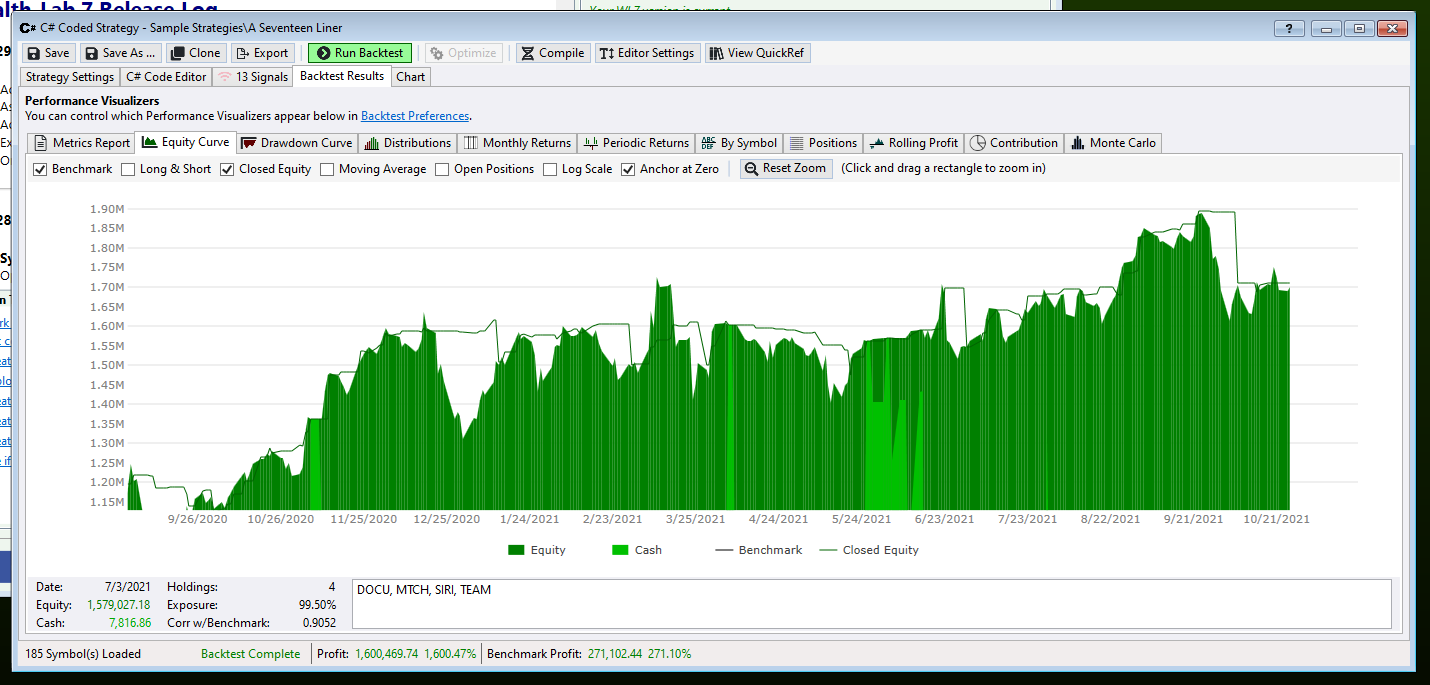
I'm having a really hard time understanding how Closed Equity is any different than what we depict as the Cash Curve in the Equity Curve. Ive optimized the calculation, and from what my undersatand of Closed Equity is, the result is matching the Cash Curve 100%. Note that this is different than the Closed Equity in Build 29, which I feel is faulty. Replikant, can you show my a picure of how closed versus normal equity would look for a single trade according to your understanding? Note that the Cash Curve, and the Closed Equity depicted below, follow your rules from Post #3.
With its short plateaus, the Cash curve's shape resembles the original idea expressed in particular on this screenshot from version 6. Something that I couldn't reach in V7 with the same algo:
http://www2.wealth-lab.com/WL5WIKI/GetFile.aspx?File=Community.Visualizers%2fPVClosedEq.PNG
Additionally, unlike the Cash curve which accounts for margin interest and dividends, the Closed equity doesn't do this.
http://www2.wealth-lab.com/WL5WIKI/GetFile.aspx?File=Community.Visualizers%2fPVClosedEq.PNG
Additionally, unlike the Cash curve which accounts for margin interest and dividends, the Closed equity doesn't do this.
QUOTE:
I'm having a really hard time understanding how Closed Equity is any different than what we depict as the Cash Curve in the Equity Curve. Ive optimized the calculation, and from what my undersatand of Closed Equity is, the result is matching the Cash Curve 100%. Note that this is different than the Closed Equity in Build 29, which I feel is faulty. Replikant, can you show my a picure of how closed versus normal equity would look for a single trade according to your understanding? Note that the Cash Curve, and the Closed Equity depicted below, follow your rules from Post #3.
Something like this maybe?
Thanks, that clears things up.
But I still cannot fathom what value this brings to the table. So if a buy a position at the beginning of the equity curve and it then tanks to near zero but i still hold it, my closed equity is somehow still my stating capital? Are there any articles anywhere that explains how such a closed equity is useful for analyzing a trading system?
There are other questions too, like what to do with dividends? I suppose they get added to closed equity as they occur?
There are other questions too, like what to do with dividends? I suppose they get added to closed equity as they occur?
I'm feeling that a Closed Equity line isn't providing any more information than WL7's existing Cash Curve. Maybe Closed Equity was a "feature" or products or frameworks that don't offer the detailed Cash Curve of WL7, which gives you a true picture?
And here, I did find one article referencing Closed Trade Equity Curve. It's using a definition different than the one you supplied. It looks like a graph of trades along the X-Axis (closed trades only) and equity along the right.
According to this, it should be it's own Visualizer, not superimposed over the existing Equity Curve.
https://kjtradingsystems.com/EquityCurveAnalysis.pdf
According to this, it should be it's own Visualizer, not superimposed over the existing Equity Curve.
https://kjtradingsystems.com/EquityCurveAnalysis.pdf
It's not about why do you need these two types of equities maybe... but if you close position near zero you will be able to open long of 10 times smaller quantity maybe, but if you stay in the position you will stay the same size. So restoring price will fully restore your equity in the second example, but will restore only 10% if your size is 10 times smaller. So if you see normal equity that dip and then restoring - you don't actually know whether it's more like first case or second. Maybe this example looks being far from practical)). Closed equity curve was the only type I used when I was using my own python framework. So real profit of having these two types together is just to be discovered)).
P.S. Closed equity curve is a good way of selling your martingale strategies))).
P.S. Closed equity curve is a good way of selling your martingale strategies))).
See my comment above -
QUOTE:
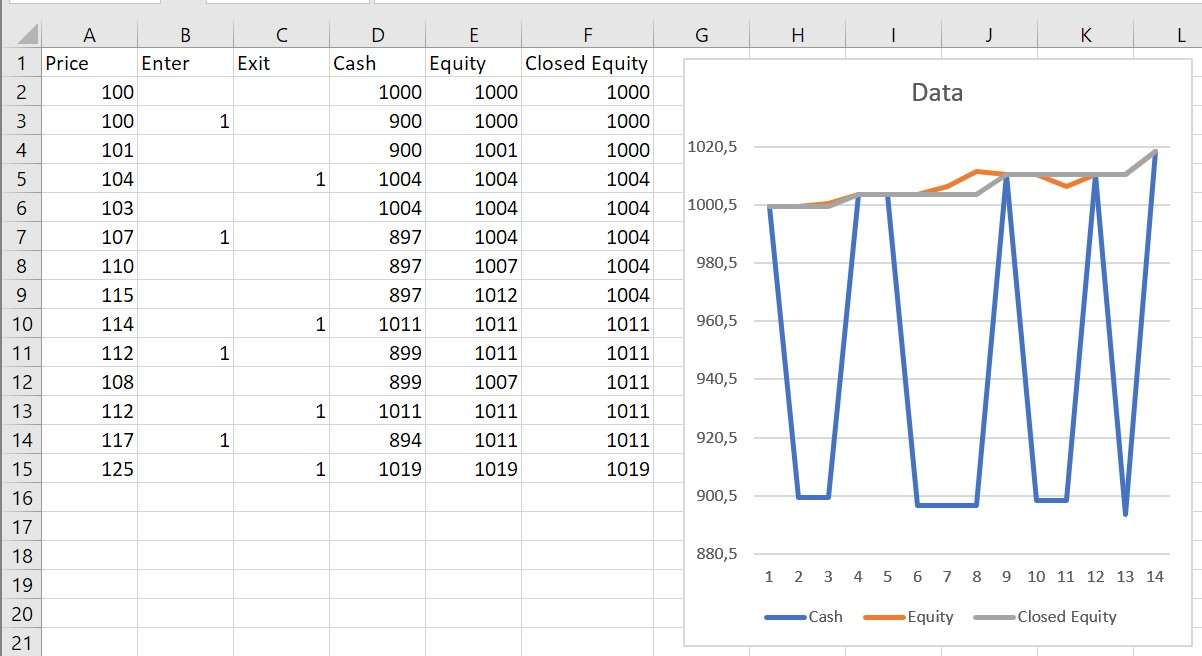
And here, I did find one article referencing Closed Trade Equity Curve. It's using a definition different than the one you supplied. It's just a normal bar by bar equity curve, but including only the closed trades in the results. Open trades are simply ignored:
Isn't my Excel example stating the same? You add trade result after it's closed.
Also, can you send me the link to the Python package that generates Closed Equity that you used?
You Excel example has the X-Axis progressing bar by bar. Not that big a deal I guess but just a different way to visualize.
QUOTE:
Also, can you send me the link to the Python package that generates Closed Equity that you used?
I didn't use some kind of trading framework, but my own. It uses just Pandas framework (it's not about trading, just tables).
Here is an example of how I did it. Closed trades list is the source for this kind of equity.
https://colab.research.google.com/drive/1crp-JaY6amk1JyQFY3e_QX2ujbvqJBfS?usp=sharing
Actually I'm not good at low level for this topic, I prefer something simple, my first equity didn't have datetime X, just expanding sum of trade results).
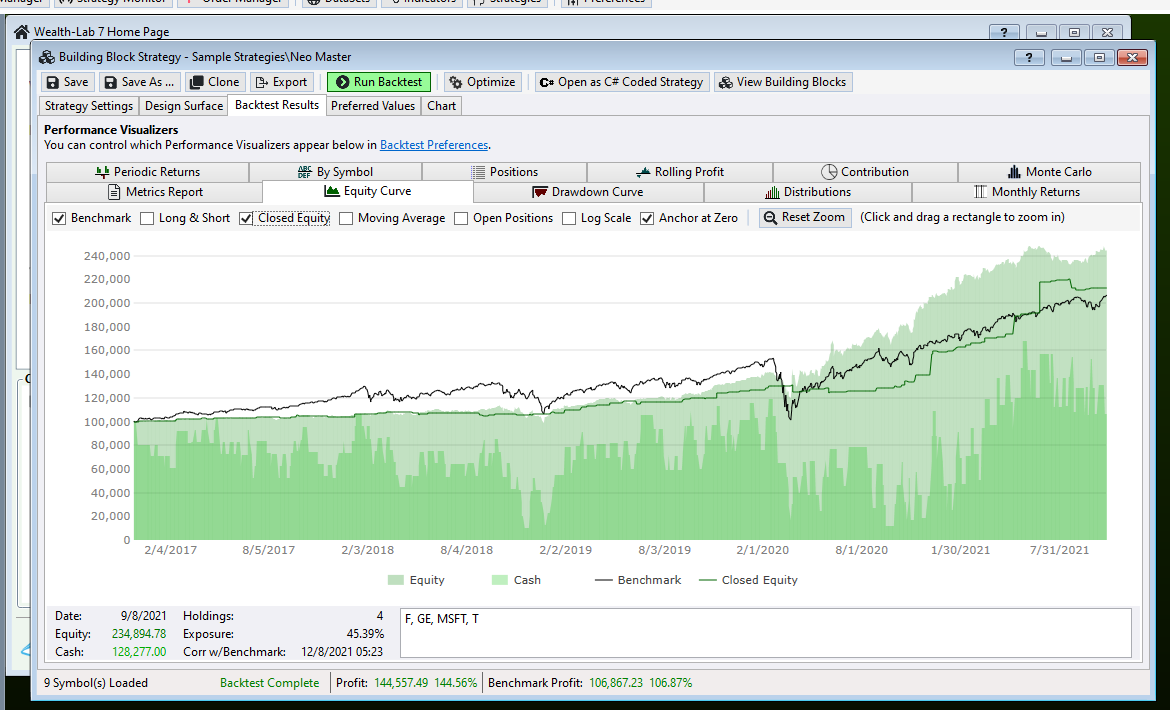
OK, here's how it's looking for Build 30 - should be right on the money, and fast!
Nice. Maybe you could give it more contrast for when equity is higher then closed equity?
P.S. I've remembered another possible case - matching real trading result with backtest results. You will use your real trades'results in this case so closed equity will be more helpful.
P.S. I've remembered another possible case - matching real trading result with backtest results. You will use your real trades'results in this case so closed equity will be more helpful.
I don't think Closed Equity has anything to do with real trades vs backtest results. The Closed Equity trades are still backtest results.
I'm making it so that the normal equity curve gets dimmed out when you enable Closed Equity ...
I'm making it so that the normal equity curve gets dimmed out when you enable Closed Equity ...
QUOTE:
I'm making it so that the normal equity curve gets dimmed out when you enable Closed Equity ...
Great!
QUOTE:
I don't think Closed Equity has anything to do with real trades vs backtest results. The Closed Equity trades are still backtest results.
Why not? You got your real trades results, you may easily plot your equiry curve, you can use this curve and WL7 closed curve for visual matching. If you use visual matching for this.
It's out of scope for the Equity Curve Visualizer. It's intended to visualize a backtest result. Adding your actual trades here was never intended or suggested. We have a separate feature request open around loading your actual trades for analysis into WL7.
Furthermore, no we don't have the actual trade results. To do that we'd need support from the broker APIs to return a HISTORY of placed trades. Some brokers may offer it, some not, but it's not built into our framework at all at this stage.
Furthermore, no we don't have the actual trade results. To do that we'd need support from the broker APIs to return a HISTORY of placed trades. Some brokers may offer it, some not, but it's not built into our framework at all at this stage.
No-no, I'm not talking about anything like this. WL7 is to show backtest equity only. Real trades equity curve is somewhere in another place).
But it would be great to have this inplace in the future). Like you backtest, analyze backtest results, trade, control that trade results match backtest results, control and analyze real trades results and all of this withing WL7 - would be great.
Your Response
Post
Edit Post
Login is required