I need to reinstall Windows on one of my computers with WL8. I was able to successfully backup/copy over the Strategy folders from this computer to another computer with WL8 and they open/run just fine. However when I try to do the same thing with the files in the Workspaces folders they will not open on the 2nd computer. I'm just trying to make sure I don't lose anything and can easily restart using WL8 after I do the fresh Windows install. Is there a proper workflow I can follow to save/restore my Workspaces before reinstalling Windows 11?
Rename
Are all of your Strategies copied over just like on the original machine?
Correct. The Strategies folder files are all working fine.
I can explain a bit further about the workspaces that are not working when I copy them over:
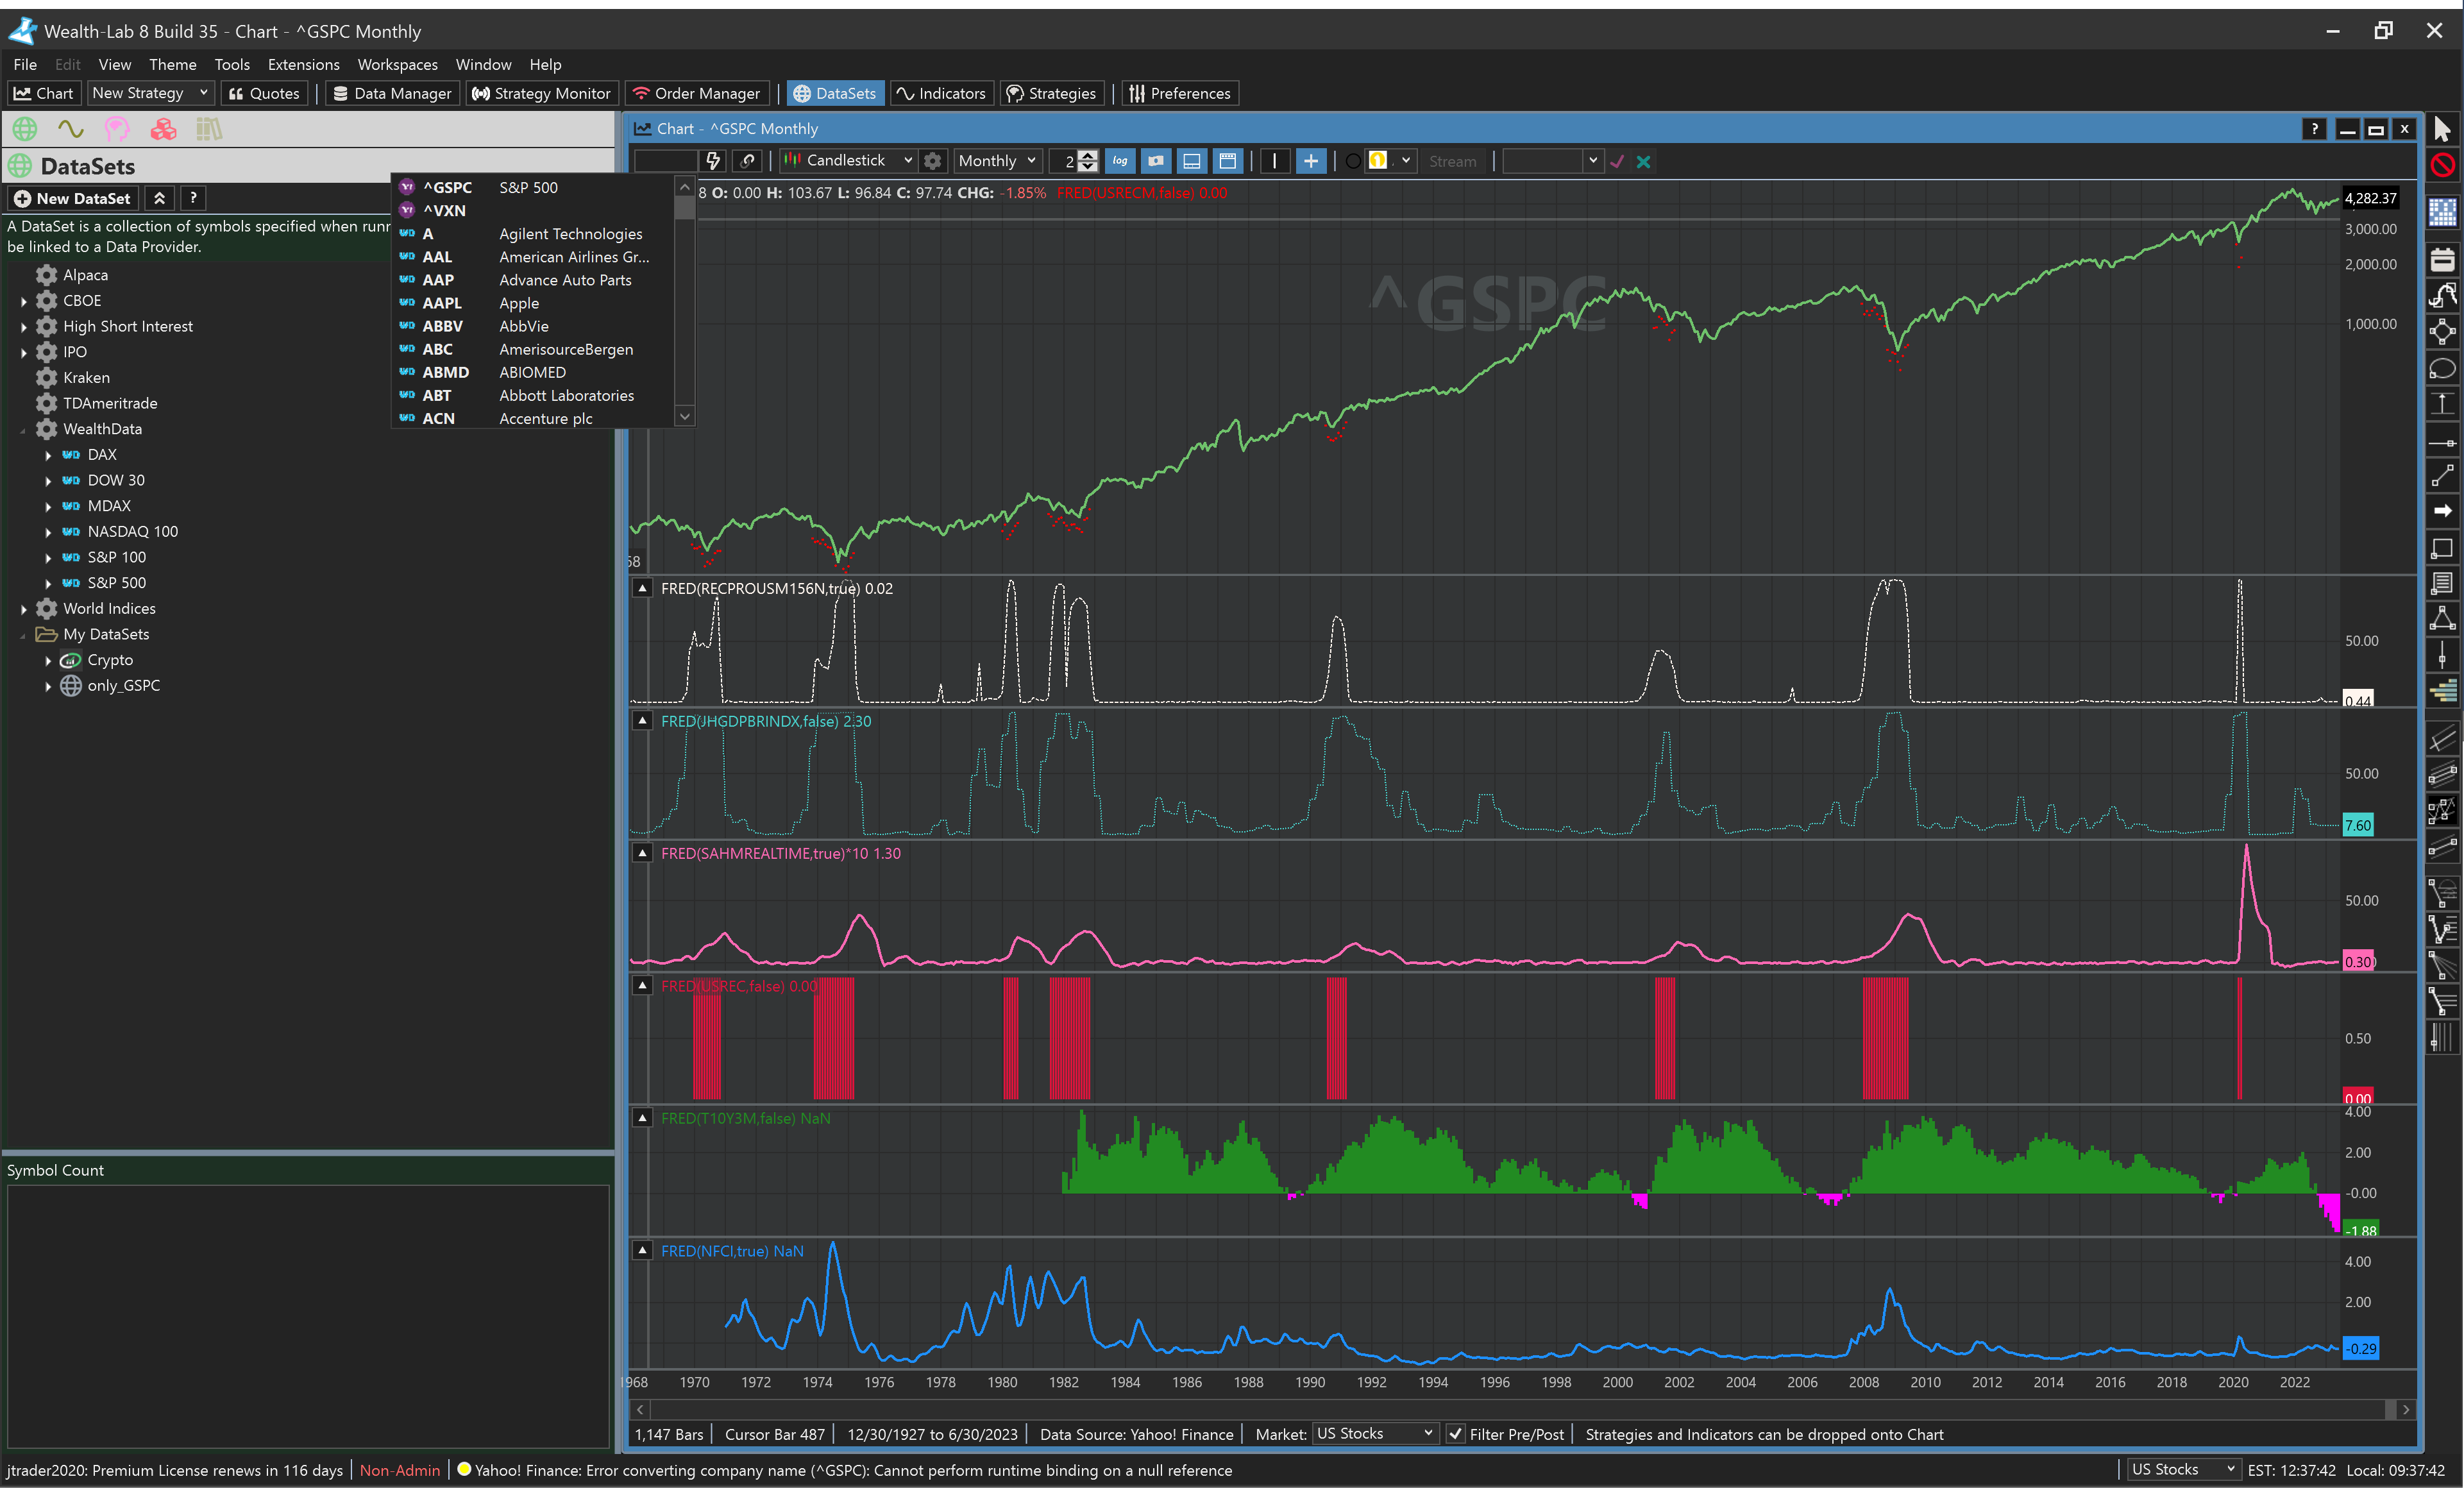
There are only about 5 or 6 of them that I mostly care about. Since there is no way to easily just save a Chart with some subplots, I use Workspaces for this. So the Workspace really is just a chart of ^GSPC or SPY with some subplots (FRED data and some "rolling" calculations on the FRED data) and a couple indicators on the chart of the ticker. If you'd like a screenshot, let me log into this thread from that computer and I'll try to post a pic.
I can explain a bit further about the workspaces that are not working when I copy them over:
There are only about 5 or 6 of them that I mostly care about. Since there is no way to easily just save a Chart with some subplots, I use Workspaces for this. So the Workspace really is just a chart of ^GSPC or SPY with some subplots (FRED data and some "rolling" calculations on the FRED data) and a couple indicators on the chart of the ticker. If you'd like a screenshot, let me log into this thread from that computer and I'll try to post a pic.
And you have all of the same extensions installed on the new computer? A screen shot might help. sure.
Also, here's what's in the [Workspace name].txt file - since nothing proprierary or anything in this. Just plots some recession indicators. Also yep, the same extensions that would be needed for this Chart are installed on both systems, though I think their may be a few different "other" extensions installed between the 2 systems that wouldn't be needed for this basic Chart. If the extensions/data providers need to be precisely equivalent on both systems, I could try and go 1 by 1 to check and install if needed.
1|45|False1|16|3136.56|-918.54|17414|30371|212|\\.\DISPLAY16|477.754|True1|34|Home0|3|3642|261|01|01|011|DataManager0|2|262|269|1054.68756|785.251|05|Chart5161|2|*44924|1|9629|2|2211|Candlestick12|255,51,53,5412|255,41,41,4115|255,111,194,10715|255,227,100,10013|255,94,99,10212|255,43,43,4315|255,192,192,1925|False1|24|True4|True1|01|03|SPY15|255,133,142,148336|2|V31|32|1412|Fill Candles1|34|True5|False10|-9999999999|9999999991|10|5|False7|Boolean0|4|True5|False4|NULL4|NULL2|1415|Outline Candles1|35|False5|False10|-9999999999|9999999991|10|5|False7|Boolean0|4|True5|False4|NULL4|NULL2|1413|Outline Color1|69|255,0,0,05|False10|-9999999999|9999999991|10|5|False5|Color0|4|True5|False4|NULL4|NULL1|21|25|False14|64,192,192,1921|24|True4|True4|True5|False5|False4|True23|Segoe UI,11,False,False0|4|True11|Candlestick336|2|V31|32|1412|Fill Candles1|34|True5|False10|-9999999999|9999999991|10|5|False7|Boolean0|4|True5|False4|NULL4|NULL2|1415|Outline Candles1|35|False5|False10|-9999999999|9999999991|10|5|False7|Boolean0|4|True5|False4|NULL4|NULL2|1413|Outline Color1|69|255,0,0,05|False10|-9999999999|9999999991|10|5|False5|Color0|4|True5|False4|NULL4|NULL1|25|False4|True5|False5|False5|False17|2|V31|21|15|False4|True9|US Stocks4|True5|^GSPC0|1|7139|2|V54|FRED15|255,255,245,2381|00|6|-NULL-13|RECPROUSM156N6|-NULL-4|True6|-NULL-26|Levels (No transformation)6|-NULL-14|RECESSION PROB4|Line318|2|V31|32|145|Color1|615|255,255,245,2385|False10|-9999999999|9999999991|10|5|False5|Color0|4|True5|False4|NULL4|NULL2|149|Thickness1|01|15|False10|-9999999999|9999999991|10|5|False5|Int320|4|True5|False4|NULL4|NULL2|1410|Line Style1|71|15|False10|-9999999999|9999999991|10|5|False9|LineStyle0|4|True5|False4|NULL4|NULL142|2|V54|FRED14|255,72,209,2041|00|6|-NULL-11|JHGDPBRINDX6|-NULL-5|False6|-NULL-26|Levels (No transformation)6|-NULL-19|RECESSION PROB GDP 4|Line317|2|V31|32|145|Color1|614|255,72,209,2045|False10|-9999999999|9999999991|10|5|False5|Color0|4|True5|False4|NULL4|NULL2|149|Thickness1|01|15|False10|-9999999999|9999999991|10|5|False5|Int320|4|True5|False4|NULL4|NULL2|1410|Line Style1|71|25|False10|-9999999999|9999999991|10|5|False9|LineStyle0|4|True5|False4|NULL4|NULL833|2|V514|MathIndOpValue15|255,255,105,1801|00|6|-NULL-4|FRED713|2|V31|42|146|Source1|55|False10|-9999999999|9999999991|10|5|False10|BarHistory0|4|True5|False4|NULL4|NULL2|1416|FRED series name1|212|SAHMREALTIME5|False10|-9999999999|9999999991|10|5|False6|String0|4|True5|False4|NULL4|NULL2|1416|Get description?1|34|True5|False10|-9999999999|9999999991|10|5|False7|Boolean0|4|True5|False4|NULL4|NULL2|145|Units2|101|926|Levels (No transformation)6|Change20|Change from Year Ago14|Percent Change28|Percent Change from Year Ago32|Compounded Annual Rate of Change38|Continuously Compounded Rate of Change45|Continuously Compounded Annual Rate of Change11|Natural Log26|Levels (No transformation)5|False10|-9999999999|9999999991|10|5|False12|StringChoice0|4|True5|False4|NULL4|NULL8|Multiply6|-NULL-2|106|-NULL-19|RECESSION PROB SAHM4|Line318|2|V31|32|145|Color1|615|255,255,105,1805|False10|-9999999999|9999999991|10|5|False5|Color0|4|True5|False4|NULL4|NULL2|149|Thickness1|01|25|False10|-9999999999|9999999991|10|5|False5|Int320|4|True5|False4|NULL4|NULL2|1410|Line Style1|71|05|False10|-9999999999|9999999991|10|5|False9|LineStyle0|4|True5|False4|NULL4|NULL135|2|V54|FRED13|255,220,20,601|00|6|-NULL-5|USREC6|-NULL-5|False6|-NULL-26|Levels (No transformation)6|-NULL-15|RECESSION DATES9|Histogram212|2|V31|22|145|Color1|613|255,220,20,605|False10|-9999999999|9999999991|10|5|False5|Color0|4|True5|False4|NULL4|NULL2|149|Thickness1|01|25|False10|-9999999999|9999999991|10|5|False5|Int320|4|True5|False4|NULL4|NULL143|2|V54|FRED13|255,34,139,341|00|6|-NULL-6|T10Y3M6|-NULL-5|False6|-NULL-26|Levels (No transformation)6|-NULL-13|10y-3M SPREAD17|HistogramTwoColor329|2|V31|32|145|Color1|613|255,34,139,345|False10|-9999999999|9999999991|10|5|False5|Color0|4|True5|False4|NULL4|NULL2|149|Thickness1|01|35|False10|-9999999999|9999999991|10|5|False5|Int320|4|True5|False4|NULL4|NULL2|1414|Negative Color1|613|255,255,0,2555|False10|-9999999999|9999999991|10|5|False5|Color0|4|True5|False4|NULL4|NULL137|2|V54|FRED11|255,255,0,01|00|6|-NULL-6|USRECM6|-NULL-5|False6|-NULL-26|Levels (No transformation)6|-NULL-15|RECESSION DATES11|BooleanDots222|2|V31|22|145|Color1|611|255,255,0,05|False10|-9999999999|9999999991|10|5|False5|Color0|4|True5|False4|NULL4|NULL2|1415|Plot Below Bars1|34|True5|False10|-9999999999|9999999991|10|5|False7|Boolean0|4|True5|False4|NULL4|NULL136|2|V54|FRED14|255,30,144,2551|00|6|-NULL-4|NFCI6|-NULL-4|True6|-NULL-26|Levels (No transformation)6|-NULL-22|ChicagoFedFinanCondIdx4|Line317|2|V31|32|145|Color1|614|255,30,144,2555|False10|-9999999999|9999999991|10|5|False5|Color0|4|True5|False4|NULL4|NULL2|149|Thickness1|01|25|False10|-9999999999|9999999991|10|5|False5|Int320|4|True5|False4|NULL4|NULL2|1410|Line Style1|71|05|False10|-9999999999|9999999991|10|5|False9|LineStyle0|4|True5|False4|NULL4|NULL4|True4|True6|Alpaca5|False1|84|21003|2333|2333|2333|2333|2333|2333|2330|12|1|01|01|01|05|False6|Alpaca202|2|V91|04|50006|1000001|11|01|01|01|05|False5|False5|False5|False5|False22|5|500006|2000005|1000019|4|10005|100004|100010|1|12|201|116|3|1004|10003|10011|1|11|23|0.110|1|52|501|51|05|False12|1|14|10001|15|False1|01|07|1214.254|29191|25|False5|False
1|45|False1|16|3136.56|-918.54|17414|30371|212|\\.\DISPLAY16|477.754|True1|34|Home0|3|3642|261|01|01|011|DataManager0|2|262|269|1054.68756|785.251|05|Chart5161|2|*44924|1|9629|2|2211|Candlestick12|255,51,53,5412|255,41,41,4115|255,111,194,10715|255,227,100,10013|255,94,99,10212|255,43,43,4315|255,192,192,1925|False1|24|True4|True1|01|03|SPY15|255,133,142,148336|2|V31|32|1412|Fill Candles1|34|True5|False10|-9999999999|9999999991|10|5|False7|Boolean0|4|True5|False4|NULL4|NULL2|1415|Outline Candles1|35|False5|False10|-9999999999|9999999991|10|5|False7|Boolean0|4|True5|False4|NULL4|NULL2|1413|Outline Color1|69|255,0,0,05|False10|-9999999999|9999999991|10|5|False5|Color0|4|True5|False4|NULL4|NULL1|21|25|False14|64,192,192,1921|24|True4|True4|True5|False5|False4|True23|Segoe UI,11,False,False0|4|True11|Candlestick336|2|V31|32|1412|Fill Candles1|34|True5|False10|-9999999999|9999999991|10|5|False7|Boolean0|4|True5|False4|NULL4|NULL2|1415|Outline Candles1|35|False5|False10|-9999999999|9999999991|10|5|False7|Boolean0|4|True5|False4|NULL4|NULL2|1413|Outline Color1|69|255,0,0,05|False10|-9999999999|9999999991|10|5|False5|Color0|4|True5|False4|NULL4|NULL1|25|False4|True5|False5|False5|False17|2|V31|21|15|False4|True9|US Stocks4|True5|^GSPC0|1|7139|2|V54|FRED15|255,255,245,2381|00|6|-NULL-13|RECPROUSM156N6|-NULL-4|True6|-NULL-26|Levels (No transformation)6|-NULL-14|RECESSION PROB4|Line318|2|V31|32|145|Color1|615|255,255,245,2385|False10|-9999999999|9999999991|10|5|False5|Color0|4|True5|False4|NULL4|NULL2|149|Thickness1|01|15|False10|-9999999999|9999999991|10|5|False5|Int320|4|True5|False4|NULL4|NULL2|1410|Line Style1|71|15|False10|-9999999999|9999999991|10|5|False9|LineStyle0|4|True5|False4|NULL4|NULL142|2|V54|FRED14|255,72,209,2041|00|6|-NULL-11|JHGDPBRINDX6|-NULL-5|False6|-NULL-26|Levels (No transformation)6|-NULL-19|RECESSION PROB GDP 4|Line317|2|V31|32|145|Color1|614|255,72,209,2045|False10|-9999999999|9999999991|10|5|False5|Color0|4|True5|False4|NULL4|NULL2|149|Thickness1|01|15|False10|-9999999999|9999999991|10|5|False5|Int320|4|True5|False4|NULL4|NULL2|1410|Line Style1|71|25|False10|-9999999999|9999999991|10|5|False9|LineStyle0|4|True5|False4|NULL4|NULL833|2|V514|MathIndOpValue15|255,255,105,1801|00|6|-NULL-4|FRED713|2|V31|42|146|Source1|55|False10|-9999999999|9999999991|10|5|False10|BarHistory0|4|True5|False4|NULL4|NULL2|1416|FRED series name1|212|SAHMREALTIME5|False10|-9999999999|9999999991|10|5|False6|String0|4|True5|False4|NULL4|NULL2|1416|Get description?1|34|True5|False10|-9999999999|9999999991|10|5|False7|Boolean0|4|True5|False4|NULL4|NULL2|145|Units2|101|926|Levels (No transformation)6|Change20|Change from Year Ago14|Percent Change28|Percent Change from Year Ago32|Compounded Annual Rate of Change38|Continuously Compounded Rate of Change45|Continuously Compounded Annual Rate of Change11|Natural Log26|Levels (No transformation)5|False10|-9999999999|9999999991|10|5|False12|StringChoice0|4|True5|False4|NULL4|NULL8|Multiply6|-NULL-2|106|-NULL-19|RECESSION PROB SAHM4|Line318|2|V31|32|145|Color1|615|255,255,105,1805|False10|-9999999999|9999999991|10|5|False5|Color0|4|True5|False4|NULL4|NULL2|149|Thickness1|01|25|False10|-9999999999|9999999991|10|5|False5|Int320|4|True5|False4|NULL4|NULL2|1410|Line Style1|71|05|False10|-9999999999|9999999991|10|5|False9|LineStyle0|4|True5|False4|NULL4|NULL135|2|V54|FRED13|255,220,20,601|00|6|-NULL-5|USREC6|-NULL-5|False6|-NULL-26|Levels (No transformation)6|-NULL-15|RECESSION DATES9|Histogram212|2|V31|22|145|Color1|613|255,220,20,605|False10|-9999999999|9999999991|10|5|False5|Color0|4|True5|False4|NULL4|NULL2|149|Thickness1|01|25|False10|-9999999999|9999999991|10|5|False5|Int320|4|True5|False4|NULL4|NULL143|2|V54|FRED13|255,34,139,341|00|6|-NULL-6|T10Y3M6|-NULL-5|False6|-NULL-26|Levels (No transformation)6|-NULL-13|10y-3M SPREAD17|HistogramTwoColor329|2|V31|32|145|Color1|613|255,34,139,345|False10|-9999999999|9999999991|10|5|False5|Color0|4|True5|False4|NULL4|NULL2|149|Thickness1|01|35|False10|-9999999999|9999999991|10|5|False5|Int320|4|True5|False4|NULL4|NULL2|1414|Negative Color1|613|255,255,0,2555|False10|-9999999999|9999999991|10|5|False5|Color0|4|True5|False4|NULL4|NULL137|2|V54|FRED11|255,255,0,01|00|6|-NULL-6|USRECM6|-NULL-5|False6|-NULL-26|Levels (No transformation)6|-NULL-15|RECESSION DATES11|BooleanDots222|2|V31|22|145|Color1|611|255,255,0,05|False10|-9999999999|9999999991|10|5|False5|Color0|4|True5|False4|NULL4|NULL2|1415|Plot Below Bars1|34|True5|False10|-9999999999|9999999991|10|5|False7|Boolean0|4|True5|False4|NULL4|NULL136|2|V54|FRED14|255,30,144,2551|00|6|-NULL-4|NFCI6|-NULL-4|True6|-NULL-26|Levels (No transformation)6|-NULL-22|ChicagoFedFinanCondIdx4|Line317|2|V31|32|145|Color1|614|255,30,144,2555|False10|-9999999999|9999999991|10|5|False5|Color0|4|True5|False4|NULL4|NULL2|149|Thickness1|01|25|False10|-9999999999|9999999991|10|5|False5|Int320|4|True5|False4|NULL4|NULL2|1410|Line Style1|71|05|False10|-9999999999|9999999991|10|5|False9|LineStyle0|4|True5|False4|NULL4|NULL4|True4|True6|Alpaca5|False1|84|21003|2333|2333|2333|2333|2333|2333|2330|12|1|01|01|01|05|False6|Alpaca202|2|V91|04|50006|1000001|11|01|01|01|05|False5|False5|False5|False5|False22|5|500006|2000005|1000019|4|10005|100004|100010|1|12|201|116|3|1004|10003|10011|1|11|23|0.110|1|52|501|51|05|False12|1|14|10001|15|False1|01|07|1214.254|29191|25|False5|False
Oh also, not sure if this is relevant but the computer with the "source" Workspaces is running Win 11 and the "destination" computer I'm trying to copy them too is running Win 10.
The latter won't make difference. Apparently WL may not be deserializing (restoring) some Chart object in your case?
Wow it's a pseudo-miracle - I eyeballed a couple of extensions that were not installed in the "destination" WL8 (even though they wouldn't be required for this simple Chart). After installing these just to make it more apples-to-apples to the source installation, and miraculously the Charts are now working. Thanks for throwing out that idea! All good here now!
QUOTE:A Workspace is a good way to go, but you should also set up "Indicator Sets" with your favorite set of indicators to quickly apply to any chart. Check it out on the right side of the chart toolbar.
save a Chart with some subplots,
Your Response
Post
Edit Post
Login is required