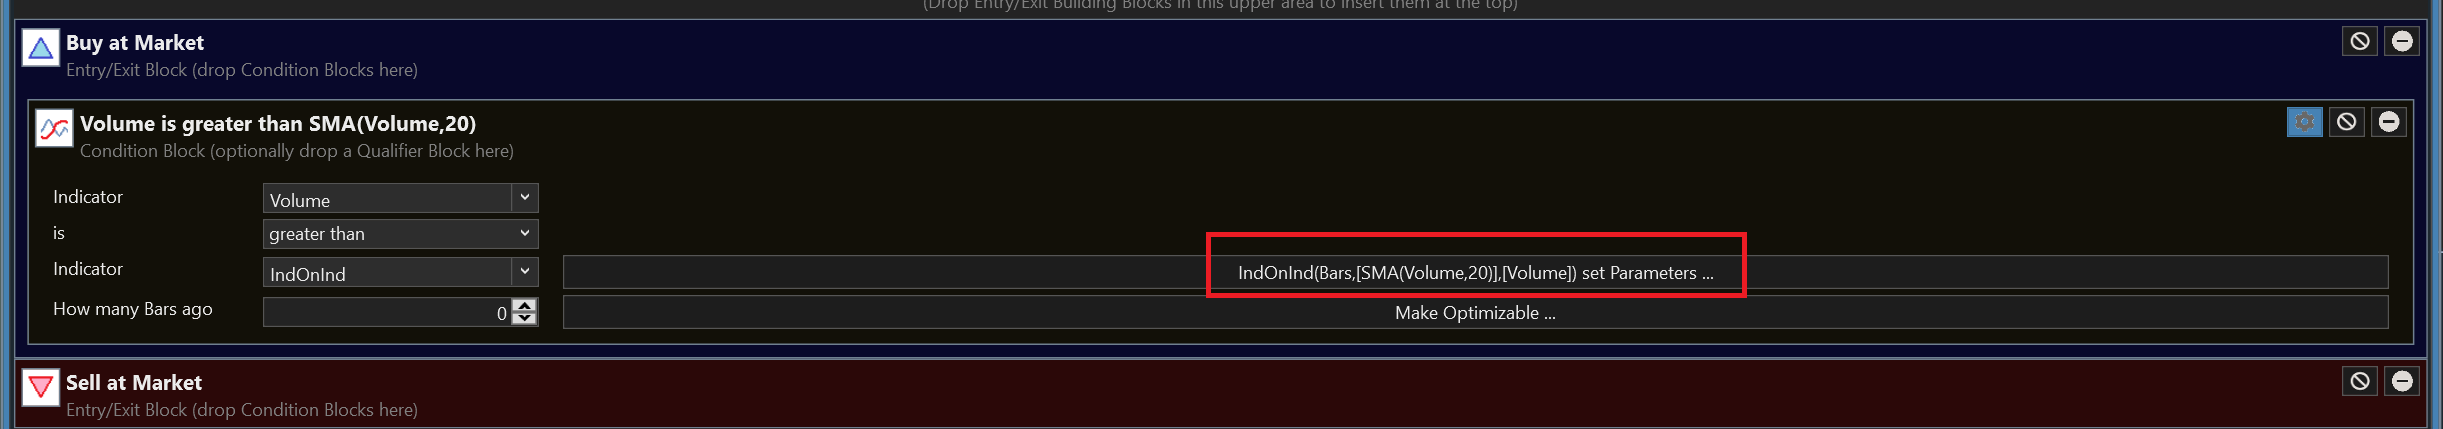
There is a display problem when using IndOnInd SMA on volume :
I saw that now we can add and draw on the backtest chart, but we cannot change the block indicators and the time unit. Why is this problematic? (If we consider “chart” different from “backtest results”)
I saw that now we can add and draw on the backtest chart, but we cannot change the block indicators and the time unit. Why is this problematic? (If we consider “chart” different from “backtest results”)
Rename
Here's a workaround. Click "Open as C# Coded Strategy" and change the indicator plotting code as follows:
CODE:
//PlotIndicator(indicator2,new WLColor(0,0,0));
PlotIndicator(indicator2,new WLColor(0,0,0),default,default,"Volume");
And what to do in this case? and if I use several time units on the volume indicator, how can I duplicate it?
Also this will be useful to me, what line of code to make an indicator disappear on the chart?
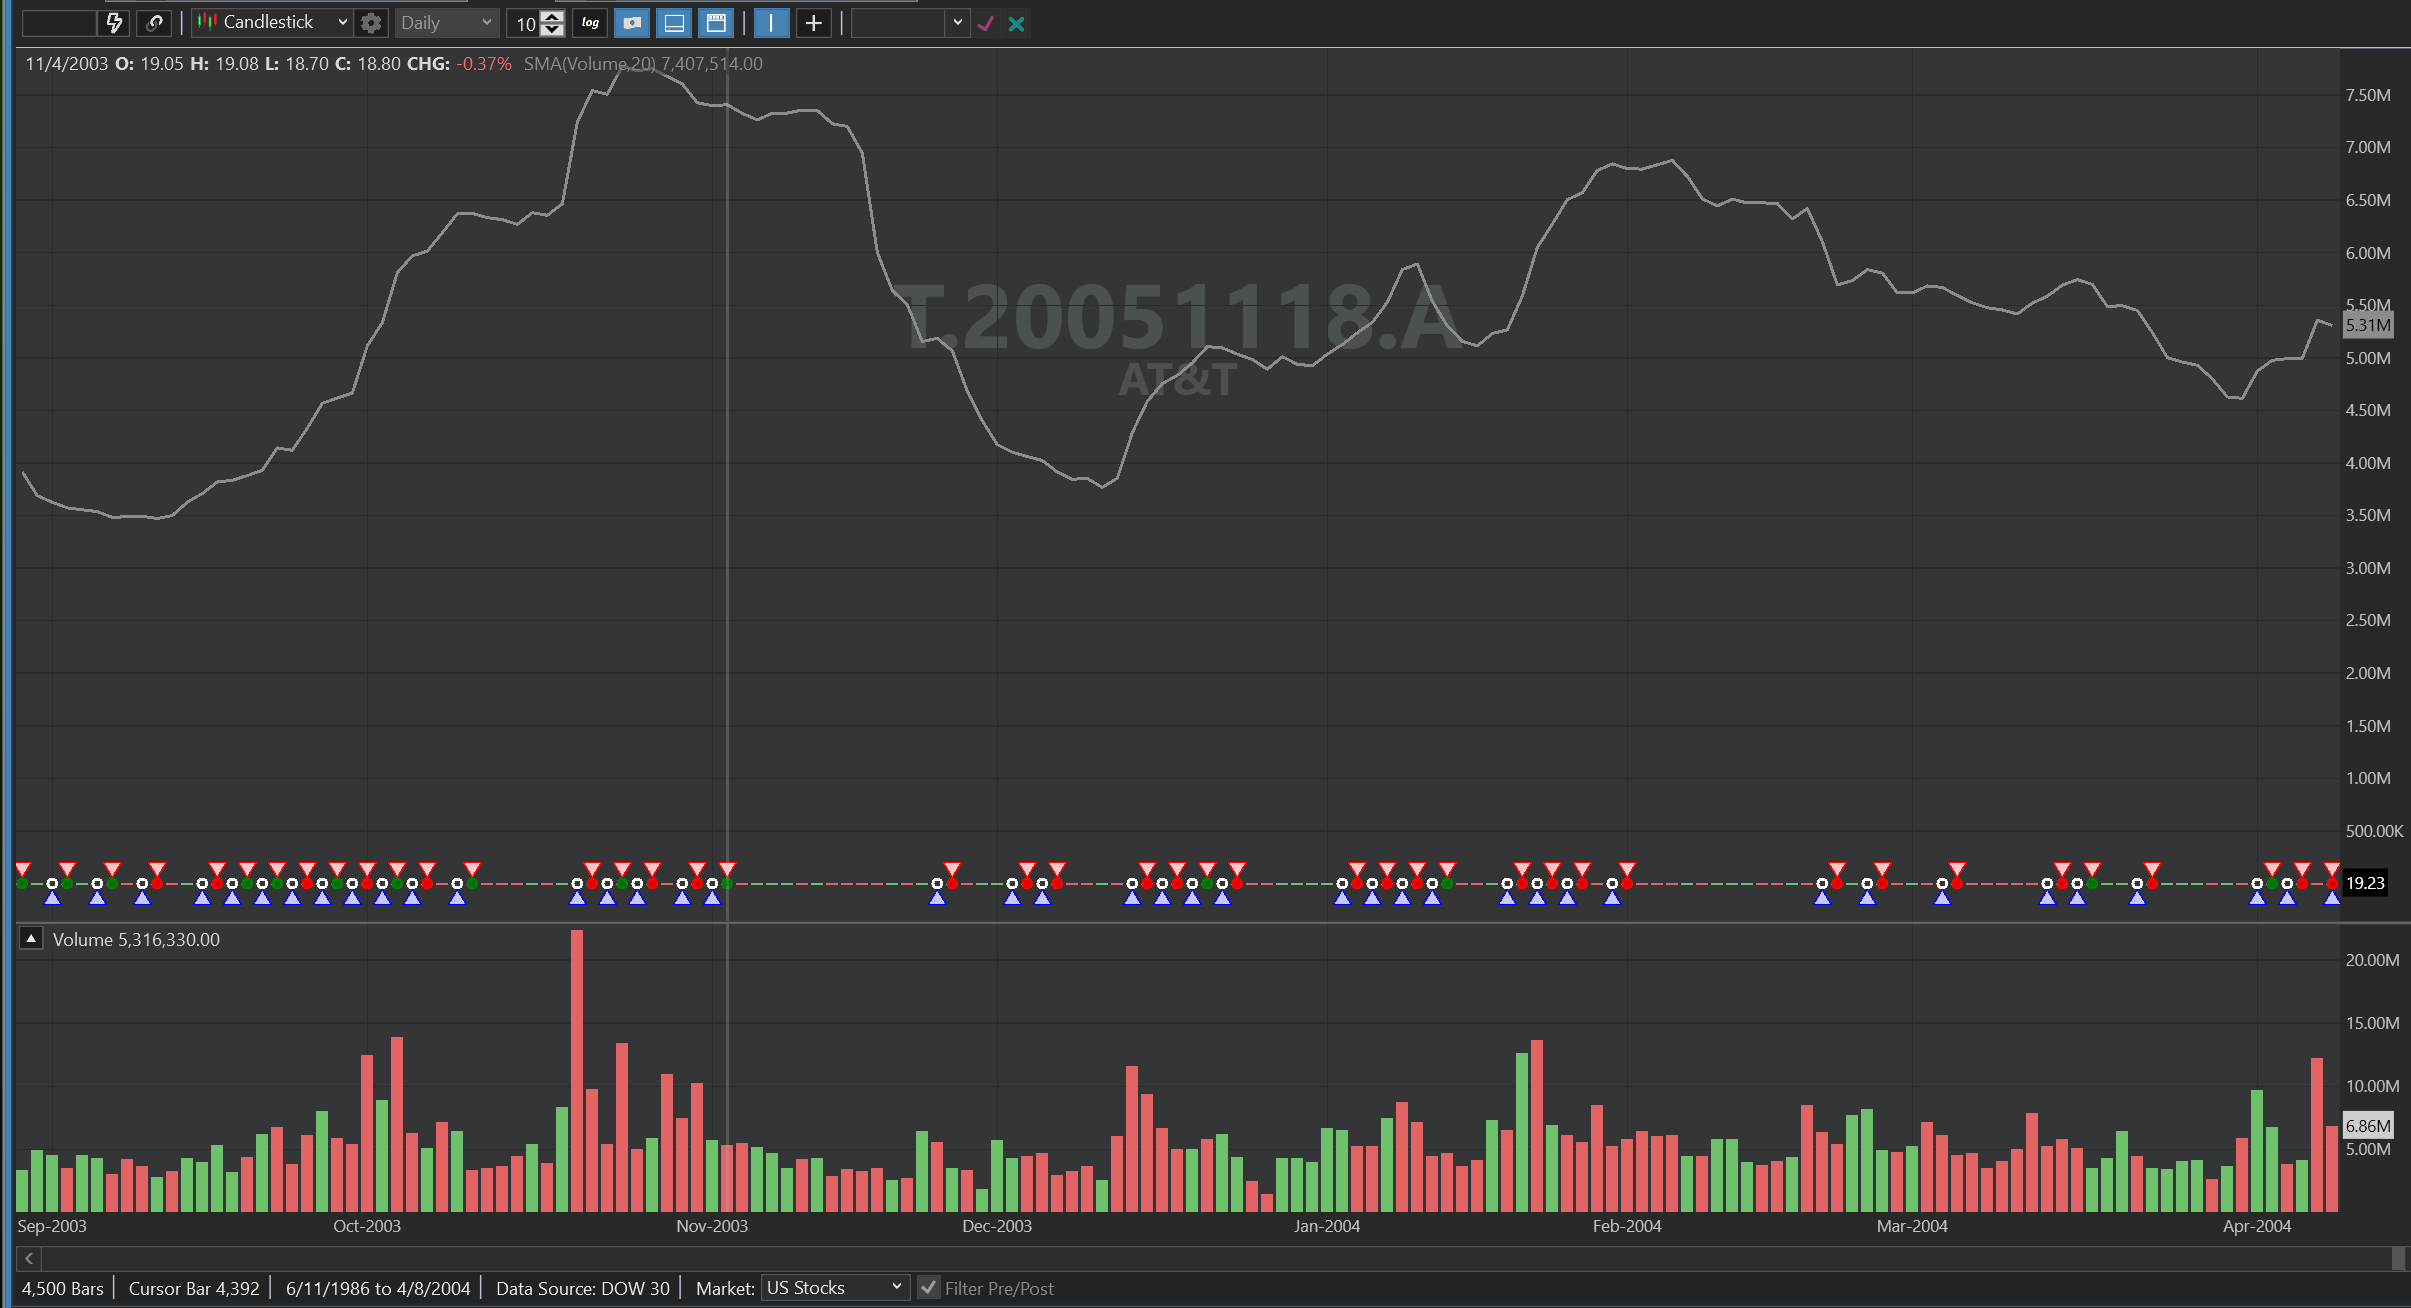
In this example the data scale is 1h
Also this will be useful to me, what line of code to make an indicator disappear on the chart?
In this example the data scale is 1h
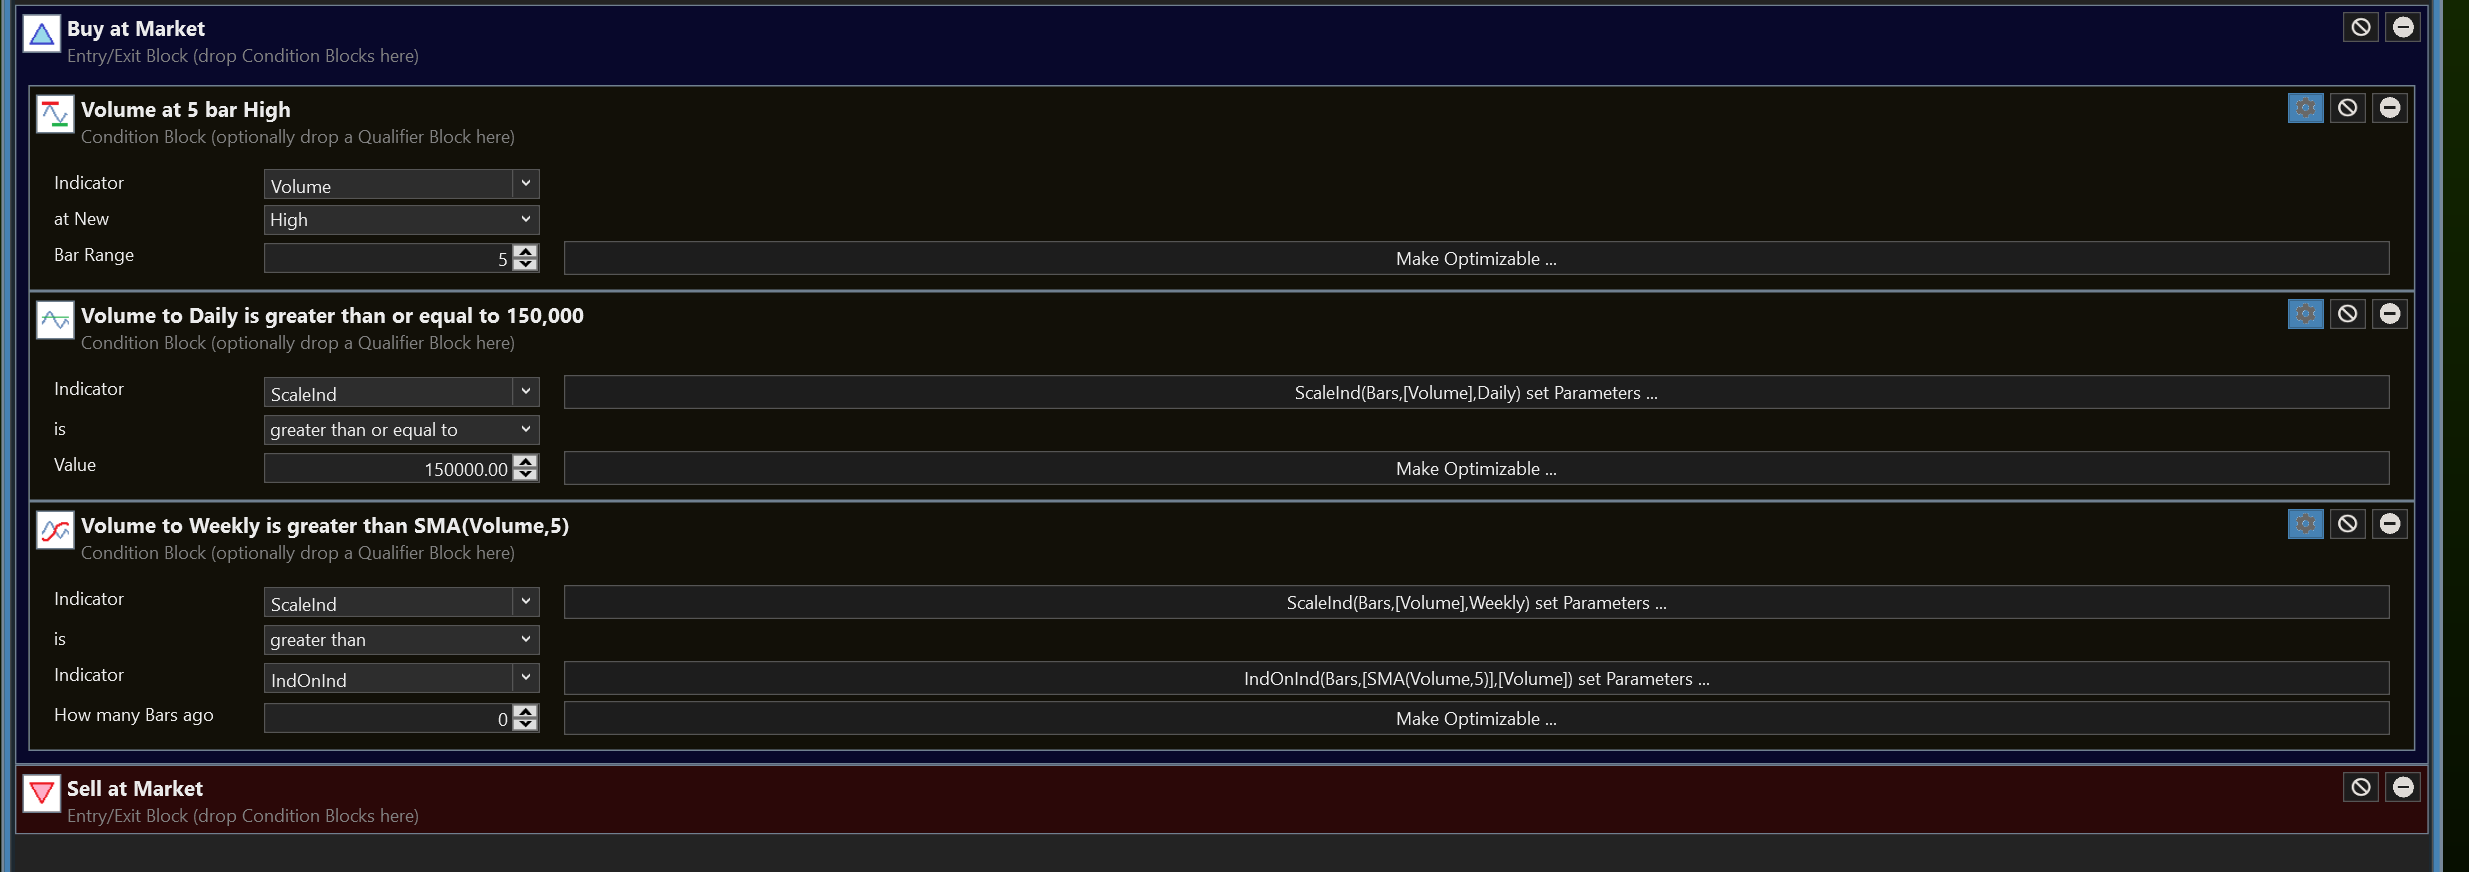
Currently, those plots aren't "Volume pane" friendly. The only option is to click "Open as C# Coded Strategy" and:
1. Remove the PlotIndicator statements. Just put 2 backslashes in front like this -
OR,
2. Specify the volume pane for the indicators that use Volume, like Eugene showed above, or like this -
You'll need to do that in 2 places.
1. Remove the PlotIndicator statements. Just put 2 backslashes in front like this -
CODE:
//PlotIndicator(indicator2,new WLColor(0,0,0));
OR,
2. Specify the volume pane for the indicators that use Volume, like Eugene showed above, or like this -
CODE:
//WAS:
//PlotIndicator(indicator2,new WLColor(0,0,0));

//CHANGE TO:
PlotIndicator(indicator2,new WLColor(0,0,0), paneTag: "Volume");
You'll need to do that in 2 places.
For the first condition you don't need to use IndOnInd. Just use a normal Indicator Compare to Indicator and select Volume > SMA and change the SMA parameter from Close to Volume.
But I'm fixing these for Build 49 so they will plot correctly in the Volume pane.
Your Response
Post
Edit Post
Login is required