When I view a chart on 6 and 8 they are different.
I use the same Norgate data and the same system.
I have cross checked the charts with other providers and the error is with WL8
See attached file for charts,
cheers
Peter 7318-It-appears-the-problem-is-data-pdf
I use the same Norgate data and the same system.
I have cross checked the charts with other providers and the error is with WL8
See attached file for charts,
cheers
Peter
Rename
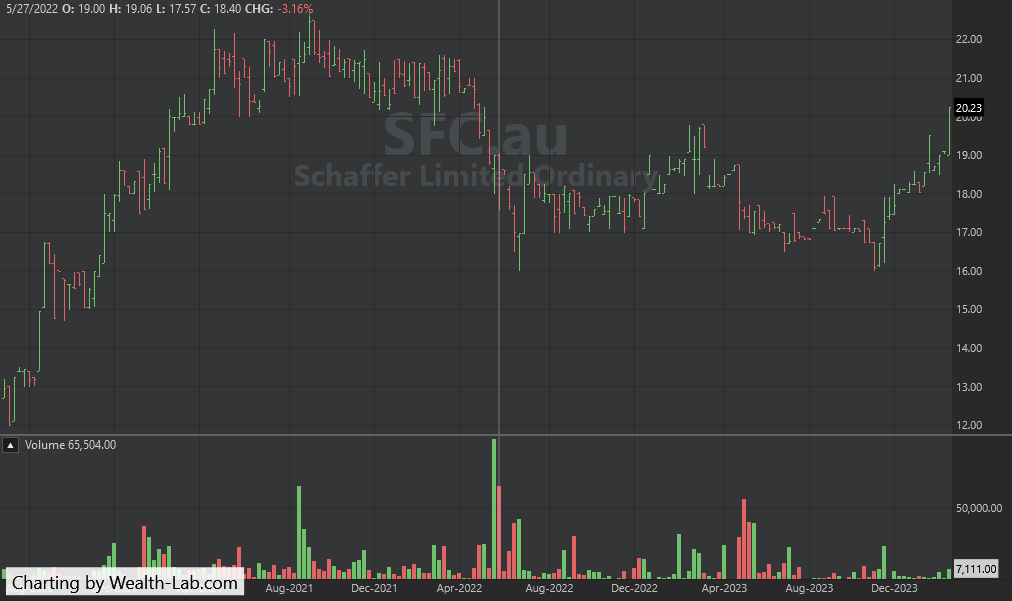
The charts are showing completely different date ranges.
WL6 uses Norgate Data and WL8 uses their new Premium Data, they are two different data sources.
Your WL6/Norgate Data chart goes up to the current date, while your WL8/Premium Data chart is only updated until mid-2021.
You need to update the Premium Data in the Norgate Data Updater tool.
WL6 uses Norgate Data and WL8 uses their new Premium Data, they are two different data sources.
Your WL6/Norgate Data chart goes up to the current date, while your WL8/Premium Data chart is only updated until mid-2021.
You need to update the Premium Data in the Norgate Data Updater tool.
Here the symbol is in WL8 after updating my Norgate Premium data, no longer wildly different.
thank you very much for the prompt answer
To my knowledge I have updated my data, however the problem seems to be still there.
This time the attachment shows charts of one stock7328-HZN-example-charts-pdf(with correct dates), daily and weekly from both WL6 and WL8.
Also a chart from Commonwealth Bank of the same stock price.
You can see that WL8 seems to be showing the incorrect price?
This time the attachment shows charts of one stock
Also a chart from Commonwealth Bank of the same stock price.
You can see that WL8 seems to be showing the incorrect price?
You are comparing a Weekly chart in WL6 to a Daily chart in WL8. 🤷♂️
Next time please attach images to your post directly, without making us have to open a PDF file. This is not mixed content and should be attached as is. Multiple image attachments per post are allowed. Thanks.
Next time please attach images to your post directly, without making us have to open a PDF file. This is not mixed content and should be attached as is. Multiple image attachments per post are allowed. Thanks.
When I click on image its takes me to my PC to load an image or pdf, I cant paste it directly in this box. I have corrected the original 7329-HZN-example-charts-pdf
You take a screenshot (PrtScrn key), paste it into Paint or other imaging app (Ctrl-V), save that as PNG (not JPEG), and attach. We do not support the direct paste, for neither image nor PDFs.
https://www.makeuseof.com/windows-instantly-save-screenshots/
The charts have a big discrepancy in the chosen scaling making comparisons very hard.
https://www.makeuseof.com/windows-instantly-save-screenshots/
The charts have a big discrepancy in the chosen scaling making comparisons very hard.
Just use Windows screen capture: Windows Start + Shift + S.
There are options for capture, but the default is to just drag a rectangle over what you want to capture. This saves a png image to C:\Users\yourWindowsLogin\OneDrive\Pictures\Screenshots that you can post here.
Maybe you have to set up where the Screenshot goes, I can't remember. Mine go to Pictures\Screenshots\. More info...
https://support.microsoft.com/en-us/windows/use-snipping-tool-to-capture-screenshots-00246869-1843-655f-f220-97299b865f6b#ID0EDD=Windows_11
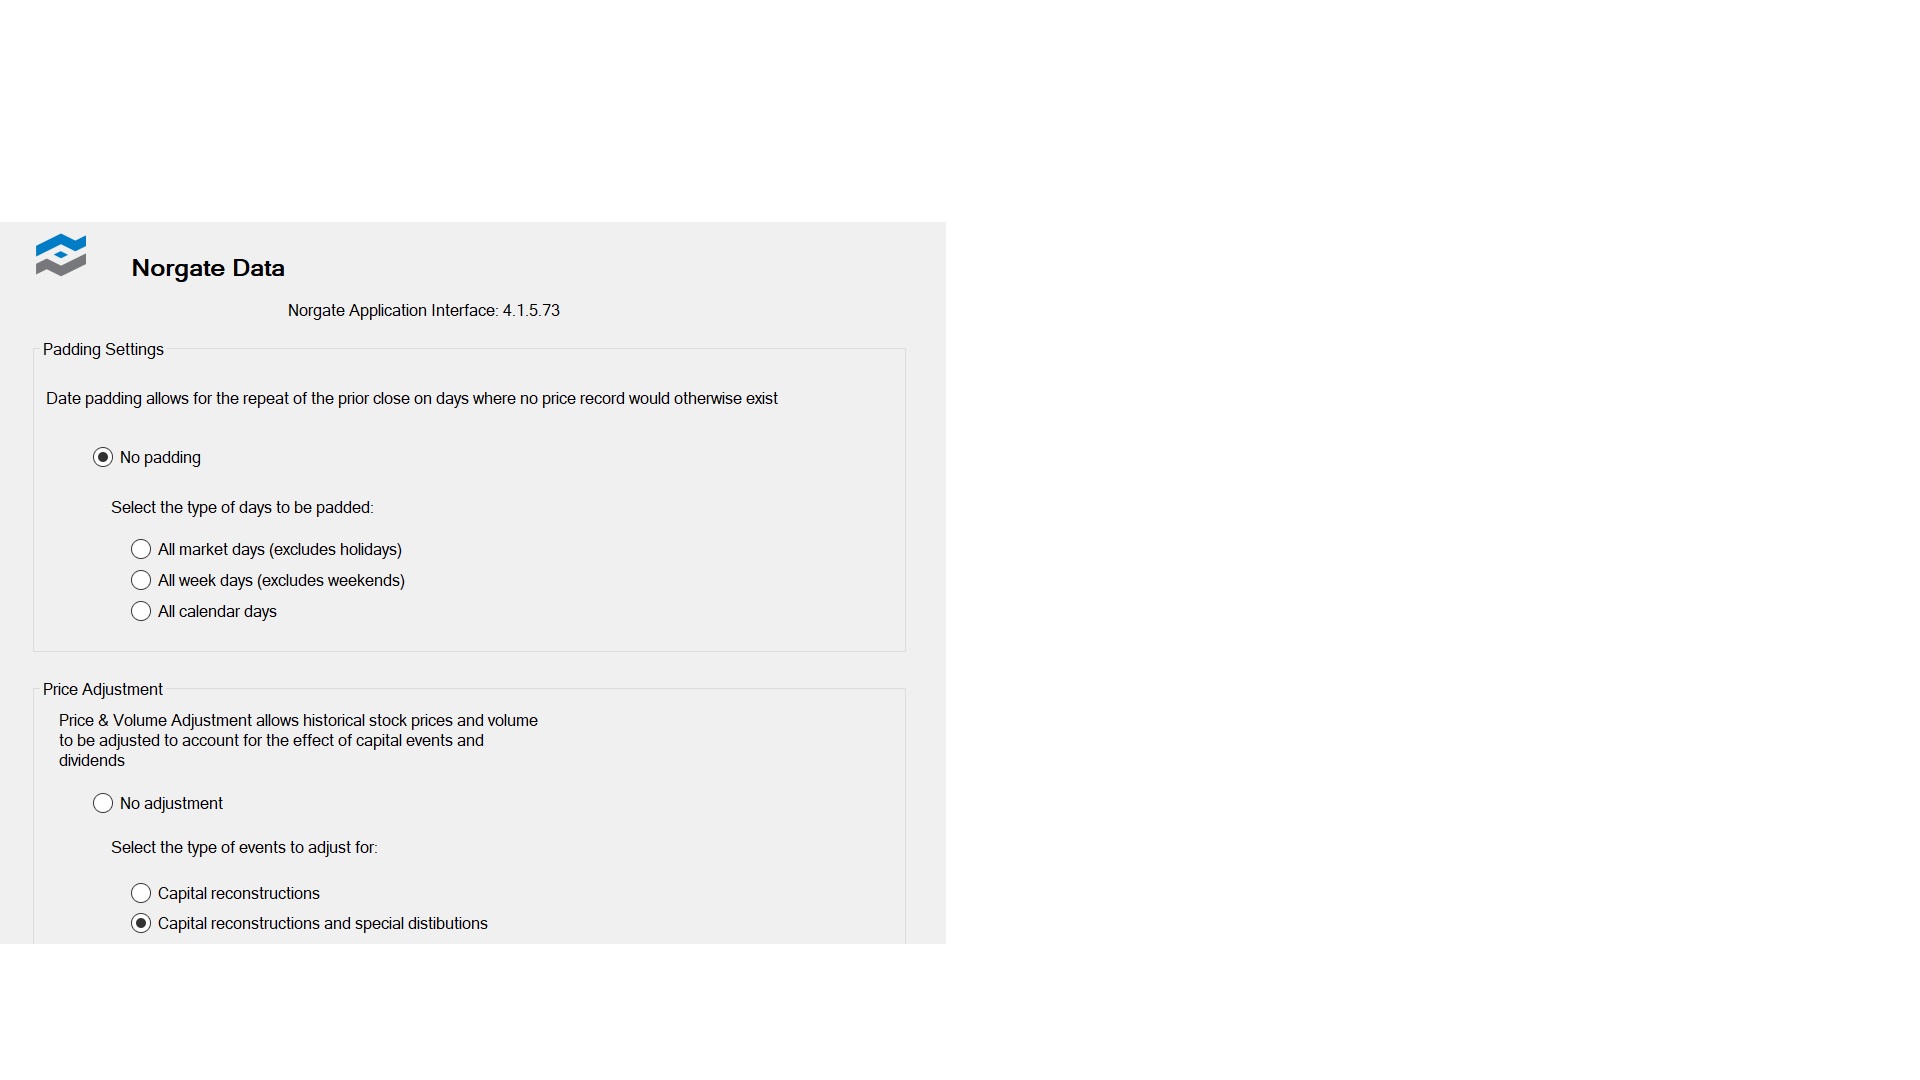
That said, probably your data adjustment preferences for Norgate Data are different. What are they?
WL6 > Data Manager > Norgate Data
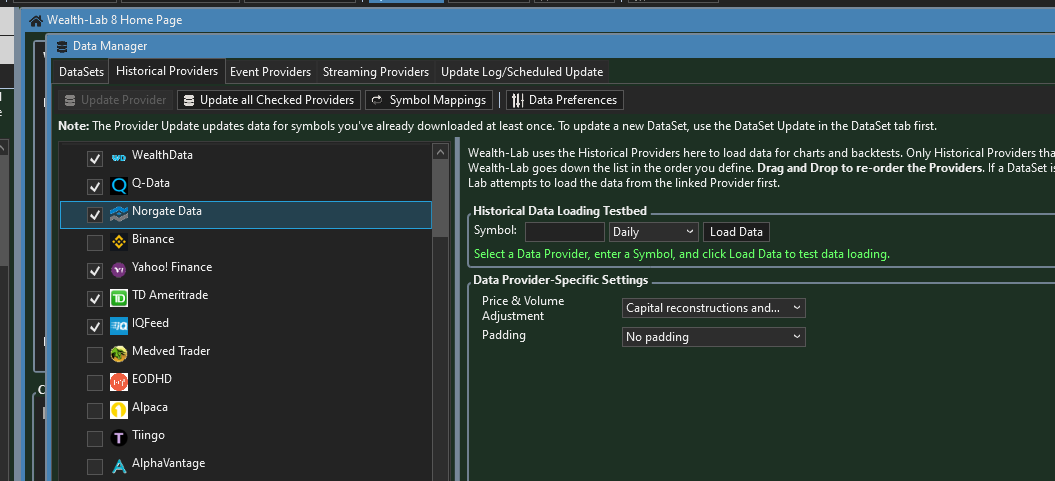
WL8 > Data Manager > Historical Providers > Norgate Data
WL6 > Data Manager > Norgate Data
WL8 > Data Manager > Historical Providers > Norgate Data
First of all apologies for posting another PDF. I did have difficulty pasting multiple charts to the Paint program that you suggested.
I am attempting to find the reason why WL8 is giving different looking charts to WL6 and also other chart providers. I have pasted 4 charts from different sources (the same time frames) and the only one that is different (possibly incorrect) is the WL8 chart.
For WL6 and 8 I am using the same Norgate data. In the PDF I also pasted screen shots of the data sources of WL6 and WL8.
I post 52 week high alerts every week on my website and I am getting frequent emails from subscribers noting signal discrepancies.
https://www.easysharetradingsystems.com.au/how-to-trade/52-week-highs
That's not your problem but I say this because it is not just me finding discrepancies, so something is amiss.
I do frequently recommend your service to clients and I just want to sort it out
7380-Chart-examples-of-NWH-pdf
https://www.amazon.com.au/Zen-Trader-Ancient-Wisdom-Markets/dp/0857198262/ref=asc_df_0857198262/?tag=googleshopdsk-22&linkCode=df0&hvadid=463538793990&hvpos=&hvnetw=g&hvrand=15756411780255754834&hvpone=&hvptwo=&hvqmt=&hvdev=c&hvdvcmdl=&hvlocint=&hvlocphy=9071743&hvtargid=pla-1633036913985&psc=1&mcid=4256a6e387593fea983722a45f937afd
Regards
Peter Castle
I am attempting to find the reason why WL8 is giving different looking charts to WL6 and also other chart providers. I have pasted 4 charts from different sources (the same time frames) and the only one that is different (possibly incorrect) is the WL8 chart.
For WL6 and 8 I am using the same Norgate data. In the PDF I also pasted screen shots of the data sources of WL6 and WL8.
I post 52 week high alerts every week on my website and I am getting frequent emails from subscribers noting signal discrepancies.
https://www.easysharetradingsystems.com.au/how-to-trade/52-week-highs
That's not your problem but I say this because it is not just me finding discrepancies, so something is amiss.
I do frequently recommend your service to clients and I just want to sort it out
https://www.amazon.com.au/Zen-Trader-Ancient-Wisdom-Markets/dp/0857198262/ref=asc_df_0857198262/?tag=googleshopdsk-22&linkCode=df0&hvadid=463538793990&hvpos=&hvnetw=g&hvrand=15756411780255754834&hvpone=&hvptwo=&hvqmt=&hvdev=c&hvdvcmdl=&hvlocint=&hvlocphy=9071743&hvtargid=pla-1633036913985&psc=1&mcid=4256a6e387593fea983722a45f937afd
Regards
Peter Castle
Peter, your last image doesn't show the settings for either WL6 or WL8.
If the data are different, how the data are adjusted will be the reason.
In WL6, open the Data Manager and click on the Norgate Data tab.
In WL8, open the Data Manager, click on Historical Providers, and then click on Norgate Data(you missed this last important part).
If the data are different, how the data are adjusted will be the reason.
In WL6, open the Data Manager and click on the Norgate Data tab.
In WL8, open the Data Manager, click on Historical Providers, and then click on Norgate Data(you missed this last important part).
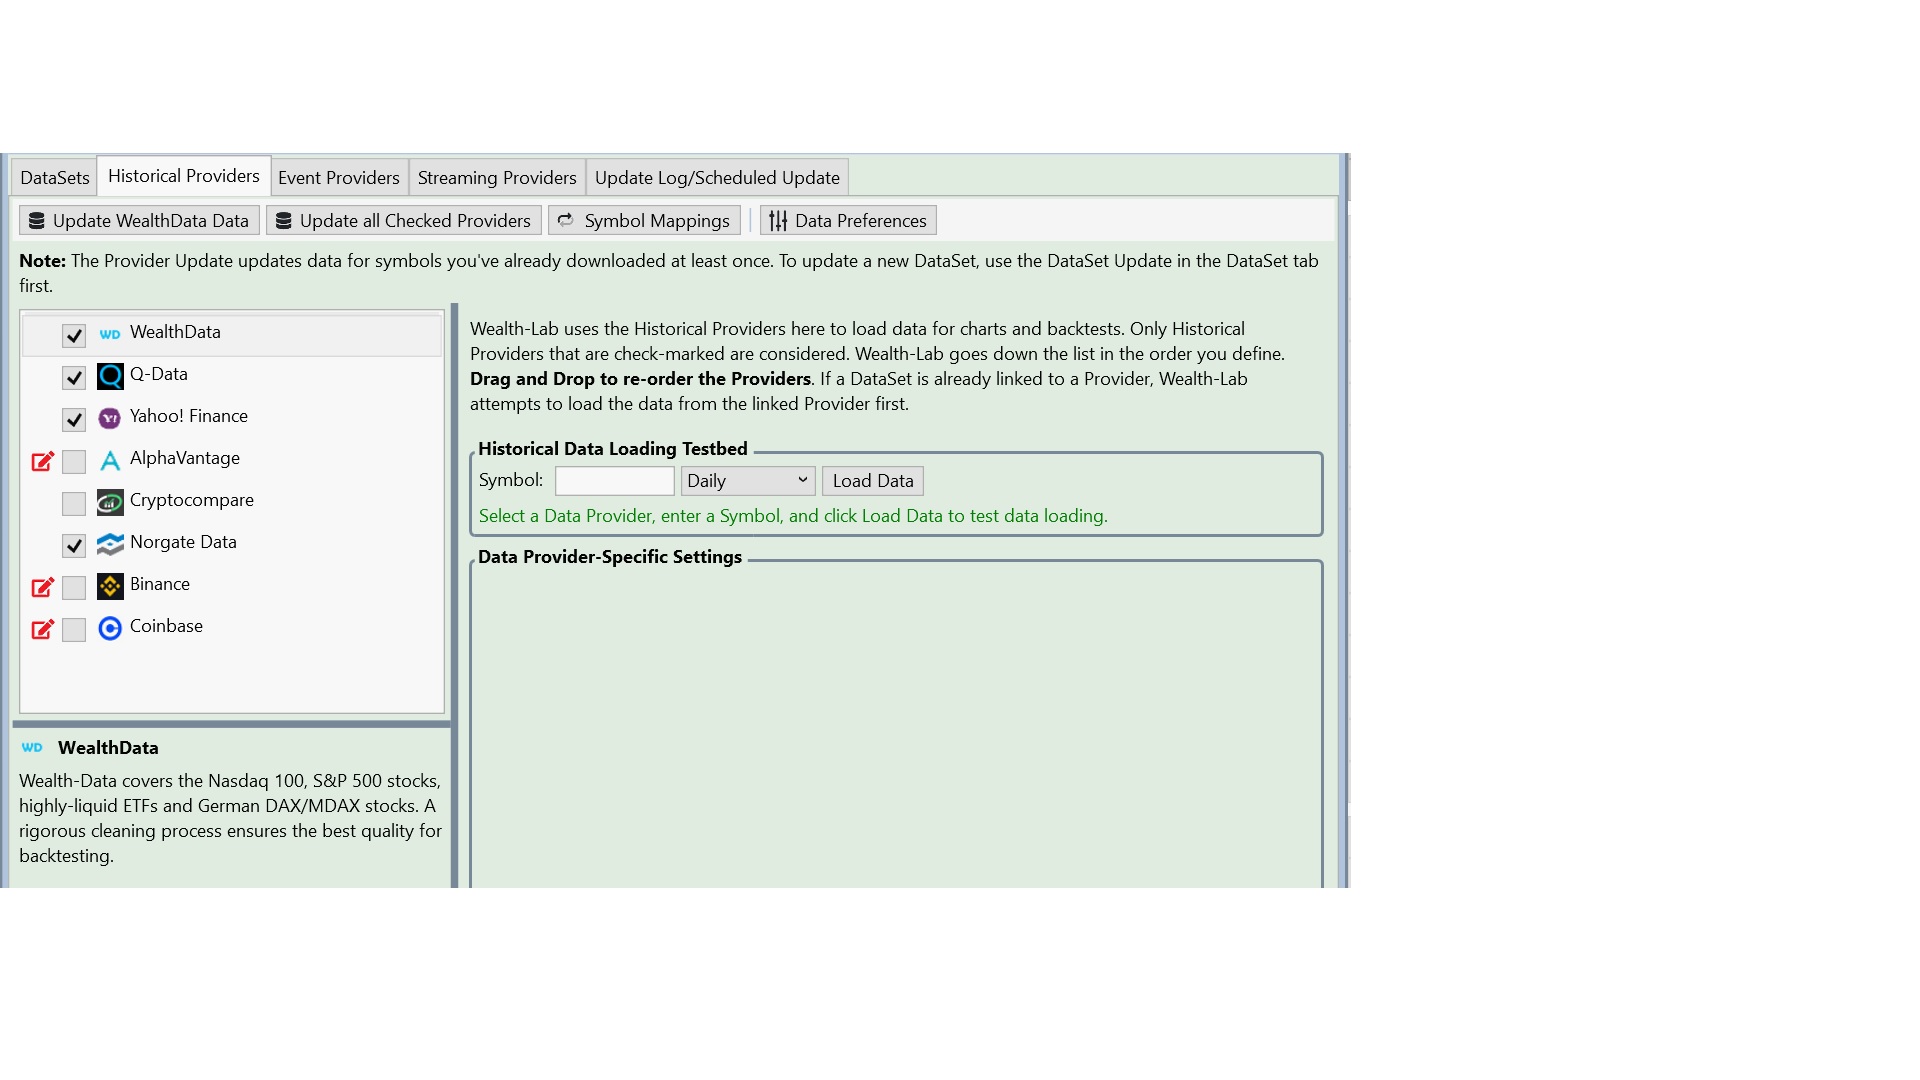
For Post #14 please click NORGATE DATA instead of WEALTH DATA.
After my response from Cone i ran a few more tests.
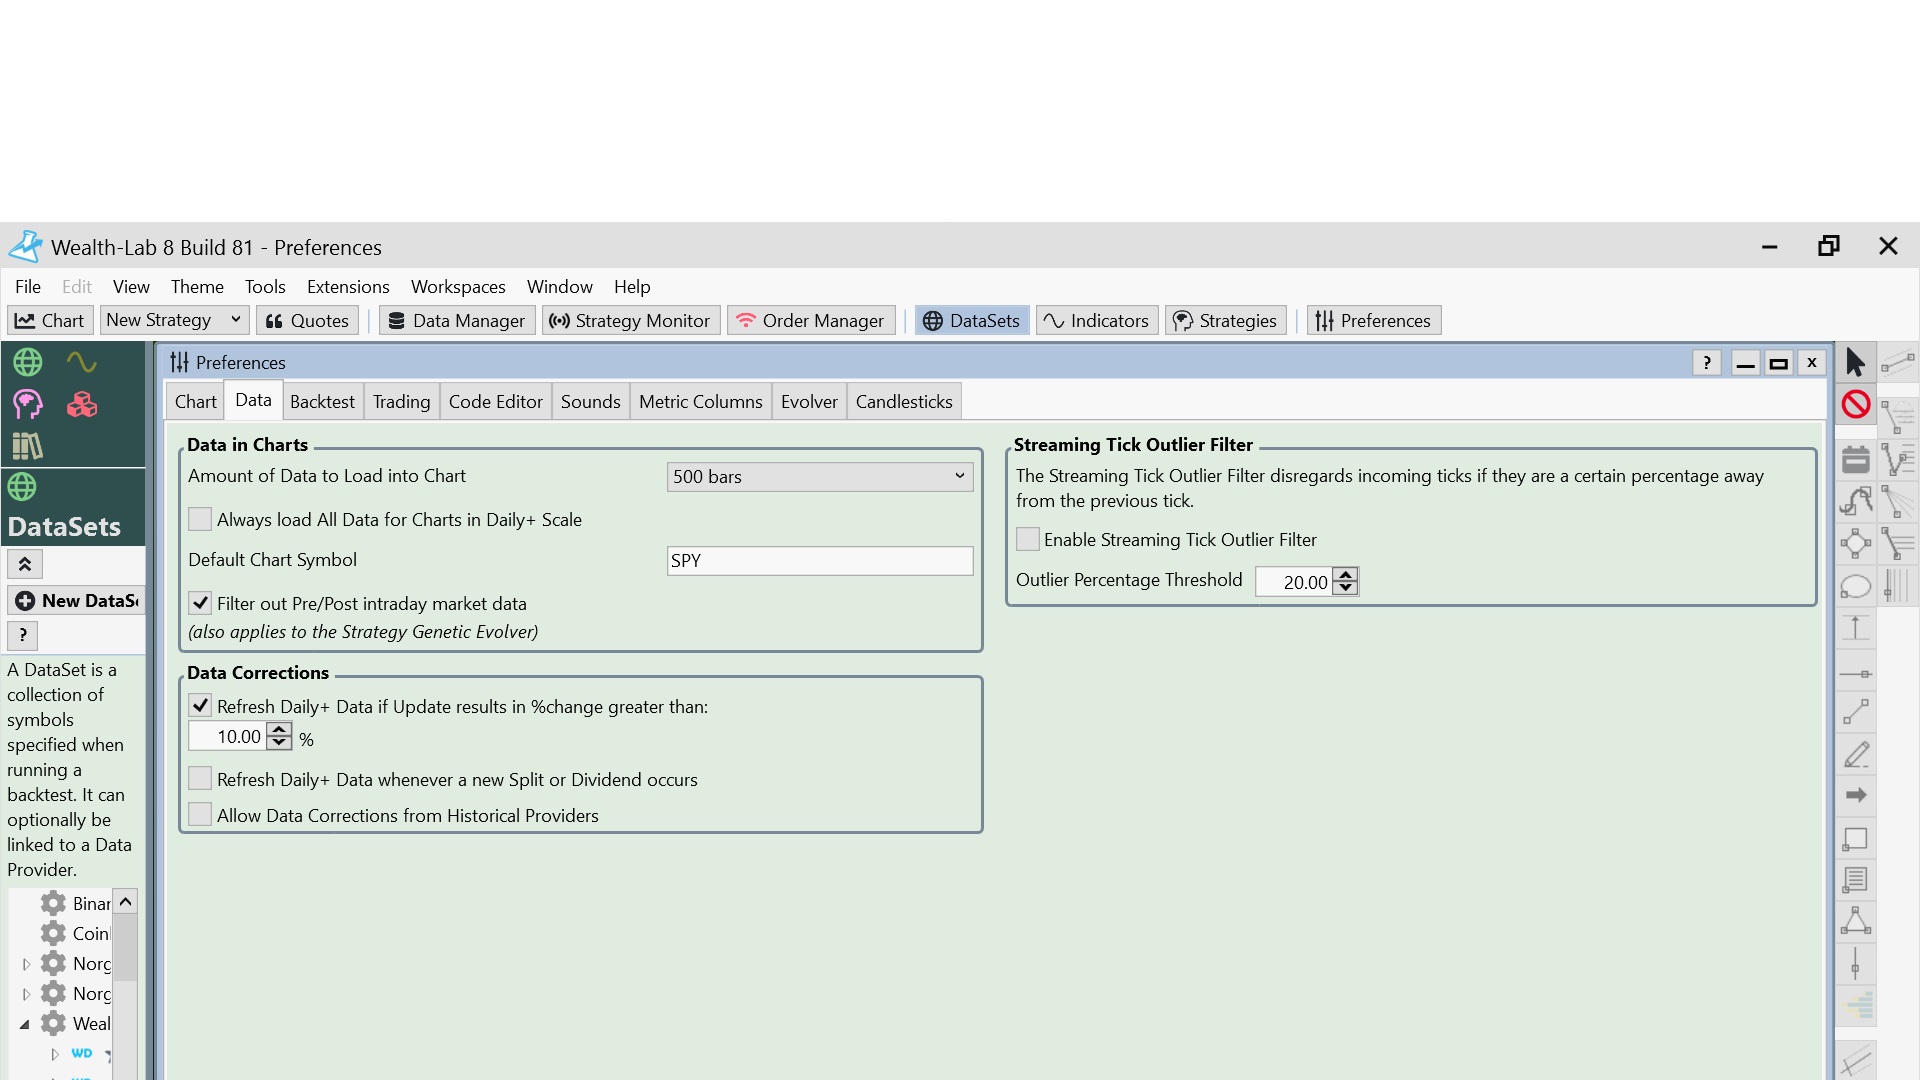
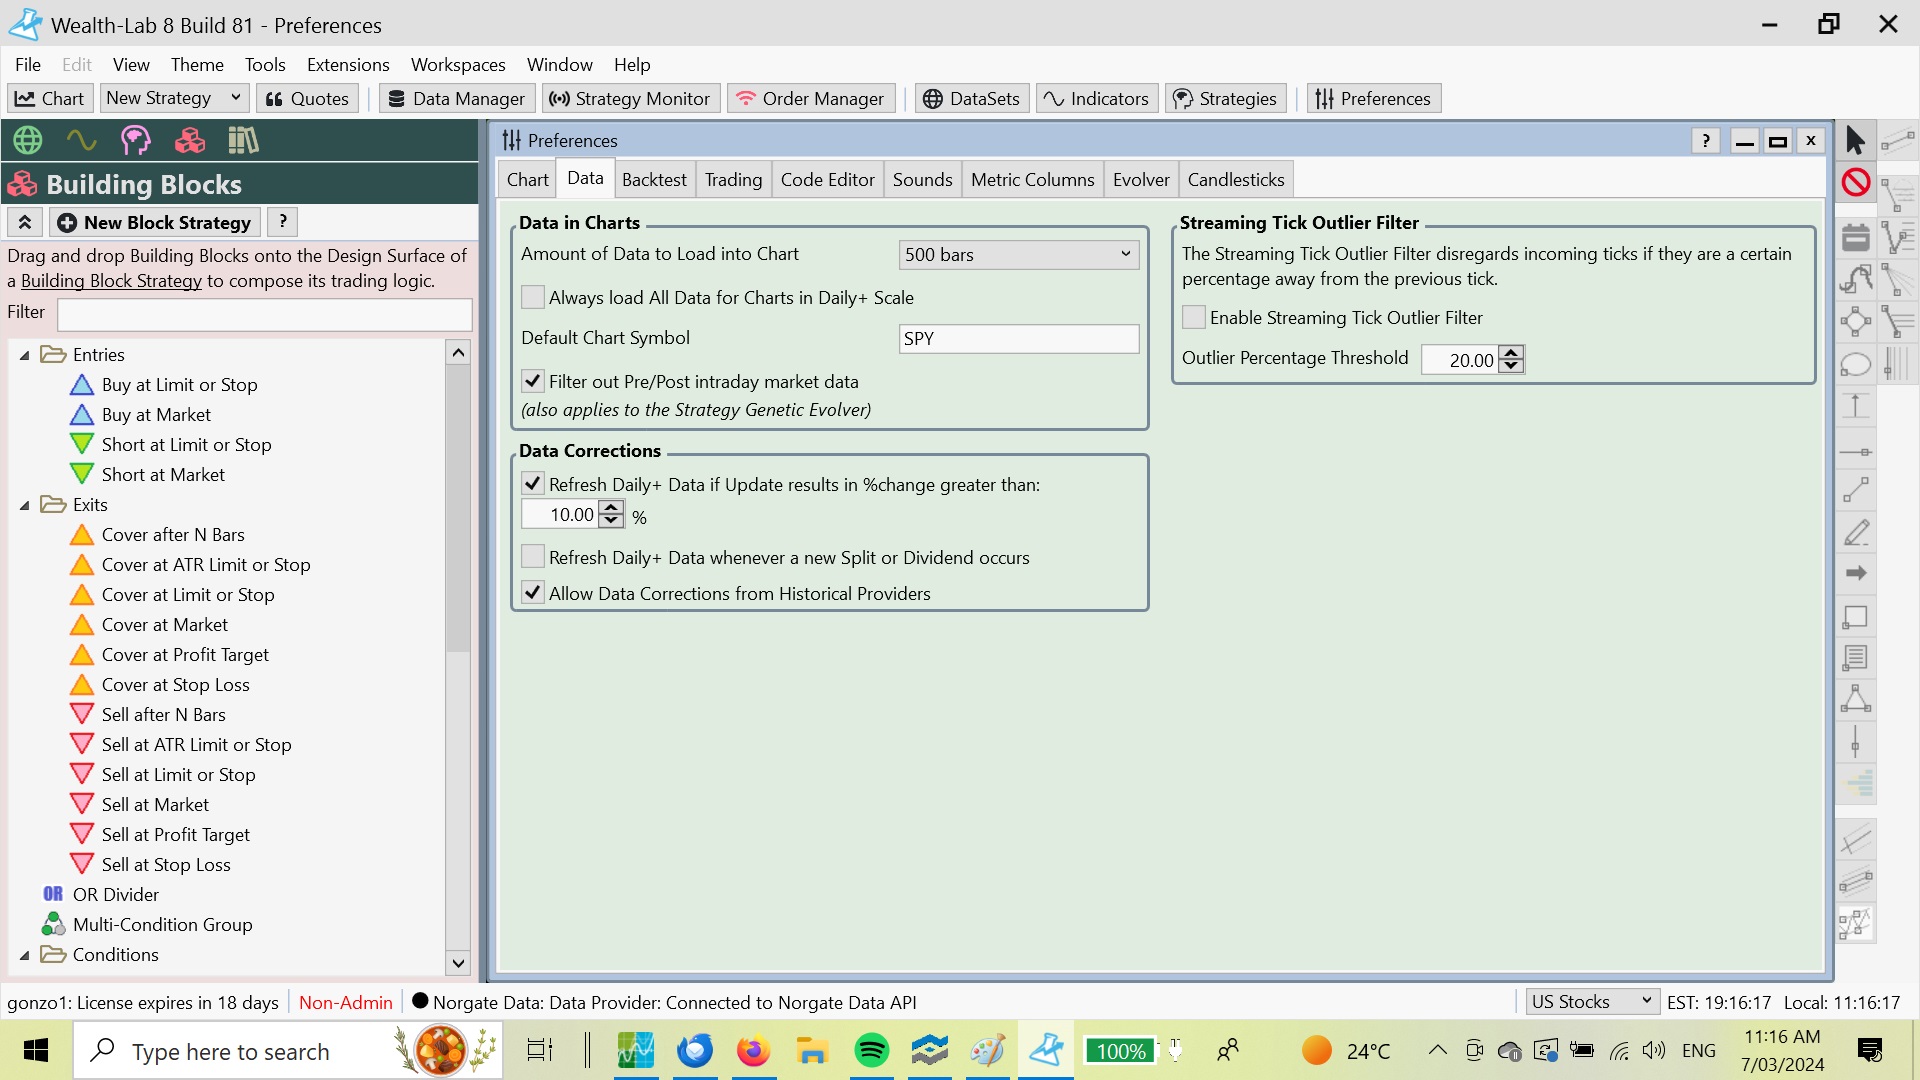
I found if i unchecked the "Allow data corrections from historical providers "
box, it fixed the problem.
I am happy to follow your suggestion but occasionally I do use WL data so if I uncheck that WL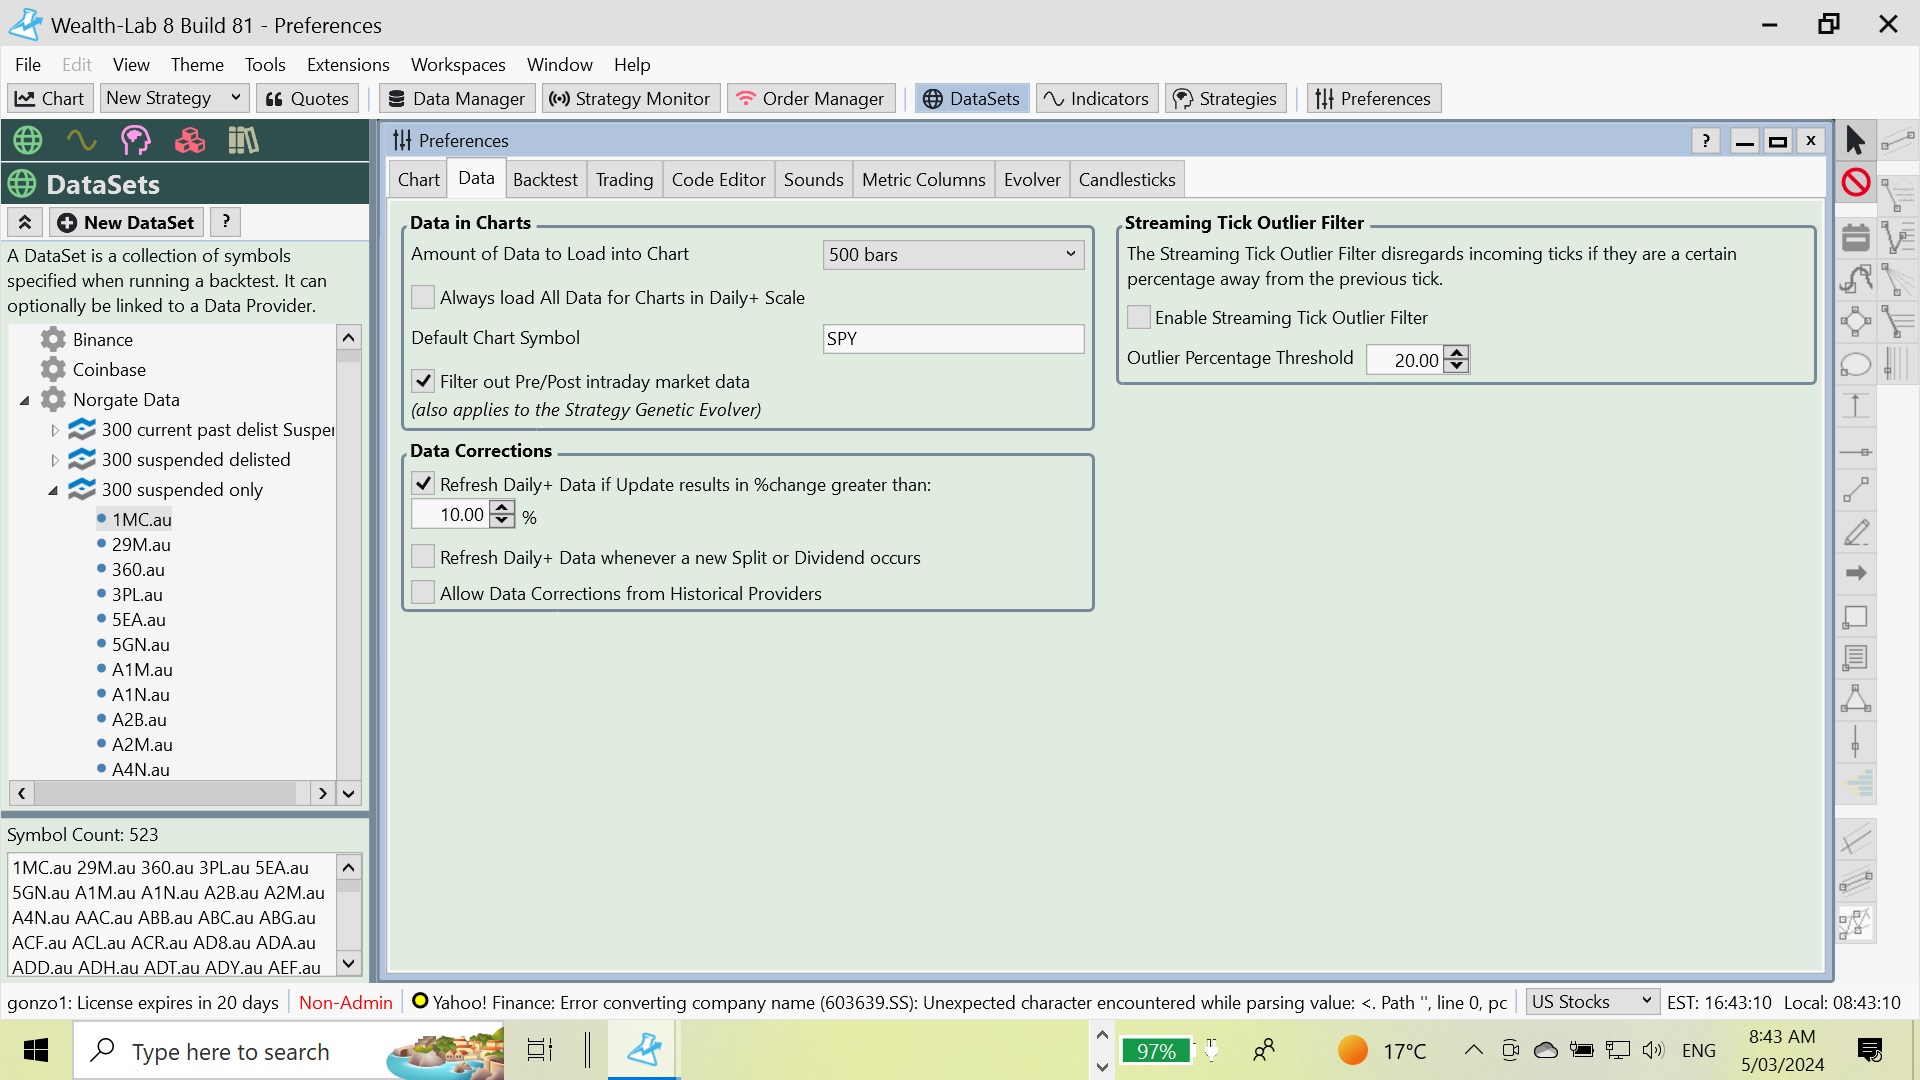 box (the Norgate data box is already checked) will it then affect the WL data?
I found if i unchecked the "Allow data corrections from historical providers "
box, it fixed the problem.
I am happy to follow your suggestion but occasionally I do use WL data so if I uncheck that WL
box (the Norgate data box is already checked) will it then affect the WL data?
I’m not suggesting you uncheck it.
Just click the Norgate Data item name (not the check box) so we can see it’s settings and not WealthData settings 🤷🏼♂️
Just click the Norgate Data item name (not the check box) so we can see it’s settings and not WealthData settings 🤷🏼♂️
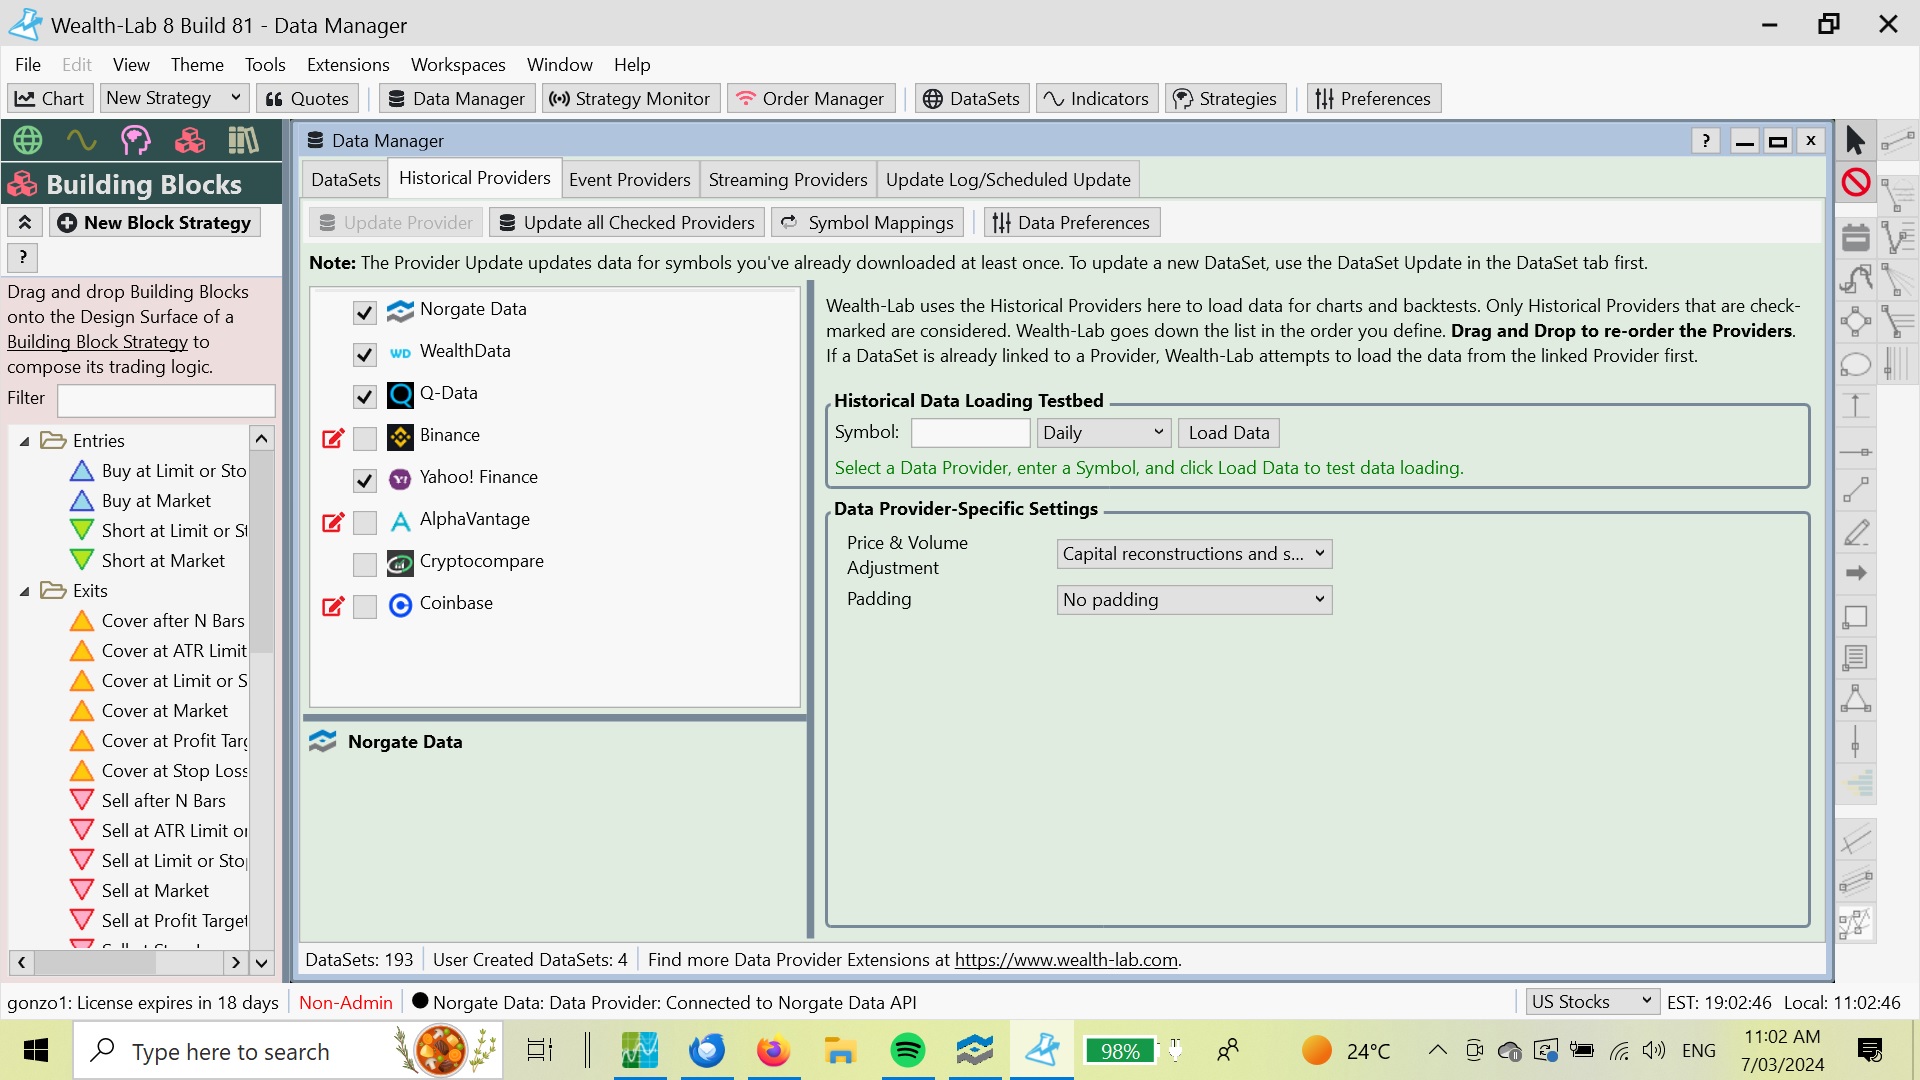
This is what we'd like to see.
Also if you want WL8 to load Norgate by default, you should move it to the top of this list by drag and drop.
Also if you want WL8 to load Norgate by default, you should move it to the top of this list by drag and drop.
How does that look?
I ran another back test and does seem to be ok now.
How does the order of data providers look? As suggested I dropped Norgate to the top of the list.
Looks good! 👍
Ok!
thank for your help,
all the best
Peter
thank for your help,
all the best
Peter
Your Response
Post
Edit Post
Login is required