I posted in wealthlab6 by mistake. I'll try running the breakout strategy tomorrow and see if same issue occurs.
The code is modified from genetic evolver. I don't think the strategy is manipulating the bars.
Rename
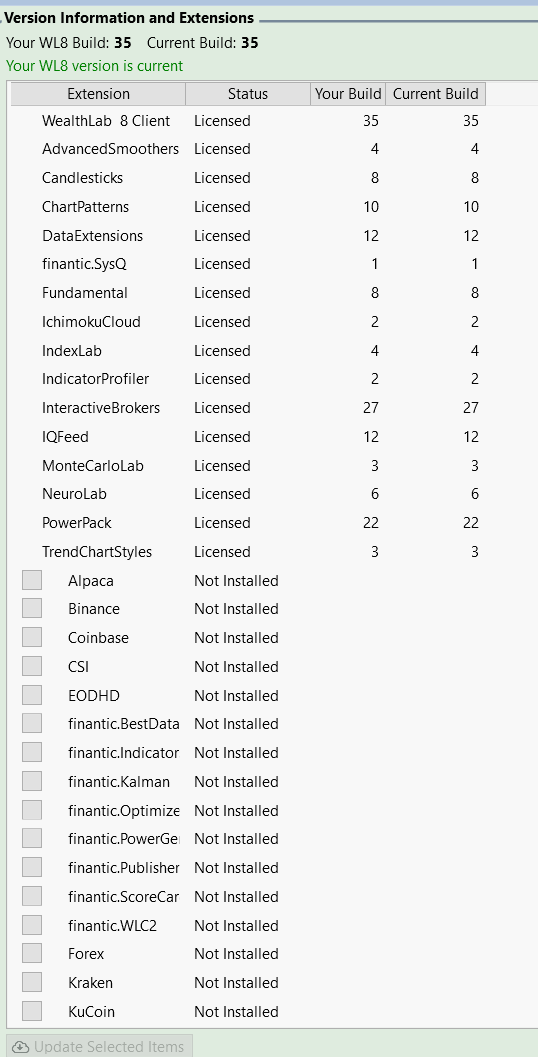
So you're running B34 as you said but that's not enough. Did I say on the WL6 forum where you had posted first that the chart is secretive and the data providers are undisclosed?
Historical and streaming data providers?
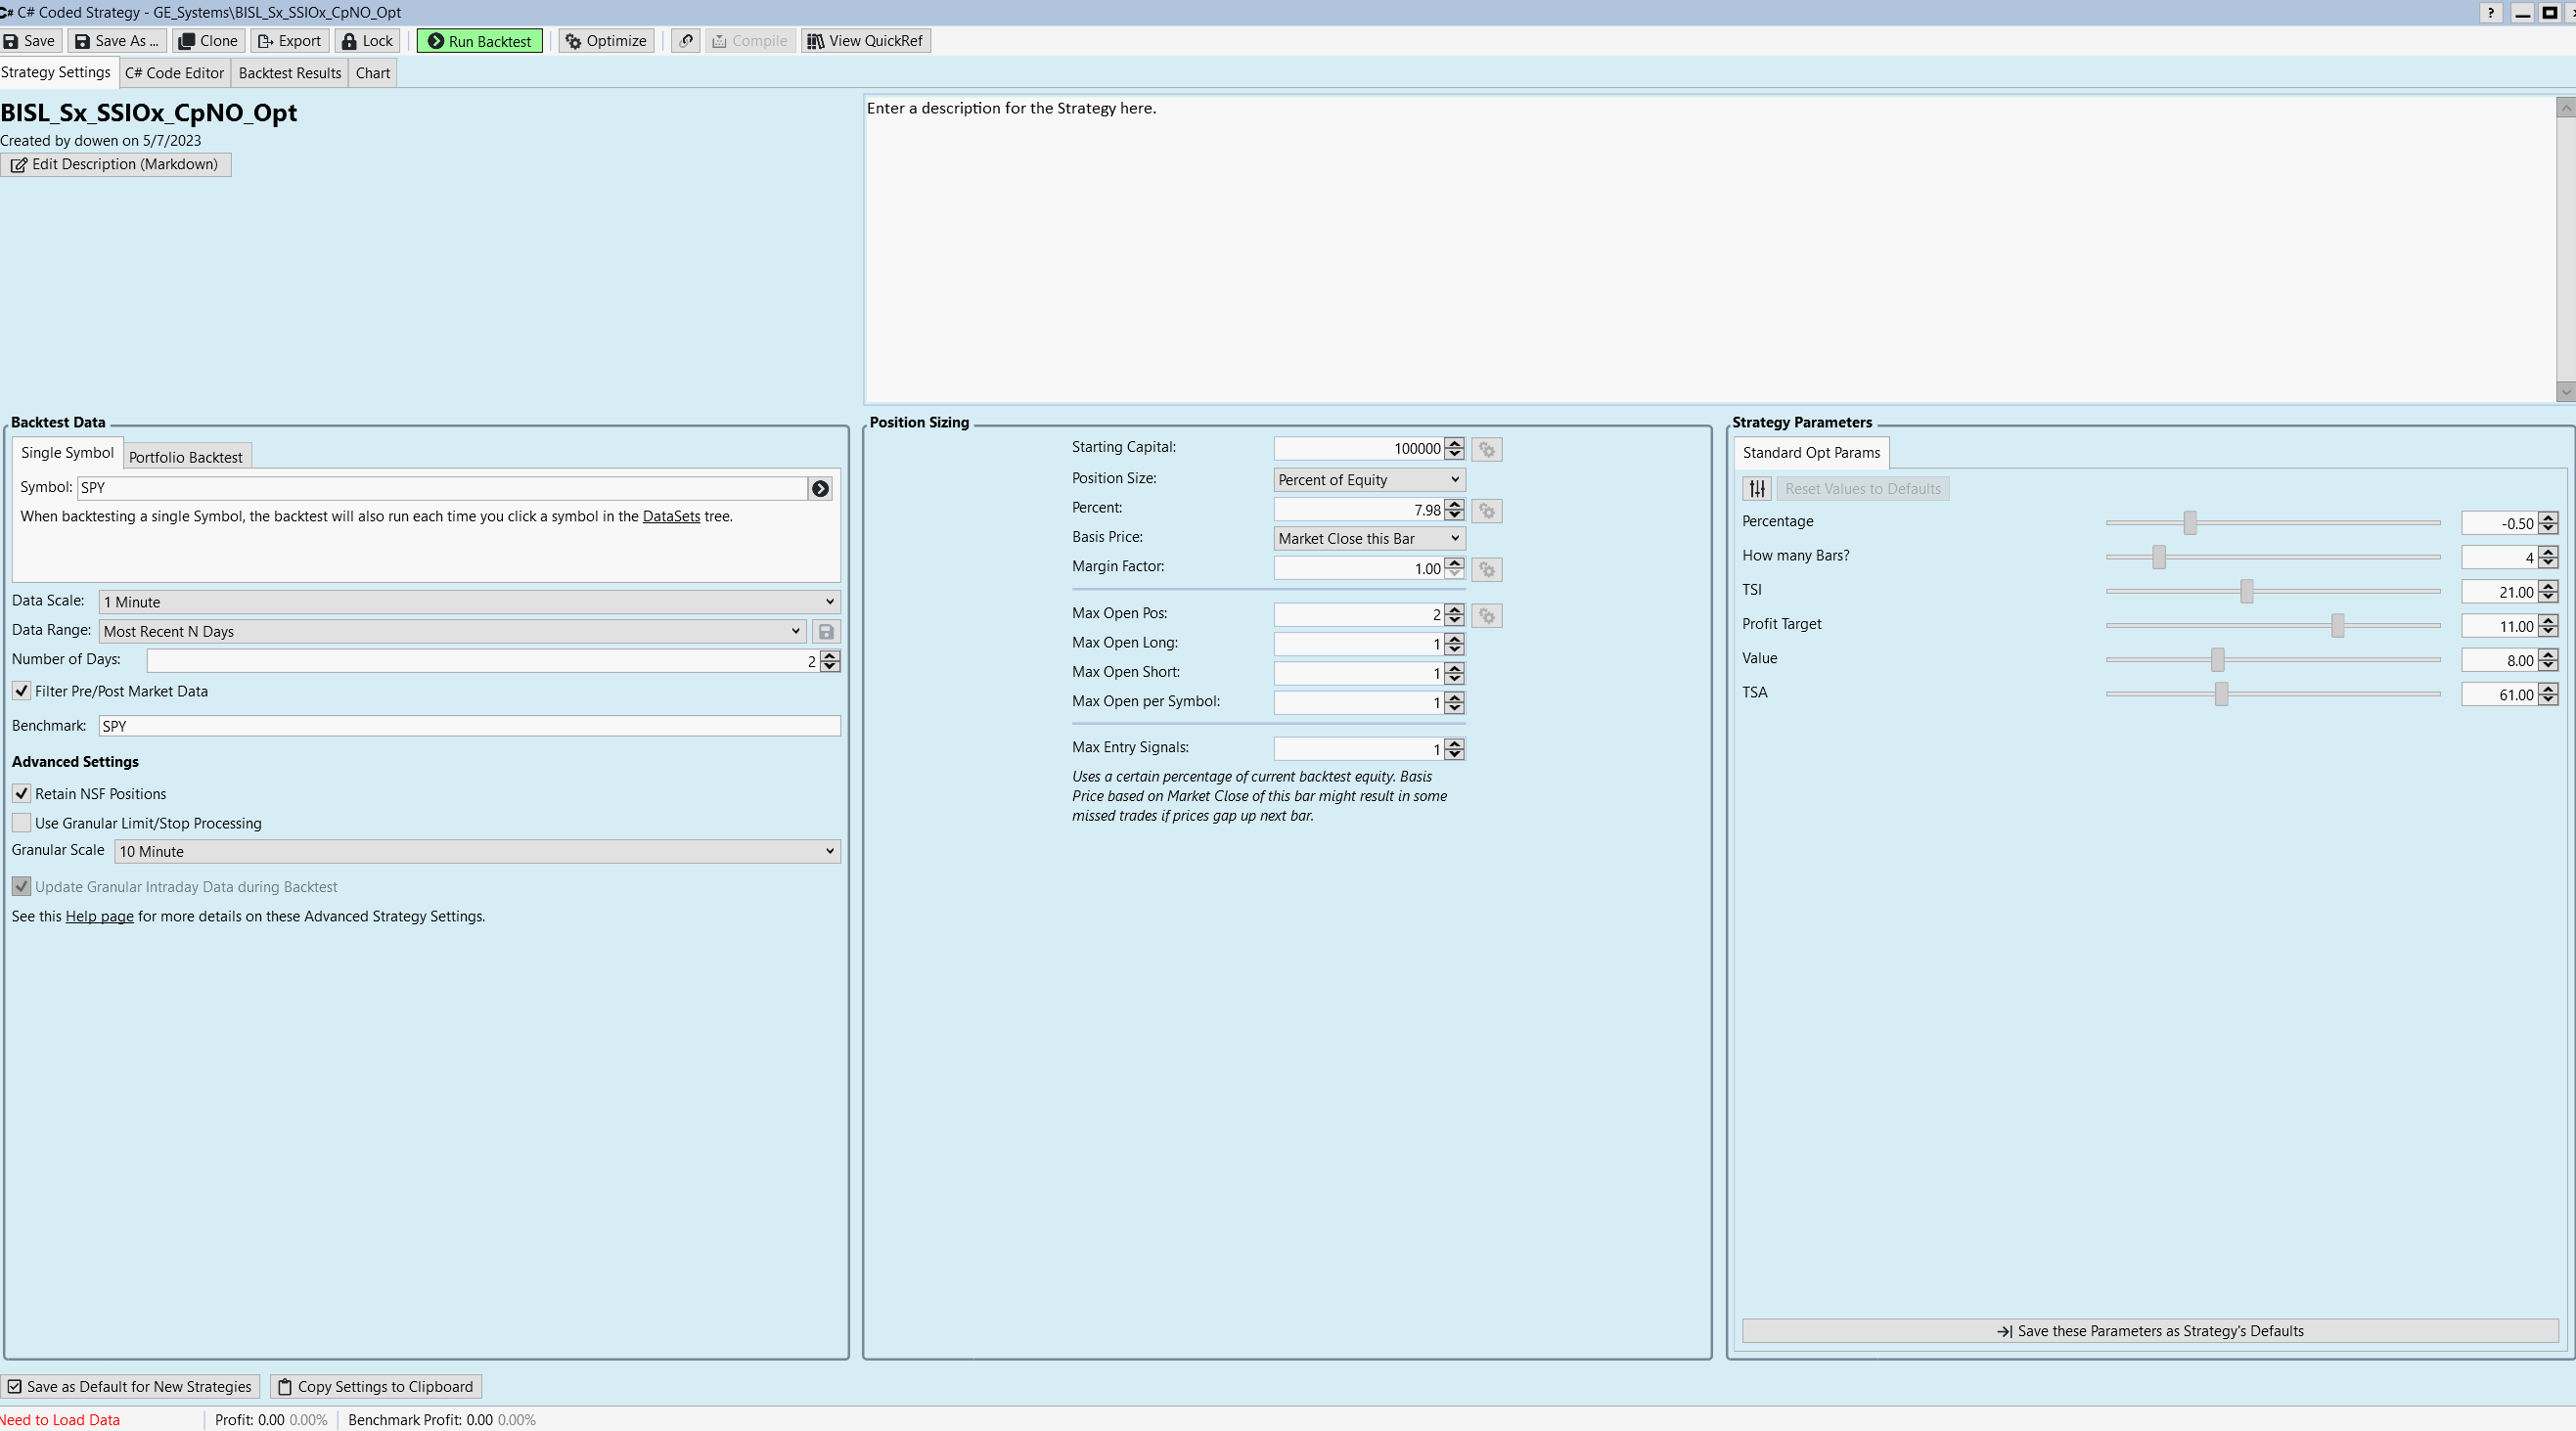
Strategy settings? Take a screenshot so we have an idea of everything including the market details.
Time zone?
etc.
The more information the better.
Historical and streaming data providers?
Strategy settings? Take a screenshot so we have an idea of everything including the market details.
Time zone?
etc.
The more information the better.
Here you go. This is original code from GE. I'll double check the issue this morning in 20 min. Time Zone is PST and I'm using IQFeed and IB.
CODE:

using WealthLab.Backtest;
using System;
using WealthLab.Core;
using WealthLab.Data;
using WealthLab.Indicators;
using System.Collections.Generic;
using WealthLab.AdvancedSmoothers;
using WealthLab.PowerPack;


namespace WealthScript4
{
    public class MyStrategy : UserStrategyBase
    {
       public MyStrategy() : base()
        {
         AddParameter("Percentage", ParameterType.Double, -0.5, -1, 1, 0.1);
         AddParameter("How many Bars?", ParameterType.Int32, 4, 1, 20, 1);
         AddParameter("TSI", ParameterType.Double, 21, 0, 50, 1);
         AddParameter("Profit Target", ParameterType.Double, 11, 2, 15, 1);
         AddParameter("Value", ParameterType.Double, 8, 4, 16, 1);
         AddParameter("TSA", ParameterType.Double, 61, 30, 120, 5);

            StartIndex = 95;
        }

        public override void Initialize(BarHistory bars)
        {
         indicator = new ATRBandUpper(bars,bars.Close,21,1.86);
         PlotIndicator(indicator,new WLColor(0,0,0));
         smoother = new VIDYA(indicator,18);
         smoother.ParentIndicator = indicator;
         PlotIndicator(smoother,new WLColor(0,0,255));
         source = bars.Open;
         pct = Parameters[0].AsDouble;
         pct = (100.0 - pct) / 100.0;
         multSource = source * pct;
         PlotStopsAndLimits(3);
         externalSymbol = GetHistory(bars, "QLD");
         indicator2 = new TSI(externalSymbol.Open,21,11);
         PlotIndicator(indicator2,new WLColor(255,0,0),default,default,"QLDPane");
         source2 = bars.Close;
         pct2 = 0.00;
         pct2 = (100.0 - pct2) / 100.0;
         multSource2 = source2 * pct2;
         PlotStopsAndLimits(3);
         indicator3 = new ConsecDown(bars.Close,5);
         PlotIndicator(indicator3,new WLColor(0,128,0));
         indicator4 = new TrendStrengthA(bars.Open,16,95,16);
         PlotIndicator(indicator4,new WLColor(255,165,0));
         PlotStopsAndLimits(3);

        }

        public override void Execute(BarHistory bars, int idx)
        {
         int index = idx;
         bool condition0;
            condition0 = false;
            {
               if (indicator.CrossesUnder(smoother, index))
               {
                  condition0 = true;
               }
            }
            if (condition0)
            {
               val = multSource[idx];
               _transaction = PlaceTrade(bars, TransactionType.Buy, OrderType.Limit, val, 0,"Buy at Limit 0% below Open");
            }
            condition0 = false;
            {
               condition0 = true;
            }
            if (condition0)
            {
            foreach(Position foundPosition0 in OpenPositions)
            {
               if (foundPosition0.PositionTag == 0)
               {
                  if (idx - foundPosition0.EntryBar + 1 >= Parameters[1].AsInt)
                  {
                     ClosePosition(foundPosition0, OrderType.Market, 0,"Sell after 4 bars");
                  }
               }
            }
            }
         bool condition1;
            condition1 = false;
            {
               if (indicator2[index] > Parameters[2].AsDouble)

               {
                  condition1 = true;
               }
            }
            if (condition1)
            {
               val2 = multSource2[idx];
               _transaction = PlaceTrade(bars, TransactionType.Short, OrderType.Limit, val2, 1,"Short at Limit 0% below Close");
            }
            condition1 = false;
            {
               if (indicator3[index] >= Parameters[4].AsDouble)
               {
                  if (indicator4[index] < Parameters[5].AsDouble)
                  {
                     condition1 = true;
                  }
               }
            }
            if (condition1)
            {
            foreach(Position foundPosition1 in OpenPositions)
            {
               if (foundPosition1.PositionTag == 1)
               {

                  ClosePosition(foundPosition1, OrderType.Limit, foundPosition1.EntryPrice * (1.0 - Parameters[3].AsDouble / 100.0), "Cover at 10.69% profit target");
               }
            }
            }

        }

        public override void NewWFOInterval(BarHistory bars)
        {
         indicator = new ATRBandUpper(bars,bars.Close,21,1.86);
         smoother = new VIDYA(indicator,18);
         smoother.ParentIndicator = indicator;
         source = bars.Open;
         externalSymbol = GetHistory(bars, "QLD");
         indicator2 = new TSI(externalSymbol.Open,21,11);
         source2 = bars.Close;
         indicator3 = new ConsecDown(bars.Close,5);
         indicator4 = new TrendStrengthA(bars.Open,16,95,16);

        }

      private IndicatorBase indicator;
      private IndicatorBase smoother;
      private double pct;
      private double val;
      private TimeSeries source;
      private TimeSeries multSource;
      private IndicatorBase indicator2;
      private BarHistory externalSymbol;
      private double pct2;
      private double val2;
      private TimeSeries source2;
      private TimeSeries multSource2;
      private IndicatorBase indicator3;
      private IndicatorBase indicator4;

      private Transaction _transaction;
    }
}
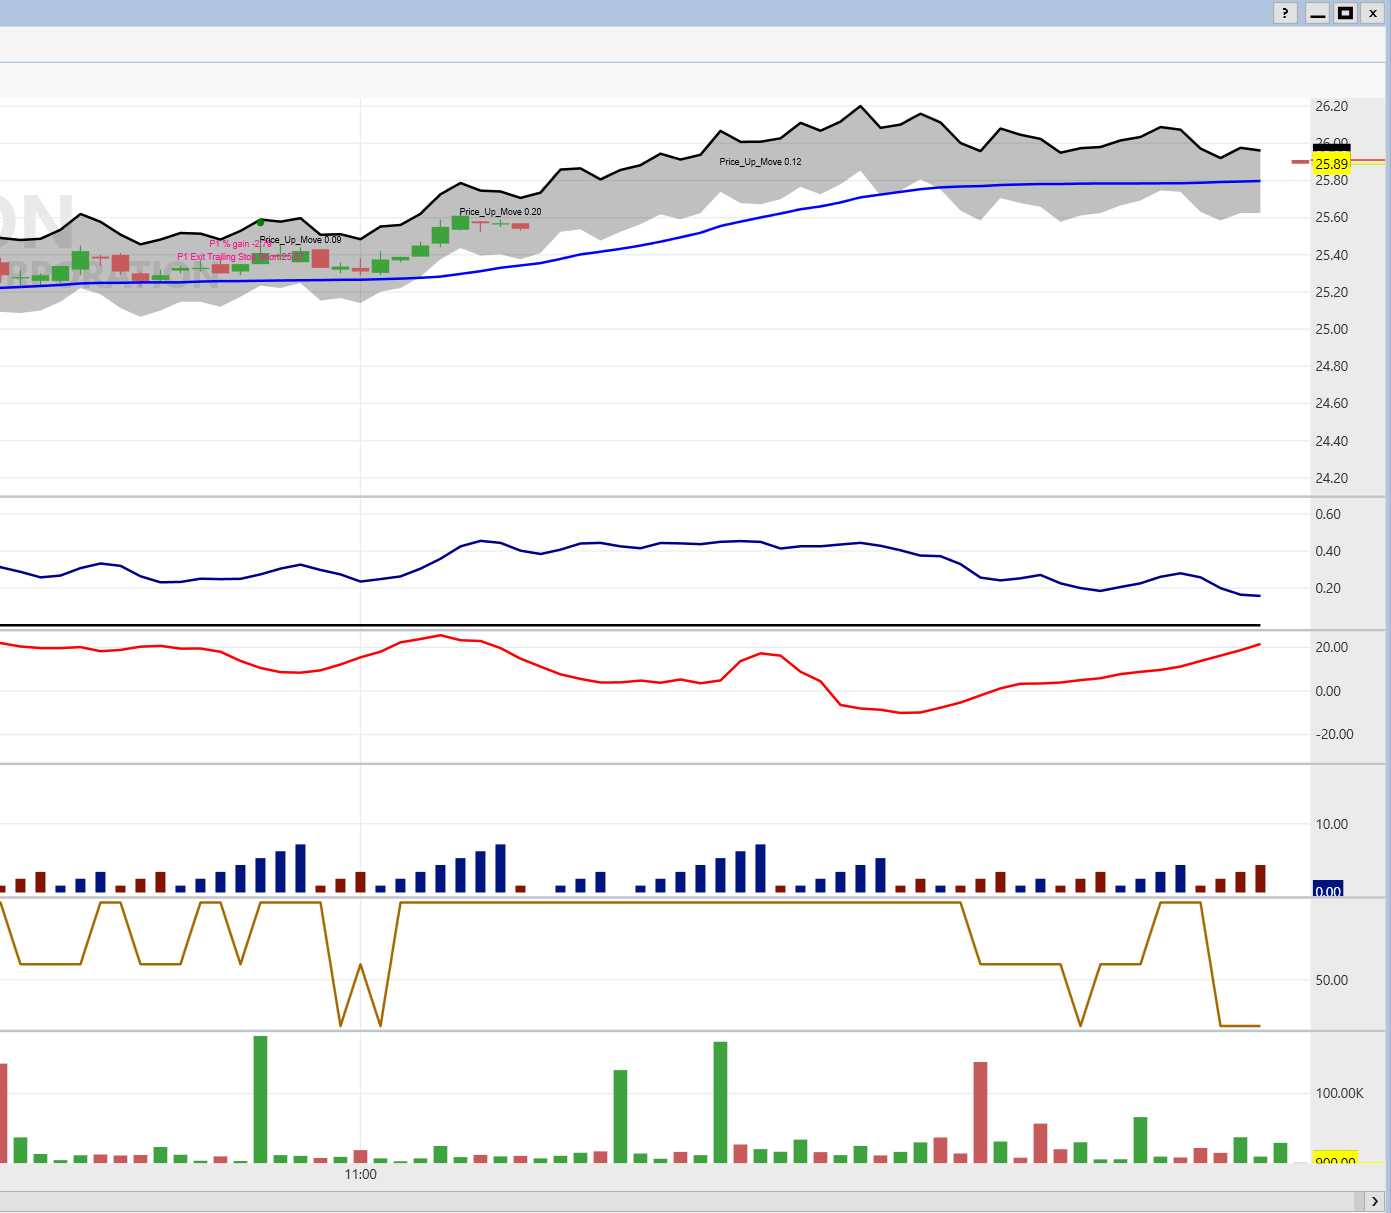
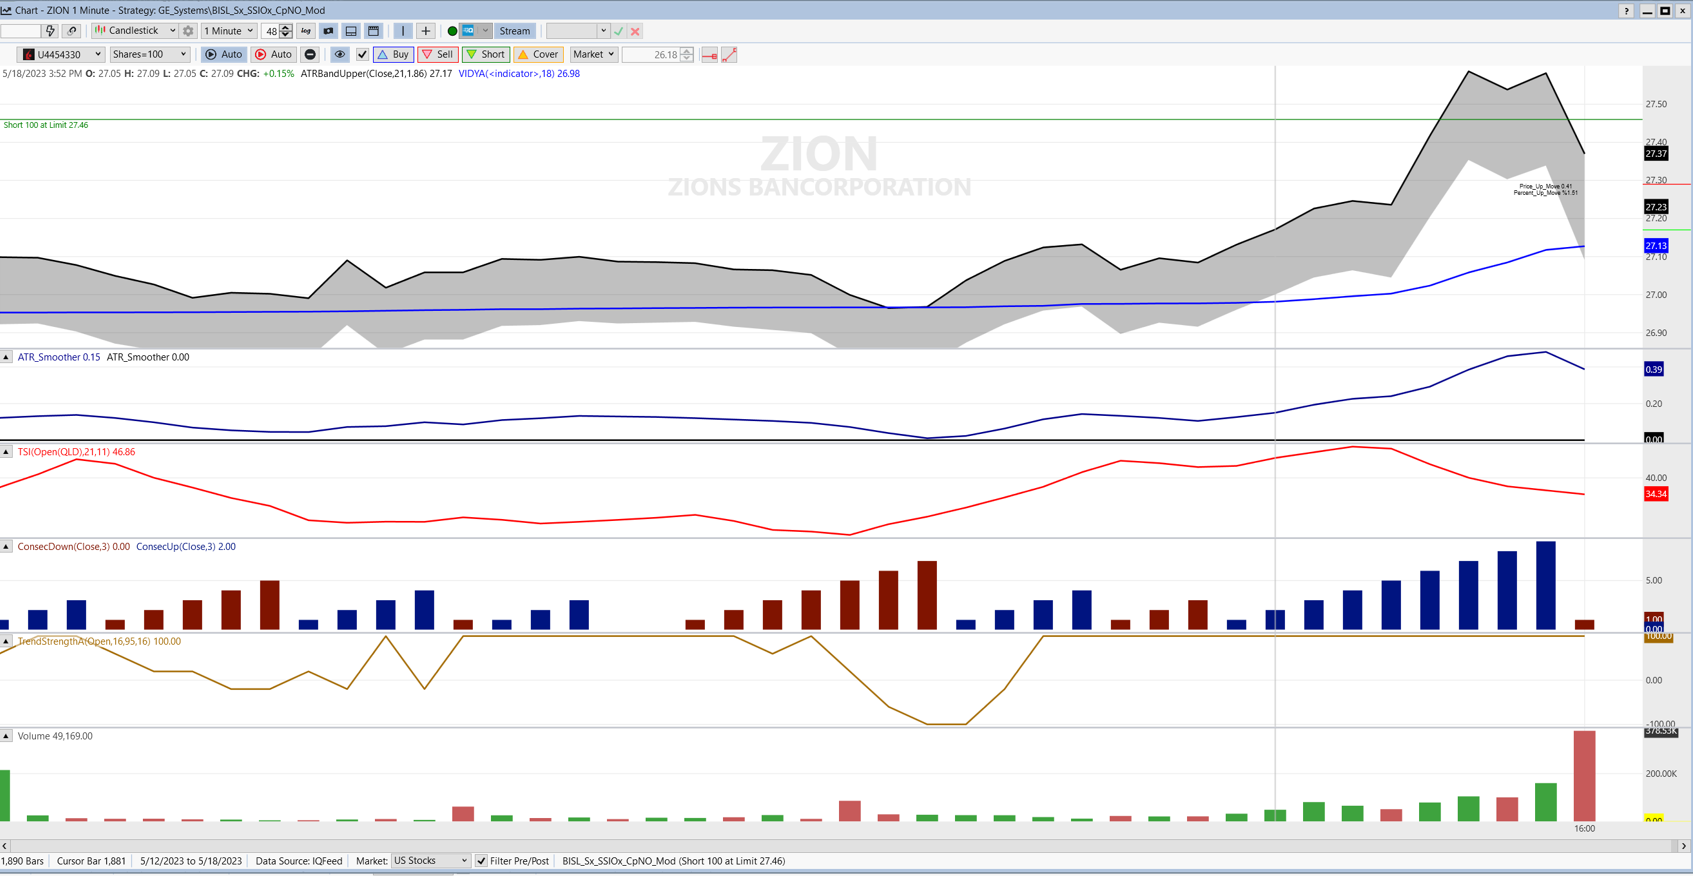
Thanks. Looks weird. (Where have the bars go?)
System.ComponentModel.Win32Exception (122): The data area passed to a system call is too small.
at MS.Win32.UnsafeNativeMethods.GetWindowText(HandleRef hWnd, StringBuilder lpString, Int32 nMaxCount)
at System.Windows.Automation.Peers.WindowAutomationPeer.GetNameCore()
at System.Windows.Automation.Peers.AutomationPeer.UpdateSubtree()
at System.Windows.ContextLayoutManager.fireAutomationEvents()
at System.Windows.ContextLayoutManager.UpdateLayout()
at System.Windows.ContextLayoutManager.UpdateLayoutCallback(Object arg)
at System.Windows.Media.MediaContext.FireInvokeOnRenderCallbacks()
at System.Windows.Media.MediaContext.RenderMessageHandlerCore(Object resizedCompositionTarget)
at System.Windows.Media.MediaContext.RenderMessageHandler(Object resizedCompositionTarget)
at System.Windows.Threading.ExceptionWrapper.InternalRealCall(Delegate callback, Object args, Int32 numArgs)
at System.Windows.Threading.ExceptionWrapper.TryCatchWhen(Object source, Delegate callback, Object args, Int32 numArgs, Delegate catchHandler)
When you move the mouse over the non visible bars what kind of values do you see reported in the headers?
Also I'm running 7 charts at once and 3 are updating and 4 are not updating
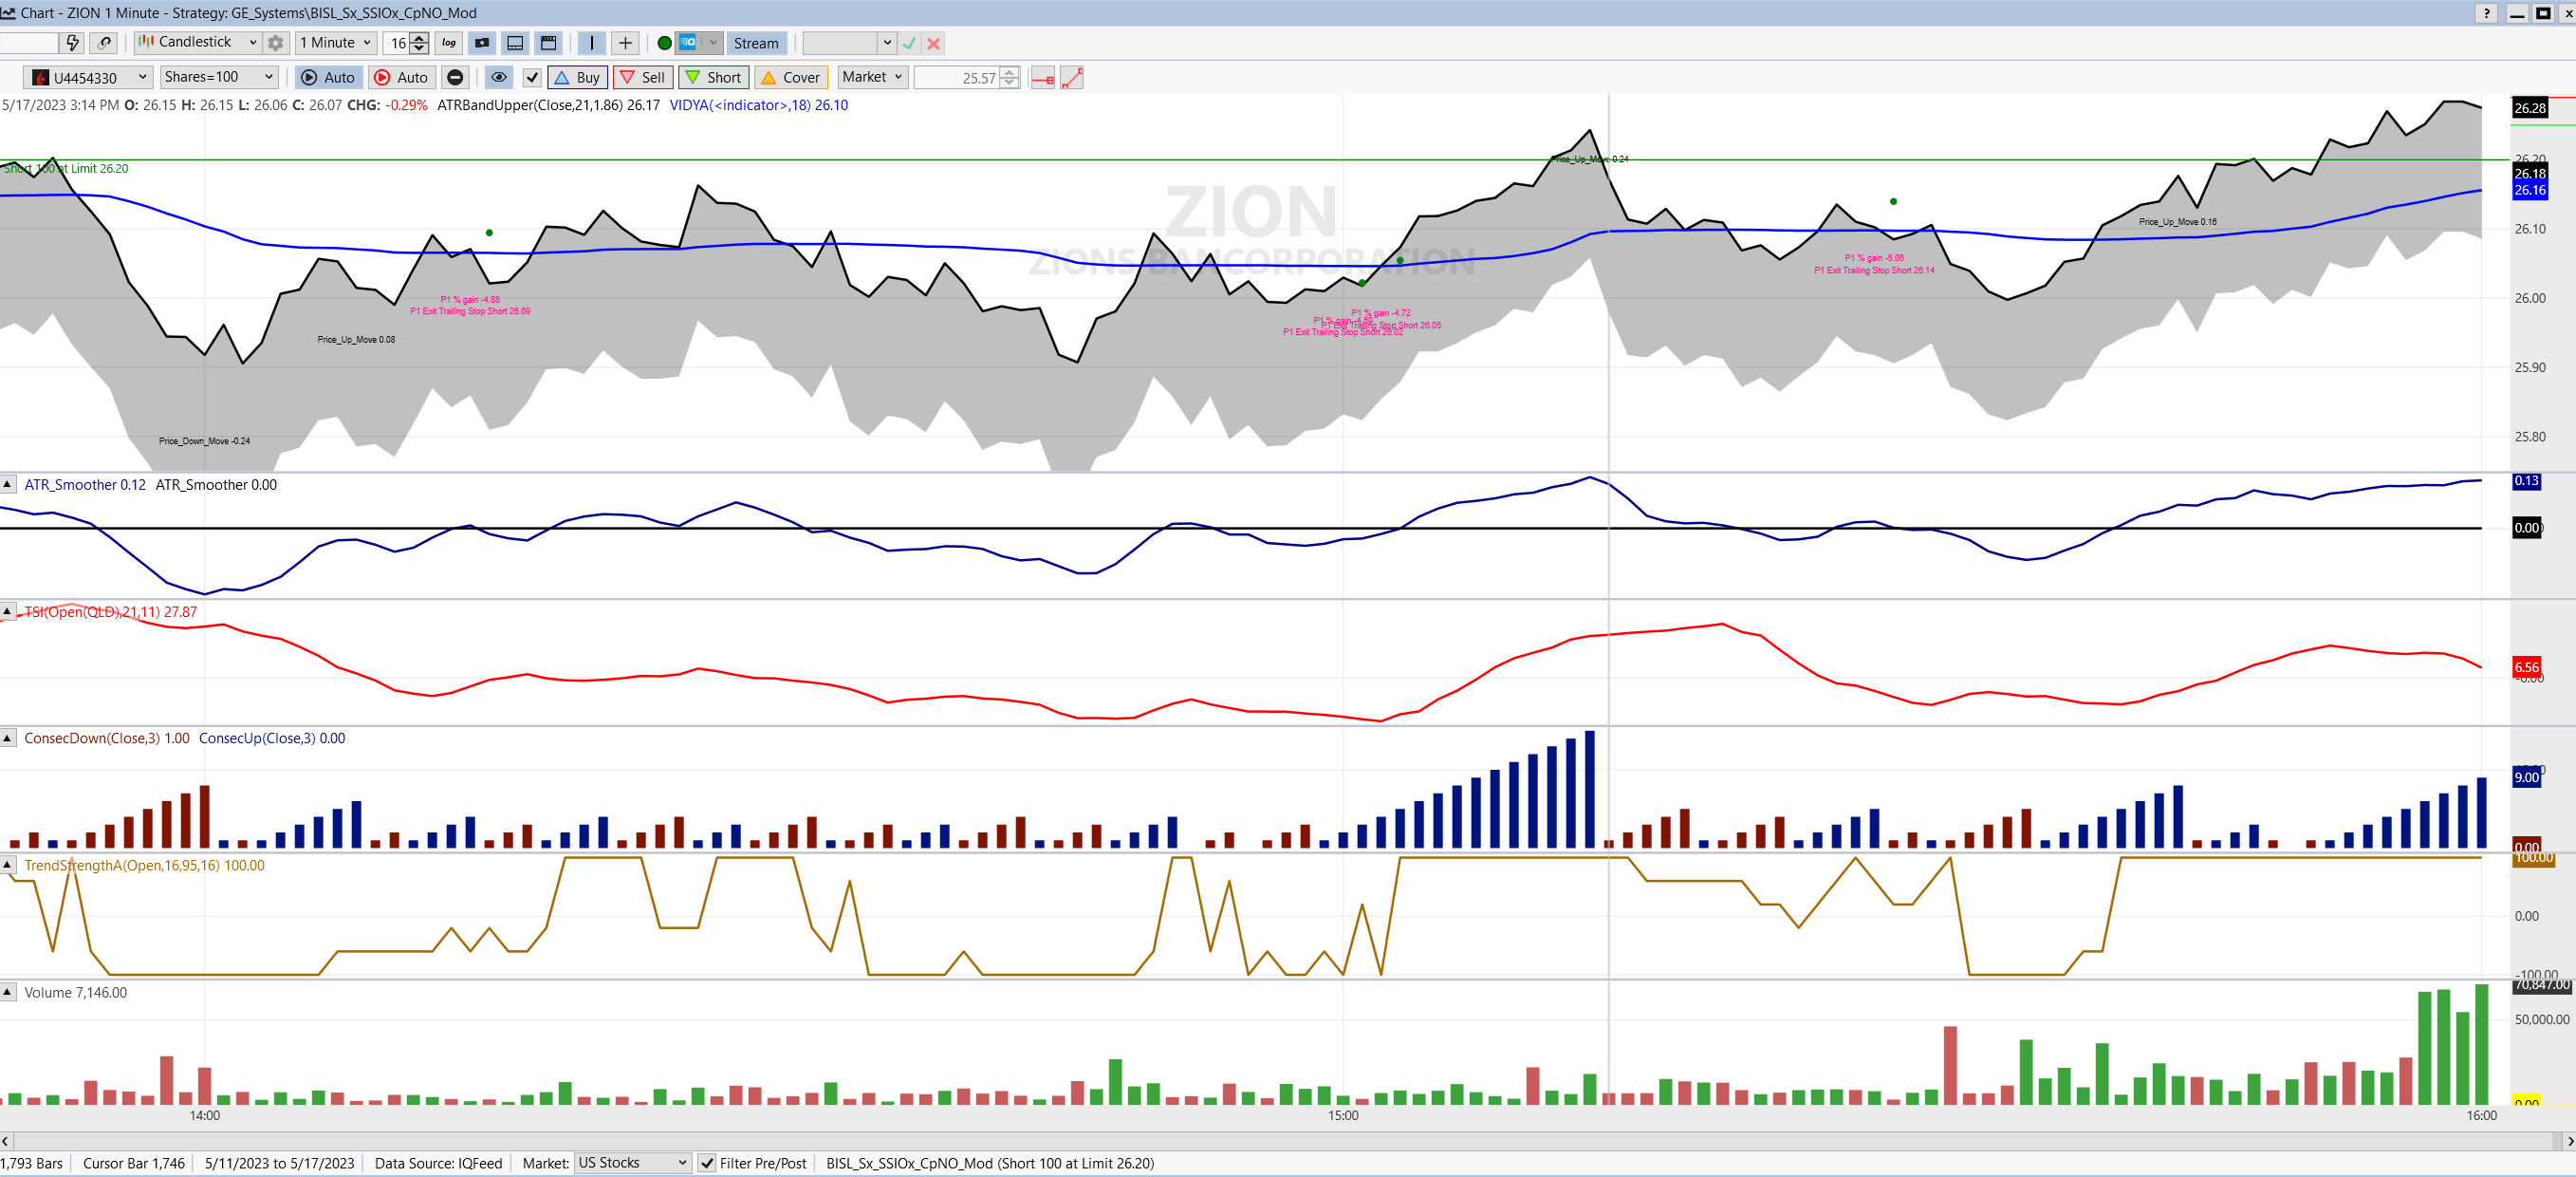
All the values are there. Only the candlestick is not visible. I don't recall when this started showing up. I haven't brought it up as my strategy runs. I also thought it was related to some coding I was doing. But then when I started seeing it on GE generated code I thought I would bring it up.
QUOTE:
System.ComponentModel.Win32Exception (122): The data area passed to a system call is too small.
This isn't a Wealth-Lab error, Microsoft's been trying to fix it in their WPF framework WL is built upon:
https://github.com/dotnet/wpf/issues/6026
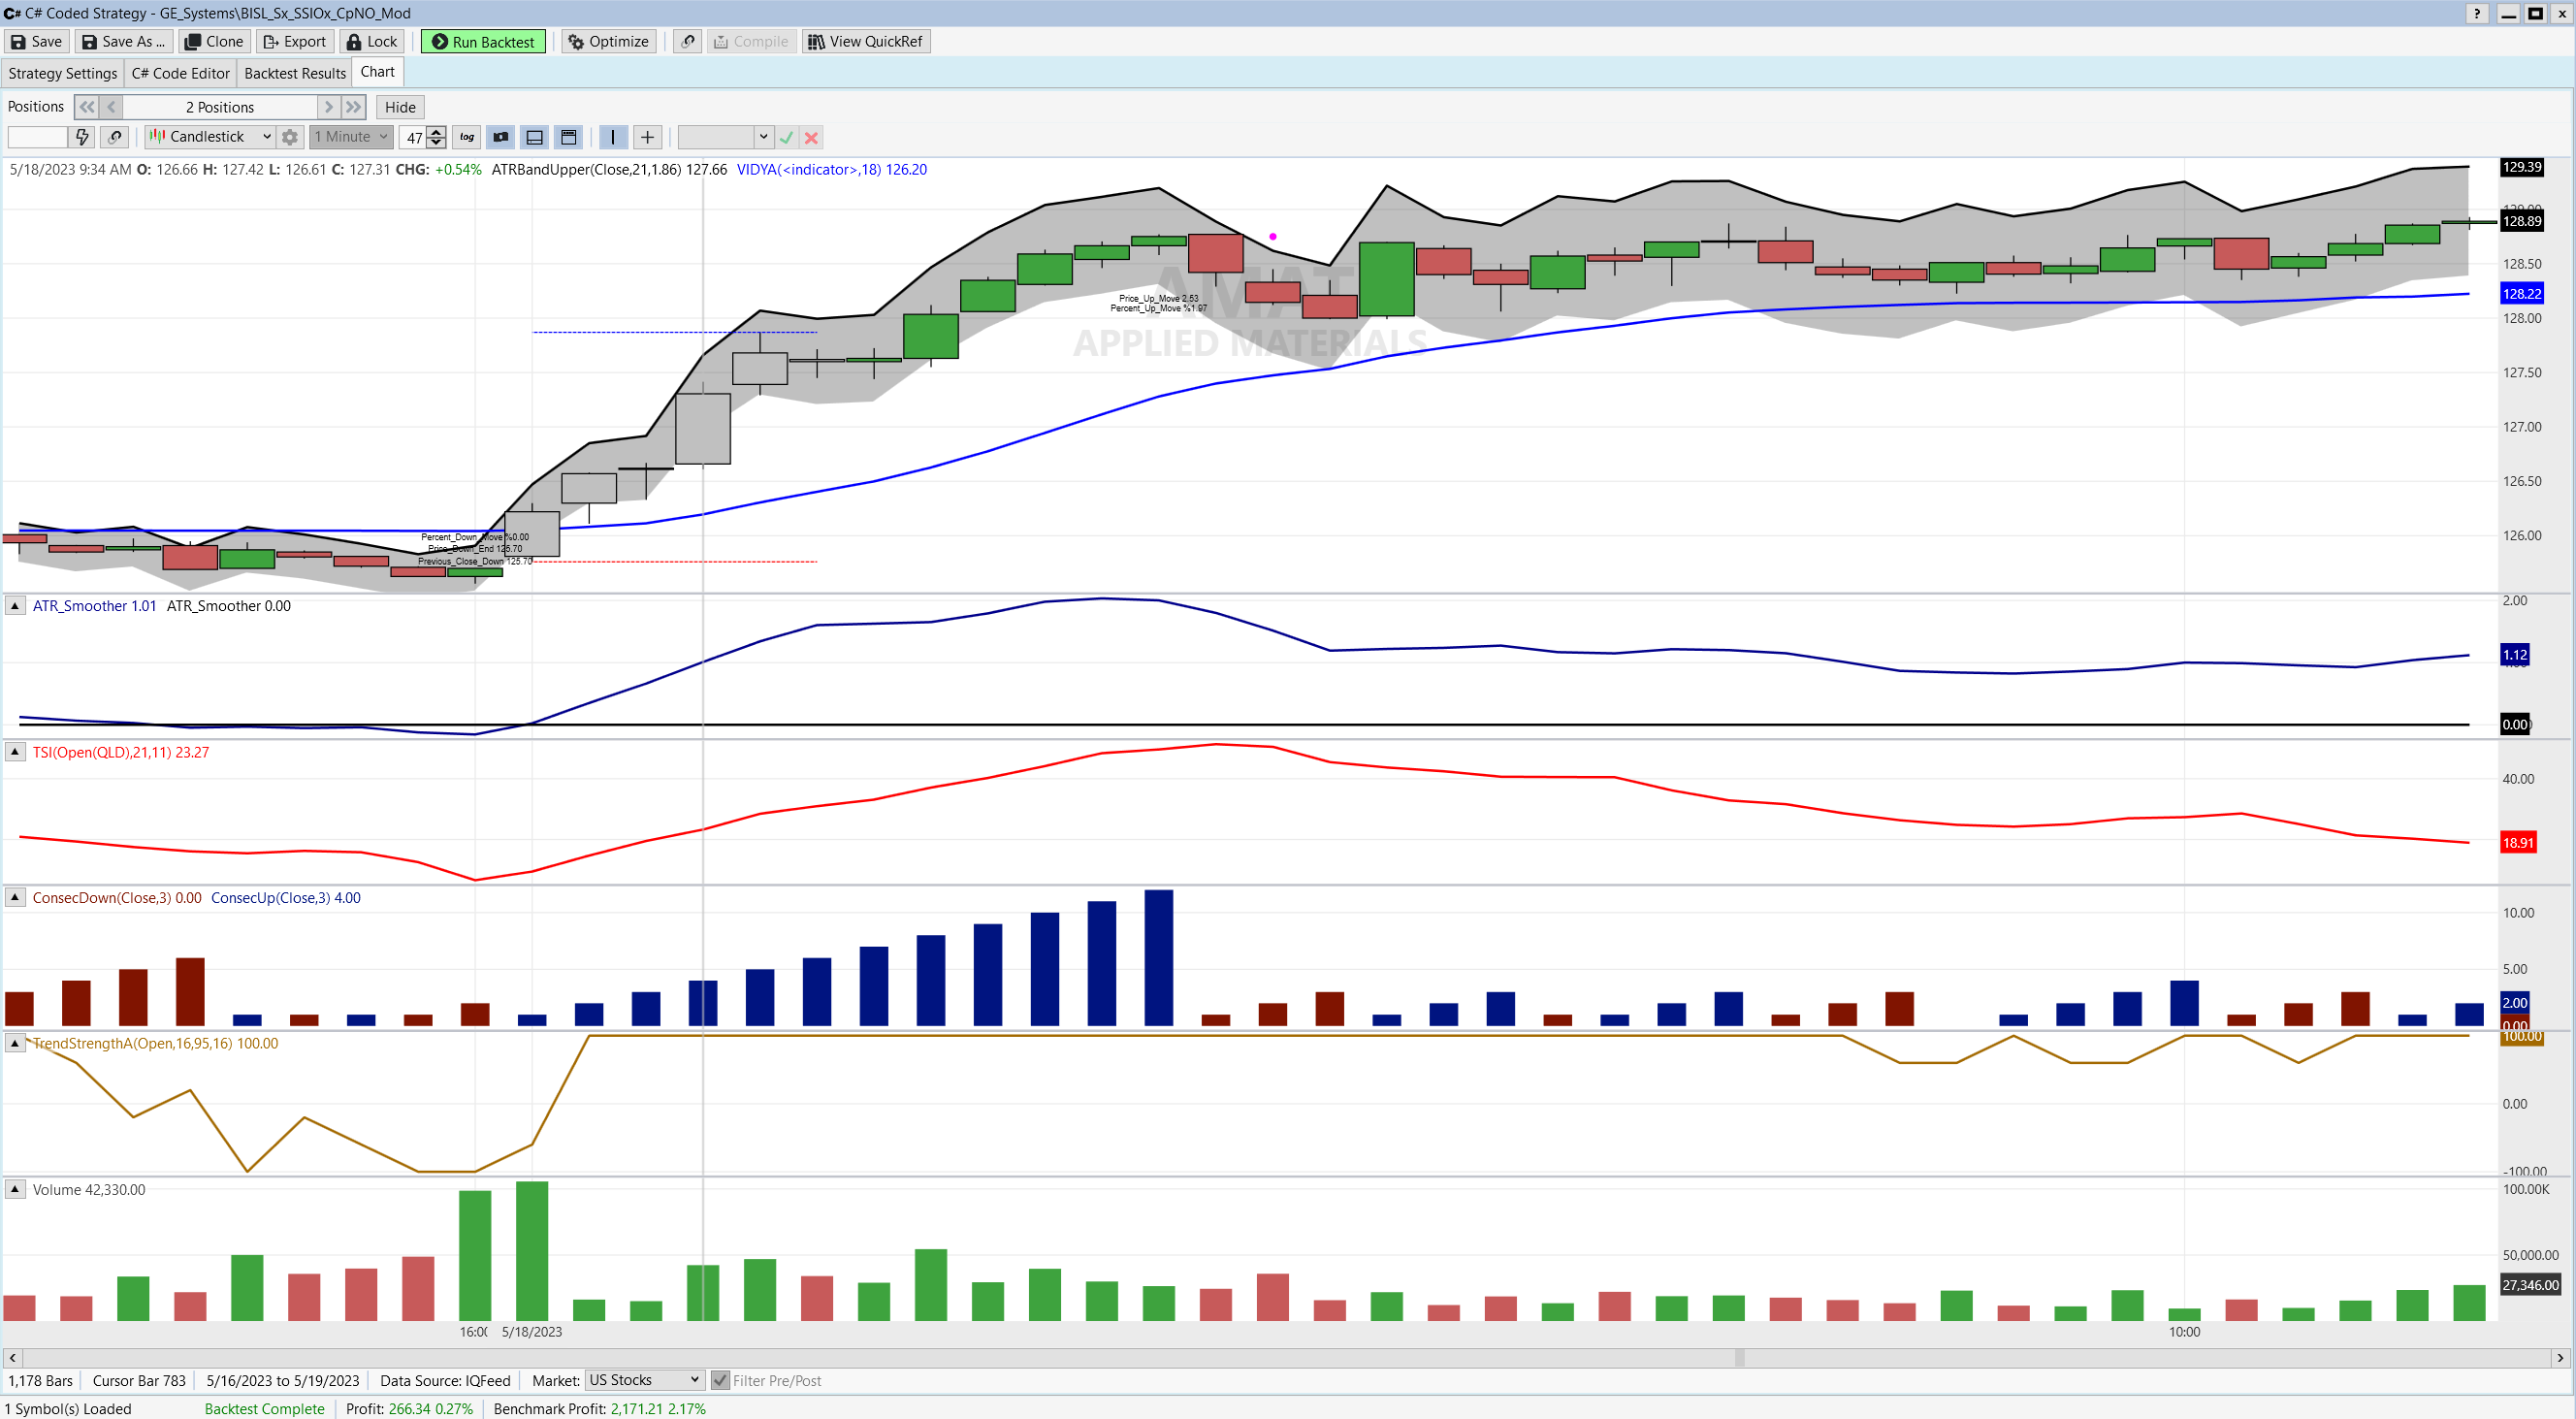
I added the code from Open Range Breakout strategy and it over writes the candles.
CODE:

         if (bars.IntradayBarNumber(idx) <= num) // highlight the opening range
            SetBarColor(bars, idx, WLColor.Silver);

         if (bars.IntradayBarNumber(idx) == num) // get the highest high and the lowest low after first hour
         {
            HighRange = Highest.Series(bars.High, num + 1)[idx];
            LowRange = Lowest.Series(bars.Low, num + 1)[idx];

            if (firstIntradayBar > -1)
            {
               DrawLine(idx, HighRange, firstIntradayBar, HighRange, WLColor.Blue, 1, LineStyle.Dashed);
               DrawLine(idx, LowRange, firstIntradayBar, LowRange, WLColor.Red, 1, LineStyle.Dashed);
            }
         }
To get them to show up I had to go into candle stick settings a select outline
I can't make it happen using the posted code (and without Candlestick outlines); even for you it occurs intermittently on some charts. Either this problem is idiosyncratic to the machine or we're going to need a way to duplicate it in a practical way to be able to identify a fix.
QUOTE:
... problem is idiosyncratic to the machine ...
In other words, update the video driver on your machine. You might also try reproducing the problem on another machine with different video hardware.
Thanks. That seems reasonable. I was suspecting too many charts open and running. I'll try reducing the number to see if the issue goes away. As I mentioned toggling the streaming button fills in the chart and the strategy runs regardless.
You didn't mention there's too many charts running but it along with that Win32Exception from Post #6 now ring a bell.
Your Response
Post
Edit Post
Login is required