You may say it’s not a big deal…))
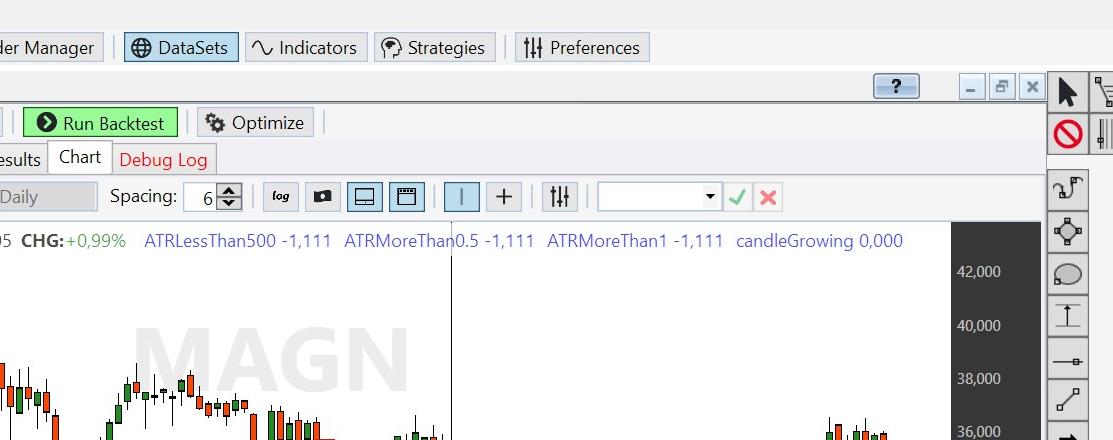
I use binary timeseries to show values whether each of my filters true or false on the certain candle. I use PlotStyles.BooleanDots to plot this. I do not use values above 0 so there are no dots on the chart shown, I use -1 instead of 1 and 0 as 0. But the values are shown as 0.000 and 1.000. Can I change it somehow? Can I set int type for my timeseries? I changed -1(-1.000) to -1.111 to make the 0-1 difference more eye-catching. But I still prefer to see 0/1 instead of 0.000/1.000 or 0.000/1.111 )).
I use binary timeseries to show values whether each of my filters true or false on the certain candle. I use PlotStyles.BooleanDots to plot this. I do not use values above 0 so there are no dots on the chart shown, I use -1 instead of 1 and 0 as 0. But the values are shown as 0.000 and 1.000. Can I change it somehow? Can I set int type for my timeseries? I changed -1(-1.000) to -1.111 to make the 0-1 difference more eye-catching. But I still prefer to see 0/1 instead of 0.000/1.000 or 0.000/1.111 )).
Rename
The values in a TimeSeries are inherently of type double. 🤷♂️
I see, thanks).
Your Response
Post
Edit Post
Login is required